Brain networks of cognition and language
In the last decade the cognitive neuroscience of language has gradually shifted its focus from deciphering the functions of individual brain regions (e.g., the superior temporal gyrus for phonological processing) to identifying the spatial and temporal dynamics of interconnected brain networks (e.g., the functional connectivity between superior temporal gyrus, middle temporal gyrus, and inferior frontal gyrus). This new focus resonates with the movement in cognitive neuroscience that considers cognitive functions not as modularized independent systems (Fodor, Reference Fodor1983), but as the output of dynamic interactions between multiple brain structures. Even within a modular sub-system (e.g., primary auditory or motor areas), the brain does not rely on ‘encapsulated’ modes of operation, but rather on concurrently operating regions with soft boundaries to achieve many-to-many structure-function mappings (Bassett & Gazzaniga, Reference Bassett and Gazzaniga2011). Thus, by looking at not just the activation of individual brain regions, but also the spatial and temporal relationships that hold among multiple brain regions during cognitive and linguistic tasks, we can gain a better understanding of long-standing debates on localization, organization, and plasticity (c.f., Bates, Reference Bates, Broman and Fletcher1999).
A number of recent publications have called attention to the brain networks perspective toward cognition, in both healthy and clinical populations (Bassett & Gazzaniga, Reference Bassett and Gazzaniga2011; Bassett, Wymbs, Porter, Mucha, Carlson & Grafton Reference Bassett, Wymbs, Porter, Mucha, Carlson and Grafton2011; Bressler & Menon, Reference Bressler and Menon2010; Menon, Reference Menon2011; Bullmore & Sporns, Reference Bullmore and Sporns2009; Sporns, Reference Sporns2011). Bressler and Menon (Reference Bressler and Menon2010) provided a framework for analyzing large-scale brain networks for cognition, in which several interconnected structures in the frontal, temporal and parietal regions are identified as key networks for handling attention, memory and cognitive control. These networks are highly dynamic and interactive, but also show distinct cognitive functions. For example, endogenously generated, ‘mind wandering’ mental states (the ‘resting state’) may evoke a neural network (i.e., the default mode network) distinct from that of externally driven, cognitively demanding tasks (i.e., the central-executive network) and, within this framework, it is also possible to move from one network to the next through attentional switching, a mechanism of the salience network. To quantify the interaction between such networks, one needs to examine the nodes (key regions of interest in the brain), the edges (the connections between the nodes), and identify the directions of information flow from one node to the next, and the strength of the edges that connect the different nodes. These characteristics of brain networks are reminiscent of the properties of connectionist or PDP networks that have been long studied in the context of cognition, language and bilingualism for the past decades (McClelland, Rumelhart & the PDP Group, Reference McClelland and Rumelhart1986; Rumelhart, Reference Rumelhart and Posner1989; see connectionist models of bilingualism as reviewed in Li & Zhao, Reference Li and Zhao2013, Reference Li, Zhao and Schwieter2015). It is important, however, to note that although most cognitive neuroimaging studies have so far focused on functional brain networks, the connectivity patterns in the structural/anatomical brain networks can be similarly studied, albeit with different analytic techniques (see Li, Legault & Litcofsky, Reference Li, Legault and Litcofsky2014; García-Pentón, Pérez Fernández, Iturria-Medina, Gillon-Dowens & Carreiras, Reference García-Pentón, Pérez Fernández, Iturria-Medina, Gillon-Dowens and Carreiras2014 for recent analyses of anatomical changes due to bilingualism and the analytic methodologies therein).
It is the new methodological development in connectivity analysis that has rapidly moved neuroimaging research beyond the roles played by single nodes in the brain to the study of the dynamic interactions among nodes in brain networks (see Bullmore & Sporns, Reference Bullmore and Sporns2009; Friston, Reference Friston2009; Gates, Molenaar, Hillary, Ram & Rovine, Reference Gates, Molenaar, Hillary, Ram and Rovine2010; Gates & Molenaar, Reference Gates and Molenaar2012). Many different types of data analytics may be applied to the study of brain networks, including Granger causality analysis, independent component analysis, dynamic causal modeling, and structural equation modeling, to name a few (see Bressler & Menon, Reference Bressler and Menon2010; Sporns, Reference Sporns2011 for reviews). For example, to capture brain network adaptability, we can calculate ‘node flexibility’, the number of times each node changes allegiance to modules, normalized by the total possible number of changes, and then take the mean flexibility over all nodes within a network as the index of the network's overall flexibility (see Bassett et al., Reference Bassett, Wymbs, Porter, Mucha, Carlson and Grafton2011). We can also calculate the average number of edges between any two nodes: the fewer the number of edges needed to go from one node to the next, the better connected the two nodes within a network (i.e., with high efficiency). Many other methods of network analyses are also available within a graph-theoretical approach; for example, measures such as ‘node degree’ (number of edges connected to a given node), ‘clustering coefficient’ (number of edges between the nodes in the nearest neighborhood), ‘connection density’ (actual number of edges divided by the total number of all possible edges in a network), and ‘small-worldness’ (organization of network with high clustering and high efficiency), have all been applied to the study of brain networks (see Bullmore & Sporns, Reference Bullmore and Sporns2009; Rubinov & Sporns, Reference Rubinov and Sporns2010 for details).
In addition to the more popular ‘functional connectivity’ analysis, we could also use ‘effective connectivity’ analysis: the latter involves the identification of the direction of influences between nodes as well as the strength of connections, whereas the former involves only node-to-node correlations of connection strength on a non-directional basis. Effective but not functional connectivity analysis allows for causal inferences regarding how one brain region influences another, and the dynamic interactions among nodes in general. Some effective connectivity techniques further allow for analysis of not only contemporaneous relationships – the effect of X on Y at Time 1; but also lagged relationships – the effect of node X at Time 1 on node Y at Time 2. In several studies discussed below we have applied both functional and effective connectivity analyses to study the brain networks of bilingual language learning and processing, using the unified structural equation modeling (uSEM) or the extended uSEM (euSEM) methods (see Gates et al., Reference Gates, Molenaar, Hillary, Ram and Rovine2010; Gates, Molenaar, Hilary & Slobounov, Reference Gates, Molenaar, Hillary and Slobounov2011). These models, due to their data-driven analytic capabilities, have enabled us to reveal the neurocognitive mechanisms of second language learning and processing in an effective way.
Brain networks and individual differences in language learning
The brain networks approach toward cognition and language has received increasing attention, and several authors have pointed out that it can, for both healthy subjects and patient populations, reveal important individual differences that previous single node-based, activation-based approaches cannot (Bassett et al., Reference Bassett, Wymbs, Porter, Mucha, Carlson and Grafton2011; Zalesky, Fornito & Bullmore, Reference Zalesky, Fornito and Bullmore2010; see Sporns, Reference Sporns2011 for a synthesis). Sporns stated, “. . .if patterns of brain connectivity are associated with cognition, then individual variations in brain networks should also be associated with variable cognitive performance (2011, p.199).” A number of recent studies have already adopted the brain networks approach toward individual differences in linguistic performances and, more specifically for our discussion, in second language phonological and lexical learning.
Sheppard, Wang and Wong (Reference Sheppard, Wang and Wong2012) trained participants to learn sound-picture associations in a word learning task, and analyzed the BOLD (Blood Oxygen-Level Dependent) responses of the participants during auditory discrimination. Using graph-theoretical analytic methods, these authors were able to differentiate the network patterns of the successful learners from those of the less successful learners: successful learners showed more global network efficiency whereas the less successful learners showed more local network efficiency. They defined the efficiency of the brain networks in terms of the average number of edges between the nodes as discussed earlier. In another study, Veroude, Norris, Shumskyaya, Gullberg and Indefrey (Reference Veroude, Norris, Shumskaya, Gullberg and Indefrey2010) exposed participants to Chinese words through an implicit task, in which participants watched weather charts and listened to continuous speech streams from a weather report in Mandarin Chinese. Participants were classified as learners (who showed sensitivity to Chinese words) and non-learners (who did not) based on their performance on a post-training auditory word recognition task. The two groups of participants displayed different functional connectivity: the learners, as compared with the non-learners, had stronger connections between the left and the right supramarginal gyrus (SMG), consistent with the important role that the SMG plays in processing phonological word forms during language learning.
An important, and somewhat surprising, finding is that resting-state functional connectivity (rs-FC) patterns, mostly indicative of activations in the default mode network (Raichle MacLeod, Snyder, Powers, Gusnard & Shulman, Reference Raichle, MacLeod, Snyder, Powers, Gusnard and Shulman2001), are also correlated with individual differences in second language learning success. As mentioned earlier, the default mode network activates a set of frontal and parietal regions when a person is engaged in endogenously generated, self-referential (e.g., mind wandering), mental states. The learners in the Veroude et al. (Reference Veroude, Norris, Shumskaya, Gullberg and Indefrey2010) study, in addition to showing stronger task-induced functional connectivity within the SMG, also showed stronger rs-FC patterns than the non-learners. In a more recent study using the rs-FC method, Ventura-Campos, Sanjuán, González, Palomar-García, Rodríguez-Pujadas, Sebastián- Gallés, Deco & Ávila (Reference Ventura-Campos, Sanjuán, González, Palomar-García, Rodríguez-Pujadas, Sebastián- Gallés, Deco and Ávila2013) trained participants to learn to discriminate non-native sound contrasts in an intensive 2-week training study. These authors analyzed both resting-state and task-induced (i.e., phonetic discrimination) BOLD signal changes, and found that rs-FC patterns in a number of phonology-processing regions correlated with the participants’ learning success. Specifically, before training, the greater rs-FC between the left inferior frontal gyrus (IFG)/anterior insula and left superior parietal lobule (LSPL), the better an individual's phonetic discrimination; after training, the greater the reduction between these regions, the better the learning outcome. These data suggest that the IFG and the LSPL need to be decoupled as learning advances, so that the learner can pay more attention to relevant properties of the linguistic stimuli, effectively switching from the default mode network to the saliency network (Bressler & Menon, Reference Bressler and Menon2010).
While the analysis of brain networks from fMRI studies can be informative as discussed, structural/anatomical correlates have also been found to be insightful into individual differences in bilingualism and second language learning. For example, in a study of structural connectivity among early bilinguals and monolinguals, García-Pentón et al. (Reference García-Pentón, Pérez Fernández, Iturria-Medina, Gillon-Dowens and Carreiras2014) found that bilinguals, as compared with monolinguals, showed increased local connectivity in two sub-networks. The first sub-network included the IFG and MFG connected to IPL and STG, areas that are critical for cognitive control and language processing, and the second sub-network involved the superior frontal cortex connected with anterior temporal, parietal and left occipital sites. García-Pentón et al. suggested that the increased degree of interconnectivity is specific to bilinguals due to their additional language experience with the L2. By contrast, monolinguals showed greater global efficiency than the bilinguals, suggesting that bilinguals’ greater local efficiency among language processing regions may come at a cost to global efficiency. With regard to second language learning, Li et al., (Reference Li, Legault and Litcofsky2014) provided a synthesis of how structural brain patterns or changes may be associated with experience or success in a second language. Stein, Winkler, Kaiser and Dierks (Reference Stein, Winkler, Kaiser and Dierks2014) additionally suggested that white matter integrity in the tracts connecting the frontal, occipital, and temporal regions may be modulated by context of learning (e.g., immersion vs. classroom-based learning). Several studies have shown that increased white-matter density or gray-matter volume in the left Heschl's gyrus, a critical auditory processing region, is associated with a faster rate to learn non-native speech contrasts such as Chinese lexical tones or Hindi retroflex sounds (Golestani & Pallier, Reference Golestani and Pallier2007; Golestani, Molko, Dehaene, LeBihan & Pallier, Reference Golestani, Molko, Dehaene, LeBihan and Pallier2007; Wong, Perrachione & Parrish, Reference Wong, Perrachione and Parrish2007). More importantly, pre-existing variability in structural connectivity or pathways between regions may also be powerful indicators of learning success. For example, Xiang, Dediu, Roberts, Norris & Hagoort (Reference Xiang, Dediu, Roberts, Norris and Hagoort2012) correlated individual learners’ performances on language aptitude tests with measures from diffusion tensor imaging (e.g., fractional anisotropy or FA), and found that variability in the structural pathway from the IFG to posterior temporal lobe reflects the individual learner's grammatical learning ability, whereas that from the IFG to the parietal lobe reflects the learner's vocabulary learning ability. These findings, along with analyses of functional connectivity, whether resting-state or task-induced, point to important future avenues for studying individual differences in bilingualism and second language learning.
A new paradigm for examining second language learning success
The study of the dynamic patterns associated with brain networks, functional or structural, could set a new paradigm for capturing individual differences in second language learning success. In a recent study, Yang and Li (Reference Yang and Li2012) trained learners outside the scanner and tested their performance inside it on an artificial grammar learning (AGL; Reber, Reference Reber1967) task. One group of learners were told to look for the rules underlying the target sequences in the AGL task (explicit group), while the other group were simply exposed to the learning sequences (implicit group). The authors showed that the two groups displayed significantly different brain networks as a result of the different methods of learning. Interestingly, the two networks may involve activation of the same nodes but the edges between the nodes showed different patterns of connectivity, reflected in the varying strengths and directionality of the edges that connect the inferior frontal, the anterior insula, the precuneus, and the caudate nucleus regions. For example, the explicit learners engaged a network that relies on the insula as a relay station, whereas the implicit learners evoked a more direct frontal-striatal network in learning.
That we can use brain networks to differentiate two different learning groups is important, but not earth shattering. To further tackle the issue of individual difference according to Sporns (Reference Sporns2011) discussed above, Yang and Li (Reference Yang and Li2012) used a method of correlating brain activation patterns with behavioral performance on both linguistic and non-linguistic cognitive tasks, and found that for explicit learners but not implicit learners, phonological working memory capacity was positively correlated with performance accuracy, which was also correlated with the extent of functional brain activation in the left dorsolateral prefrontal cortex (dlPFC). The dlPFC has been implicated as a hub for the working memory network (Baddeley, Reference Baddeley2003a), and ample evidence has shown that working memory is highly predictive of individual differences in second language learning (Baddeley, Reference Baddeley2003b; Baddeley, Gathercole & Papagno, Reference Baddeley, Gathercole and Papagno1998; Miyake & Friedman, Reference Miyake, Friedman, Healy and Bourne1998; O'Brien, Segalowitz, Collentine & Freed, Reference O'Brien, Segalowitz, Collentine and Freed2006).
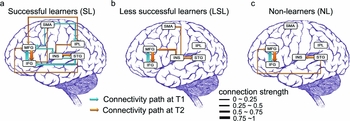
While the above study focused on artificial grammar learning, Yang, Gates, Molenaar and Li (Reference Yang, Gates, Molenaar and Li2015) examined second language lexical learning in a tonal language. They tested 39 participants who were brought to a six-week training session to learn a new vocabulary that resembled the syllabic structure and tonal distinctions in Mandarin Chinese. In a pre-test (T1) and post-test (T2) training schedule, the participants were scanned at T1 and T2 in response to the same stimuli, separated by six weeks during which vocabulary learning took place for 23 of the participants (the remainder served as a control group who did not go through training but were also scanned at T1 and T2). This procedure allowed us to effectively track neural changes underlying both learners’ and non-learners’ behavior. A major finding from this work is that the successful learners (who reached 96% accuracy on the L2 vocabulary) showed brain network patterns that are significantly different from the patterns of the less successful learners or the non-learners (control participants), as revealed by the effective connectivity analyses using the euSEM model (Gates et al., Reference Gates, Molenaar, Hillary and Slobounov2011; Gates & Molenaar, Reference Gates and Molenaar2012). Specifically, the successful learners, as compared with both the less successful learners and the non-learners, displayed a network with more connected, better-integrated multi-path nodes at T2 after learning, as illustrated in Figure 1. More surprising is the finding that the successful learners, as compared with the other two groups, had a better-connected brain network at T1, that is, even before learning took place. This raises the possibility that we can use brain network analysis to make reasonable predictions as to who might be the more successful learners in a second language-learning task.
Different patterns of brain networks for successful learners (SL), less successful learners (LSL), and non-learners (NL) (Yang, Gates, Molenaar & Li, Reference Yang, Gates, Molenaar and Li2015; Fig. 3). The effective connectivity maps were constructed for six ROIs (IFG, inferior frontal gyrus; MFG, middle frontal gyrus; SMA, supplementary motor area; INS, insula; STG, superior temporal gyrus; IPL, inferior parietal lobule). Arrows in the connectivity maps represent the BOLD activity in one ROI that statistically predicts BOLD activity in another ROI: arrow width indicates connection strength, and direction of arrows indicates the influence that goes from one node to the other. Blue lines indicate relationships at T1, while orange lines indicate influences at T2.
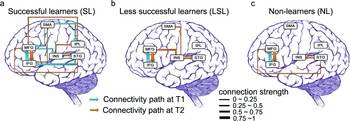
How could a neural system that is more receptive to learning be detected by brain network analyses? In the data illustrated in Figure 1, the successful learners showed a well-integrated network that involves pathways between frontal regions (IFG) and temporal regions (e.g., STG) and between IFG and parietal regions (IPL), regions that are known to be critical for lexical access, auditory/phonetic processing, and phonological working memory; hence it is no surprise that an integrated network with these nodes might enable the successful learners to do better in a vocabulary learning task that involves lexical tonal contrasts. These functional networks and their operation are consistent with our understanding about how learners shift their focus from treating tones as non-linguistic acoustic signals (using primarily the right hemisphere) to linguistic phonetic signals (using the left or both hemispheres; see Wang, Sereno, Jongman & Hirsch, Reference Wang, Sereno, Jongman and Hirsch2003; Zhang, Xi, Xu, Shu, Wang & Li, Reference Zhang, Xi, Xu, Shu, Wang and Li2011). They are also consistent with our knowledge about pre-existing variability in structural/anatomical pathways, which involve increased fronto-temporal and fronto-parietal connections in white matter tracts for better learners compared with poor learners (see Xiang et al., Reference Xiang, Dediu, Roberts, Norris and Hagoort2012; Li et al., Reference Li, Legault and Litcofsky2014 for review).
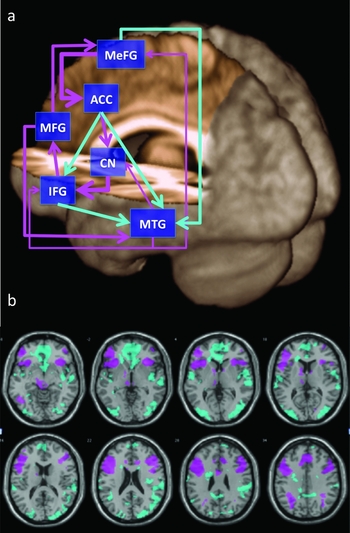
We have also started to use the brain networks approach to track neural changes not only in training studies as in Yang et al. (Reference Yang, Gates, Molenaar and Li2015), but also in longitudinal research with which we can follow the same participants for an extended period of time. It is important to note that longitudinal-design neuroimaging studies, though still rare, are crucial for understanding learning-induced behavioral and brain changes (see Li & Green, Reference Li and Green2007, for an earlier call). Della Rosa, Videsott, Borsa, Canini, Weekes, Franceschini & Abutalebi (Reference Della Rosa, Videsott, Borsa, Canini, Weekes, Franceschini and Abutalebi2013) followed the same participants for one year and analyzed structural brain changes, showing increased gray matter density in the IPL in the highly talented second language learners. In Grant, Fang and Li (Reference Li, MacWhinney and O'Grady2015), we tracked 19 classroom L2 learners of Spanish across one academic year, and identified the changes that occurred in their brain networks as a result of increased second language proficiency. At two time points, once in the fall semester (T1) and once in the spring semester (T2), these learners were tested in the scanner on a lexical decision task, in which they had to identify both language-unambiguous words (e.g., clearly English or clearly Spanish) and language-ambiguous words (e.g., Spanish–English homographs such as pie, which means foot in Spanish). Figure 2(a) shows a functional connectivity analysis based on the euSEM, as in Yang et al. (Reference Yang, Gates, Molenaar and Li2015): increased proficiency is associated with a more integrated semantic processing network, as shown by how the middle temporal gyrus (MTG) serves as a clear hub connecting with various other areas in frontal (e.g., IFG) and temporal regions at T2. This was not the case at an earlier learning stage (T1), when the network was characterized by stronger connections within the cognitive control network and weaker connections in the semantic network for meaning processing (not shown here; see Fig. 4 of Grant et al., Reference Grant, Fang and Li2015). Figure 2(b) additionally shows, when processing in the second language, activation decreased in response to language-ambiguous words (homographs) from T1 to T2 in IFG and middle frontal gyrus (MFG), areas that have been implicated in cognitive control; at the same time, activation increased in middle temporal gyrus (MTG) which has been implicated in semantic representation and processing. These dynamic changes in the brain network patterns indicate a shift from focusing on control of the competition between the learner's two languages to focusing on meaning processing of the second language words, a shift that occurs alongside the learner's improved proficiency in the new language.
(a) A semantic processing network with the Middle Temporal Gyrus (MTG) as the network hub. Cyan indicates connections that are new at Time 2. (b) Activation of contrast between Spanish–English homograph > Spanish non-homographic words from T1 to T2 (magenta = activity greater at T1; cyan = activity greater at T2; based in part on Fig. 3 of Grant, Fang & Li, Reference Li, MacWhinney and O'Grady2015).

Conclusion
The neural signatures of second language learning as reflected in brain networks provide interesting avenues for exploring why and how second language learning may be successful or not. This paper provides a new vantage point from which we hope to address important theoretical issues regarding individual differences, neuroplasticity, and brain organization. The study of dynamic changes in brain networks has shed new light on our understanding of the relationships among brain, cognition and behavior in both linguistic and non-linguistic domains (see Bressler & Menon, Reference Bressler and Menon2010; Bullmore & Sporns, Reference Bullmore and Sporns2009; Fedorenko & Thompson-Schill, Reference Fedorenko and Thompson-Schill2014; Sporns, Reference Sporns2011). Recent interests in the dynamic reconfiguration of functional and structural brain networks also indicate that the study of dynamic interactions among attention, memory, cognitive control, and language is likely to yield significant insights into brain structure-function relationships, and into individual differences in learning and cognitive ability across the developmental life span (see Bassett et al., Reference Bassett, Wymbs, Porter, Mucha, Carlson and Grafton2011; Uddin, Supekar, Ryali & Menon, Reference Uddin, Supekar, Ryali and Menon2011 for example).
In a seminal paper that predated much of our current knowledge about neuroimaging and bilingualism, Bates (Reference Bates, Broman and Fletcher1999) proposed a dynamic emergentist perspective regarding experience-dependent neuroplasticity, brain organization and reorganization, and language acquisition. She described the dynamic interactions that characterize the relationships among neural structure, neurogenesis/synaptogenesis, brain maturation, cognitive and language learning-induced neural changes, and the implications that these interactions have for understanding the time course of both neuroplasticity and language development, especially with regard to the contentious issue of the critical period of language learning (see further synthesis in Elman, Bates, Johnson, Karmiloff-Smith, Parisi & Plunkett, Reference Elman, Bates, Johnson, Karmiloff-Smith, Parisi and Plunkett1996). This perspective of dynamic emergentism has led researchers in recent years to explore dynamic changes in the context of bilingualism and second language learning, especially with regard to issues related to the competition and control of L1 vs. L2, age of acquisition of L2 relative to L1, and the bilingual's experience and proficiency in the L2 (see Abutalebi & Green, Reference Abutalebi and Green2007; Hernandez, Reference Hernandez2013; Hernandez & Li, Reference Hernandez and Li2007; Li, Reference Li, MacWhinney and O'Grady2015 for reviews). For example, Abutalebi and Green (Reference Abutalebi and Green2007) proposed that the initial difference between L1 and L2 processing is reflected in the stronger engagement of the control system, which includes a network of regions in the PFC, the ACC, the basal ganglia, and the IPL. They further suggested that as the L2 learner gains more proficiency, the neural network subserving the L2 should converge with that of the L1.
Brain network findings from our studies, as illustrated above in Figure 1 (Yang et al., Reference Yang, Gates, Molenaar and Li2015) and Figure 2 (Grant et al., Reference Grant, Fang and Li2015), further highlight the dynamic changes that are due to the interplay between cognitive control, language proficiency, experience and processing efficiency in the L2, as reflected in the functional neural changes in both node activities and edge strengths in the brain network. Interestingly, such changes appear to occur even outside an active learning environment. A recent paper by Tu, Wang, Abutalebi, Jiang, Pan, Li, Gao, Yang, Liang, Lu & Huang (Reference Tu, Wang, Abutalebi, Jiang, Pan, Li, Gao, Yang, Liang, Lu and Huang2015) showed that for highly proficient simultaneous bilinguals, brief language exposure could mediate brain activation during language use. Specifically, the authors found that after a brief period of reduced exposure to their L2, the participants showed increased activity in the left IFG and MFG when using the L2, along with a significant negative correlation between L2 exposure and activity in the ACC. These findings, in connection with the literature discussed above (e.g., Veroude et al., Reference Veroude, Norris, Shumskaya, Gullberg and Indefrey2010), suggest that the dynamic changes in brain network patterns may capture the nature of bilingual language experience, even in non-traditional learning contexts.
Taking this dynamic perspective, we can suggest that the configuration and reconfiguration in brain networks due to L2 experience depend on a variety of variables, including the nature of the learning input (e.g., the linguistic features and similarities of the two languages), the timing of learning (age of acquisition), the extent of the learning experience (the intensity with which learning takes place), the context and method of learning (e.g., classroom-based vs. cyber-enabled vs. immersion context learning), and above all, the individual differences of the learner (e.g., working memory and cognitive control) in interaction with these variables. Despite the many challenges facing us in accurately and precisely delineating such variables and their roles, we believe that a dynamic perspective inspired by brain network analyses provides new insights into the neurocognitive bases of L1 and L2 and stimulates new experimentation and conceptualization toward the understanding of individual differences in second language learning success.