Introduction
Many next-generation engineering systems will rely on high-performance metals with strength and toughness several times those in use today. One popular class of interface-dominant materials are nanolayered composite thin films. These materials have a two-dimensional structure and are comprised of a layered stack of two different metals, wherein the individual layer thickness h has nanoscale dimensions (usually h < 100 nm), and the density of interfaces is unusually high.Reference Subedi, Beyerlein, LeSar and Rollett1–Reference Misra, Zhang, Demkowicz, Hoagland and Nastasi4 Studies on nanolayered films report exceptional structural properties compared to those of their constituents or volume average values of their constituents, such as strengths that are more than 5–10 times higher, hardness values that are several orders of magnitude higher, and greater microstructural stability in harsh environments, such as irradiation, impact, or elevated temperatures.Reference Monclús, Zheng, Mayeur, Beyerlein, Mara, Polcar, Llorca and Molina-Aldareguía5–Reference Misra and Hoagland11
The combination of high strength with other desirable structural properties can be attributed to the physical dominance of the biphase interfaces in the material. Spacing between layers has nanoscale dimensions (2–50 nm) and is spanned most often by a single crystal. The density of biphase interfaces in a typical nanolaminate is unusually high, significantly affecting the mechanical behavior, or in some cases, the intrinsic properties of the adjoining phases. Consequently, the nanolaminate concept has gained widespread attention, with the number of composite material systems being studied growing rapidly, such as Cu/Nb, Cu/Ni, Cu/Ag, Cu/Cr, Cu/Mo, Al/Nb, Fe/W, and Cu/Ta.Reference Subedi, Beyerlein, LeSar and Rollett1,Reference Misra, Zhang, Demkowicz, Hoagland and Nastasi4,Reference Zhang, Zhao, Li, Wang, Wu, Liu and Sun12–Reference Kim, Budiman, Baldwin, Mara, Misra and Han14 While in principle nanolaminates can be made with any two-phase, bimetallic system, the constituent metals often have a cubic crystal structure, such as face-centered cubic (fcc) or body-centered cubic (bcc), and considerably fewer studies have focused on nanolaminates combining noncubic/cubic phases.
Many important structural metals used today have a noncubic crystal structure. Some examples of well-known, low-symmetry noncubic materials are hexagonal close-packed (hcp) metals, such as Mg and Ti and their alloys, and orthorhombic materials, such as uranium. The hcp class of materials alone are technologically relevant, bearing desirable intrinsic properties, such as low specific density, fatigue resistance, biocompatibility, corrosion resistance, and radiation resistance of Zr, just to name a few. At present, for even the coarse-grained traditional form, there is an increasing demand to use these materials more often and more broadly in structural applications within the automotive, aircraft, aerospace, biomedical, and nuclear industries.Reference Heinz, Haszler, Keidel, Moldenhauer, Benedictus and Miller15–Reference Rugg21 While clearly possessing important structural attributes, one concern with noncubic materials is that their deformation behavior is anisotropic. This arises not only from the structural complexity, from the electronic scale to the scale of the crystal, but also from the complexities engendered in their microscopic deformation mechanisms.
In this article, we review recent findings and insights from studies focused on interface-affected mechanisms induced during mechanical straining of nanolaminates consisting of alternating noncubic/cubic phases. These mechanisms and their consequences can prevail at multiple scales, and with this in mind, we include in this article examples of the effects of noncubic/cubic interfaces at different length scales. Ultimately, we hope to convince the reader that a multiscale physical perspective is needed to fully understand mechanism–microstructure–property relationships and empower materials engineers to innovate quickly for next-generation materials.
Highly anisotropic plastic response of hcp metals
We briefly review the origin of the anisotropic response of noncubic metals. In general, the plastic response of metals results from the motion of dislocations. Compared to cubic metals, dislocations in noncubic metals are known to have more complex atomic core structures. Also, unlike cubic metals, when noncubic crystals are strained, multiple distinct slip and twinning modes are often activated. In cubic metals, slip and twinning modes share the same glide plane. In noncubic crystals, however, the glide planes of the more commonly activated slip and twin modes do not coincide. Further, the activation barriers for these modes differ significantly. In hcp crystals, for instance, the critical stresses to activate the few available slip systems in the 〈a〉 direction are several times smaller than those needed to activate the 12 slip systems in the 〈c + a〉 direction.Reference Ardeljan, Beyerlein, McWilliams and Knezevic22–Reference Lentz, Risse, Schaefer, Reimers and Beyerlein24 Last, these slip modes also have their own individual dependencies on temperature and strain rate.
Consequently, the macroscale plastic deformation behavior of noncubic crystals is much more anisotropic and sensitive to changes in temperature and strain rates compared to simple cubic (fcc and bcc) metals. Taken together, these factors result in the pronounced anisotropic characteristics of noncubic metals and are the fundamental causes for their low ductility and formability.Reference Barnett, Stanford, Cizek, Beer, Xuebin and Keshavarz25,Reference Arul Kumar, Beyerlein and Tome26 The more familiar and more formable cubic metals, such as steels, have a symmetric bcc crystal structure and at least 48 available slip systems with similar activation stresses.Reference Meyers and Chawla27
Electronic structure: Pseudomorphic phases and influence of interface energy
Many of the structural noncubic/cubic nanolaminates studied to date have been formed by deposition techniques, such as physical vapor deposition (PVD). These methods enable fabrication of multilayers with individual layer thicknesses, h, with nanoscale dimensions (e.g., 2–100 nm), uniformly across the film. Typically, one grain spans an individual layer, but in the plane of the layer, the layers are polycrystalline. The noncubic/cubic interfaces are incoherent, and for certain crystallographic characteristics, comprise a periodic network of misfit dislocations. Reducing h is usually accompanied by higher material strength, but in some structures with exceedingly fine h, an interesting interface-driven phenomenon called pseudomorphic phase transformation can occur.
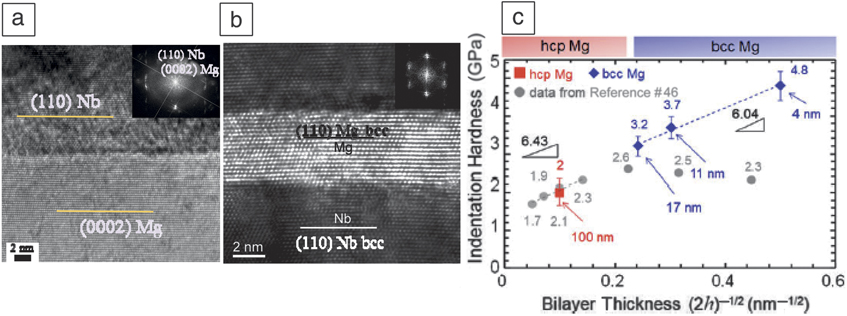
A pseudomorphic phase transformation results when a decrease in the interface energy by the formation of a coherent interface (without misfit dislocations) is greater than the increase in the bulk strain energy due to coherency strains.Reference Dregia, Banerjee and Fraser28 For a noncubic/cubic nanocomposite, the noncubic layer transforms to a cubic layer and the original noncubic/cubic interface transforms to a cubic/cubic interface. Recent investigated examples include Zr/Nb, Ti/Al, Ti/Ag, Cu/Zr, Ti/TiN, Al/AlN, Al-Al2Cu, Nb/NbC, and Mg/Nb.Reference Frutos, Callisti, Karlik and Polcar29–Reference Zheng, Ketterson and Felcher37 Some of these studies have shown that the pseudomorphic phase can exhibit unusual properties, unlike those of its more familiar, stable state. One example is the decrease in the superconducting transition temperature when hcp Zr/Nb transforms to bcc Zr/Nb.Reference Lowe and Geballe38,Reference Thompson, Banerjee, Dregia and Fraser39 As a second example, in Mg/Nb, the hcp Mg transforms to a bcc phase, causing the incoherent Mg/Nb interface to become coherent (Figure 1a–b). Hardness testing finds a continuous increase in hardness with decreasing h (Figure 1c).Reference Pathak, Velisavljevic, Baldwin, Jain, Zheng, Mara and Beyerlein30,Reference Ardeljan, Knezevic, Jain, Pathak, Kumar, Li, Mara, Baldwin and Beyerlein40 Alternatively, if reductions in h instead promote intermixing at the interface, as in Cu/Zr,Reference Zhang, Zhang, Wang, Lei, Zhang, Niu, Liu, Zhang and Sun34 or partial transformations leading to mixed phases, as in Ti/Ta or another Mg/Nb study,Reference Ham and Zhang41,Reference Hou, Zhang, Li, Wang, Wu, Liu, Zhang and Sun42 then the nanolaminate detrimentally weakens.
(a) Hexagonal close-packed (hcp) Mg/Nb nanolaminate with an incoherent interface, (b) a body-centered-cubic (bcc) Mg/Nb nanolaminate with a coherent interface, and (c) hardness of the Mg/Nb nanolaminates.Reference Pathak, Velisavljevic, Baldwin, Jain, Zheng, Mara and Beyerlein30 The x-axis is the inverse square root of the bilayer thickness, 2h. The numbers in the plot indicate 2h of the nanolaminate.
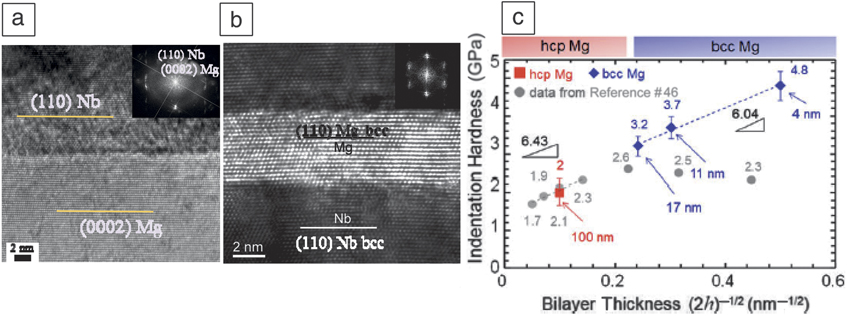
Some roadblocks to harnessing the exciting structural benefits of pseudomorphic phases are not knowing when they will occur and basic fundamental properties and deformation mechanisms. For this reason, density functional theory (DFT) has proven to be a useful tool. Recent works considered the pseudomorphic phase transformation of Mg (Figure 1).Reference Pathak, Velisavljevic, Baldwin, Jain, Zheng, Mara and Beyerlein30,Reference Junkaew, Ham, Zhang and Arróyave43 DFT in combination with thermodynamic calculations was used to determine the critical layer thickness h c below which this transformation can occur, as a function of the other phase and phase fractions. In the case of 1:1 Mg/Nb, the critical thickness was 5 nm, which corroborates with the 5 nm/5 nm Mg/Nb nanocomposite in Figure 1.
In another study aimed at understanding its deformation properties, DFT was used to determine the ideal shear strengths (ISS) associated with shearing two crystal half planes in particular crystallographic directions, akin to slip by dislocation glide.Reference Ardeljan, Knezevic, Jain, Pathak, Kumar, Li, Mara, Baldwin and Beyerlein40 The calculated ISS for the  $\left\{ {1\bar{1}0} \right\}$ and
 $\left\{ {1\bar{1}2} \right\}$ planes in the 〈111〉,〈110〉, and 〈001〉 directions in bcc Mg suggests that the two systems with the lowest ISS are the
 $\left\{ {1\bar{1}0} \right\}$ and
 $\left\{ {1\bar{1}2} \right\}$ planes in the 〈111〉 direction. The calculation further suggested that anisotropy in slip is small, with an ISS ratio of
 $\left\{ {1\bar{1}0} \right\}$ to
 $\left\{ {1\bar{1}2} \right\}$ slip of 1:1.07. These can be compared to results by the same calculation method but applied to hcp Mg, which finds that the ISS ratios for basal slip, prismatic slip, and pyramidal slip to be 1:1.48:1.54, bearing much greater differences than that for the pseudomorphic bcc Mg phase. The same method was employed to calculate the ISS for the coherent Mg/Nb interface, indicating that ISS is more than three times that of slip, suggesting that slip inside the bcc Mg phase would be preferred over the more unstable mechanisms of interfacial shearing when the nanolaminate is mechanically strained. The exciting implication is that pseudomorphic bcc Mg should behave much like conventional bcc metals, which are much less plastically anisotropic compared to the hcp Mg phase.
Interfaces under strain—Deformation mechanisms at the atomic scale
Interfaces in noncubic/cubic nanolaminates that form naturally during deposition are incoherent. As such, they are expected to be higher in energy and to contain defects, such as dislocations, disconnections, steps, and vacancies. The relaxed dislocation structures of these interfaces can be calculated via molecular dynamics (MD) simulations, provided that reliable interatomic potentials exist.
One such case was found in a recent MD study on the noncubic/cubic nanocomposite Mg/Nb, which fully characterized the misfit network for two commonly occurring hcp/bcc interfaces: the Kurdjumov–Sachs (KS) (0001)||( $01\bar{1}$)||interface, 〈
 $2\bar{1}\bar{1}$0〉||〈111〉 interface, and the Nishiyama–Wasserman (NW) (0001)||(
 $01\bar{1}$)||interface and 〈
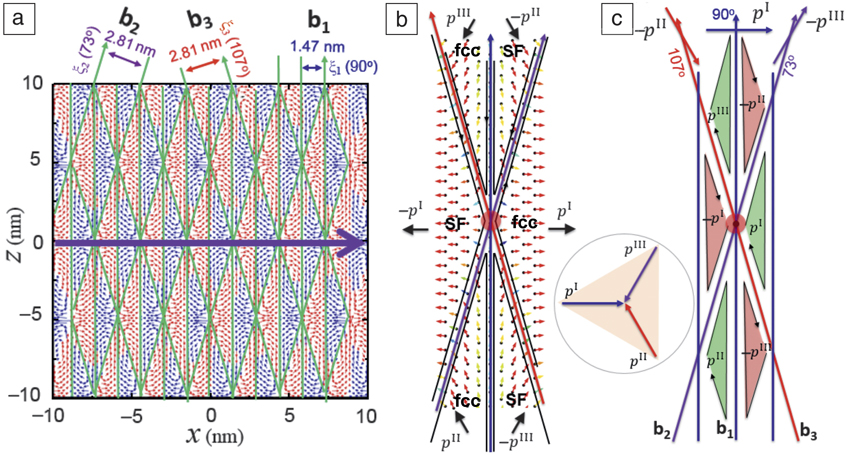
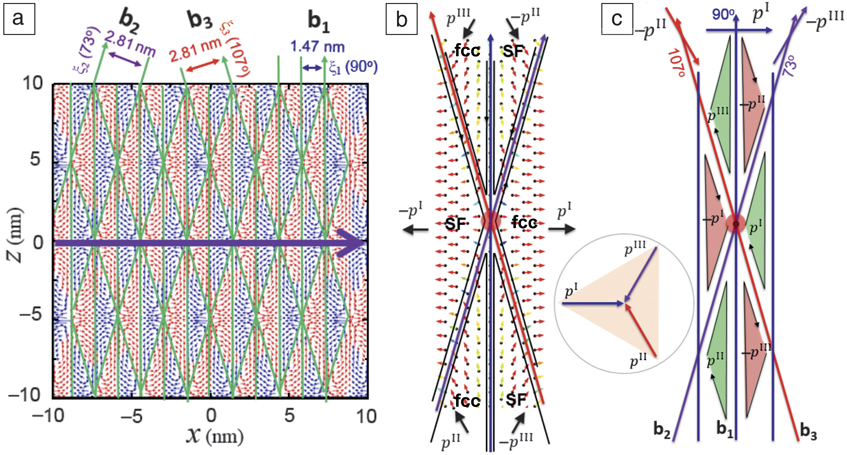
 $2\bar{1}\bar{1}$0〉||〈100〉 interface.Reference Chen, Shao, Liu, Yadav, Li, Mara and Wang44 Figure 2 shows the final relaxed atomic structures of the NW interface with their interface dislocation networks (IDNs) delineated by solid lines. As shown, the NW IDNs contain two or more intersecting regular and discrete interface dislocation (ID) arrays. Full characterization of the ID line orientation lines and their Burgers vectors (solid lines) was possible via a combination of MD simulation, interface defect theory, and discrete dislocation dynamics.
Interface dislocation network of the Mg/Nb interface.Reference Chen, Shao, Liu, Yadav, Li, Mara and Wang44 (a) Disregistry plot of the Mg/Nb interface showing spatial shears, three sets of partial dislocations and two types of coherent interfaces, normal face-centered-cubic (fcc) stacking and stacking fault (SF). Dislocation structures around a node. (b) Local shears around a node corresponding to six coherent interface regions and (c) schematic of formation mechanisms of coherent interfaces and interface dislocations.
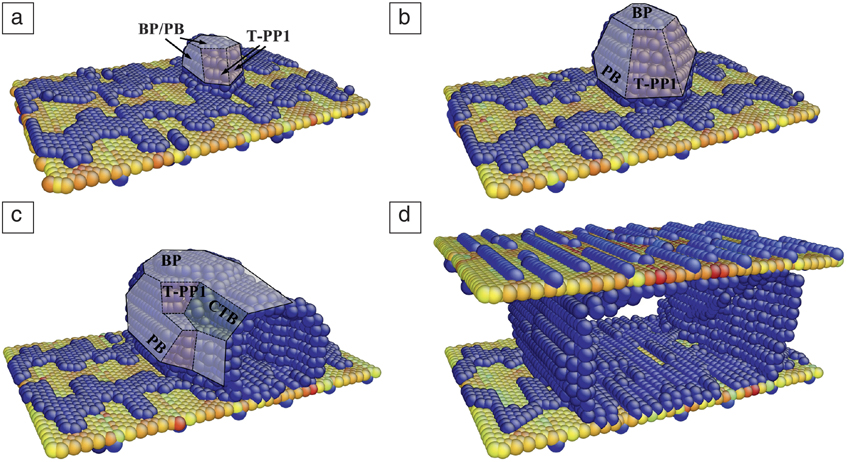
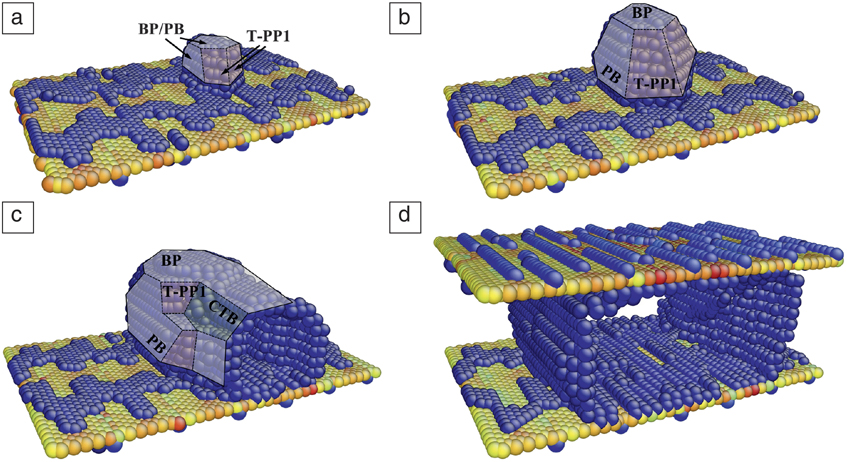
When acted upon by an applied strain, interfaces can emit or interact with impinging dislocations and deformation twins, into and out of the noncubic phase. Recently, Wang et al. studied the formation of deformation twins in Mg from an Mg/Nb NW interface.Reference Xie45 Mg is well known for its high propensity to twin, which is an important anisotropic deformation mechanism.Reference Beyerlein, Zhang and Misra46–Reference Beyerlein, Capolungo, Marshall, McCabe and Tomé48 To drive emission from these interfaces, a uniaxial strain is applied to the MD model of an NW interface in a direction that would suppress basal slip and activate nonbasal slip or deformation twinning in the Mg phase. Figure 3 shows the formation and growth of an embryonic twin. With further straining, the twin expands first along the normal of the prismatic plane and then, upon reaching the adjacent interface, expands transversely to it. Interestingly, the Mg layer reorients 90° about the z-axis (〈1120〉), while the Mg/Nb interfaces remain atomically flat, transitioning from a (110)||(0001)Reference Bai49 and 〈111〉||〈1120〉 interface to (110)||{1010} and 〈111〉||〈1120〉 interface.
Snapshots from a molecular dynamics simulation showing the formation of a twin subdomain in the Mg phase from a Mg/Nb interface.Reference Xie45 (a) A twin nucleus nucleates at the Mg/Nb interface. (b) Growth of the twin nucleus via migration of BP/PB and T-PP1 interfaces. (c, d) The twin grows through the thickness of the model and continues transverse growth via the migration of PB/BP interfaces.
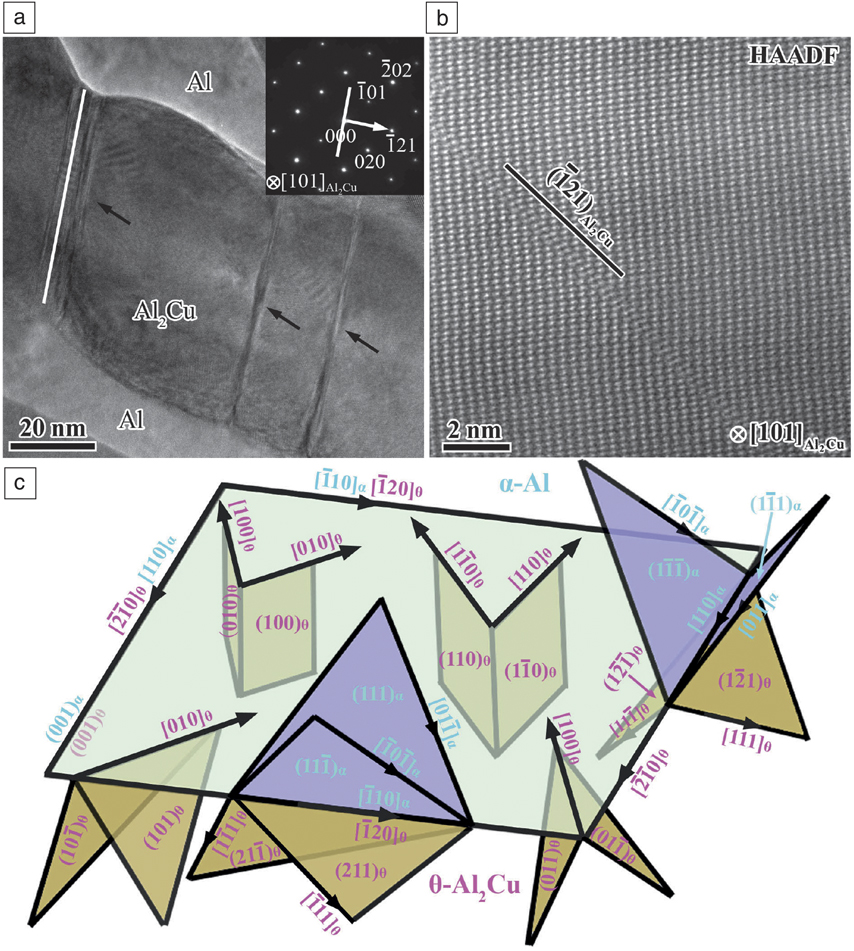
In some cases, dislocations gliding easily in the ductile cubic phase can induce deformation in an otherwise brittle NC phase. For example, an MD simulation of deformed Al-Al2Cu lamellar eutectics was also applied to study interface-induced plasticity in the C16 body-centered-tetragonal (bct) structured θ-Al2Cu phase.Reference Wang, Liu, Xie, Lei, Ramakrishnan, Mazumder, Wang and Misra50 The study showed that the fine nanoscale Al2Cu lamellae deform via shear localization on the  $\{ 011\} _{Al_2 Cu} $ planes and shear-induced faults on the
 $\{ 121\} _{Al_2 Cu} $ planes (Figure 4a), enabling the nanoscale Al2Cu phase to co-deform plastically with the soft Al rather than cracking. They found that the mechanism occurred because the active glide planes of Al, which impose the shear, were crystallographically well aligned with these two bct planes, which happen to produce low-energy faults (Figure 4b–c).
Faulted structure in nanoscale Al2Cu lamellae of rolled laser-treated material.Reference Wang, Liu, Xie, Lei, Ramakrishnan, Mazumder, Wang and Misra50 (a, b) Multiple straight fault bands in nanoscale Al2Cu lamellae; the rolling direction and normal direction are indicated by arrows in (a), the inset diffraction pattern is from the Al2Cu lamella in (b). (c) High-resolution high-angle annular dark-field (HAADF) (z-contrast) image of the straight band showing a fault structure on  $(\bar 121)_{Al_2 Cu} $ plane.
Noncubic phase versus cubic phases in interface-dominant bimetallics
Interface-dominant bimetallics possess many superior properties, but above all, the most attractive property is the exceptional (5–10 times higher) strength over that of its constituent phases. One equally outstanding characteristic of noncubic crystals is their anisotropy in strength. The question becomes whether the anisotropic strength of the noncubic phase would render the strength of nanolaminate anisotropic as well? Anisotropy in structure properties is not often studied since testing the thin-film samples in different directions is not as straightforward as it is with conventional bulk samples.
In recent work, interface strain engineering of pseudomorphic phases Mg with Nb was exploited to transform hcp Mg into stable bcc Mg at ambient pressures; the adjacent Mg/Nb interfaces were spaced within a few nanometers forming a multilayered Mg/Nb nanocomposite.Reference Pathak, Velisavljevic, Baldwin, Jain, Zheng, Mara and Beyerlein30,Reference Ham and Zhang41 It is presumed that the bcc structure of the Mg phase enables significant decreases in anisotropy and thus increases in its ductility, compared to conventional hcp Mg. At the same time, the nanostructure results in about an order of magnitude increase in strength, while remaining lightweight (i.e., high strength-to-weight ratio) in terms of elemental Mg because of the same density of bcc Mg and hcp Mg.
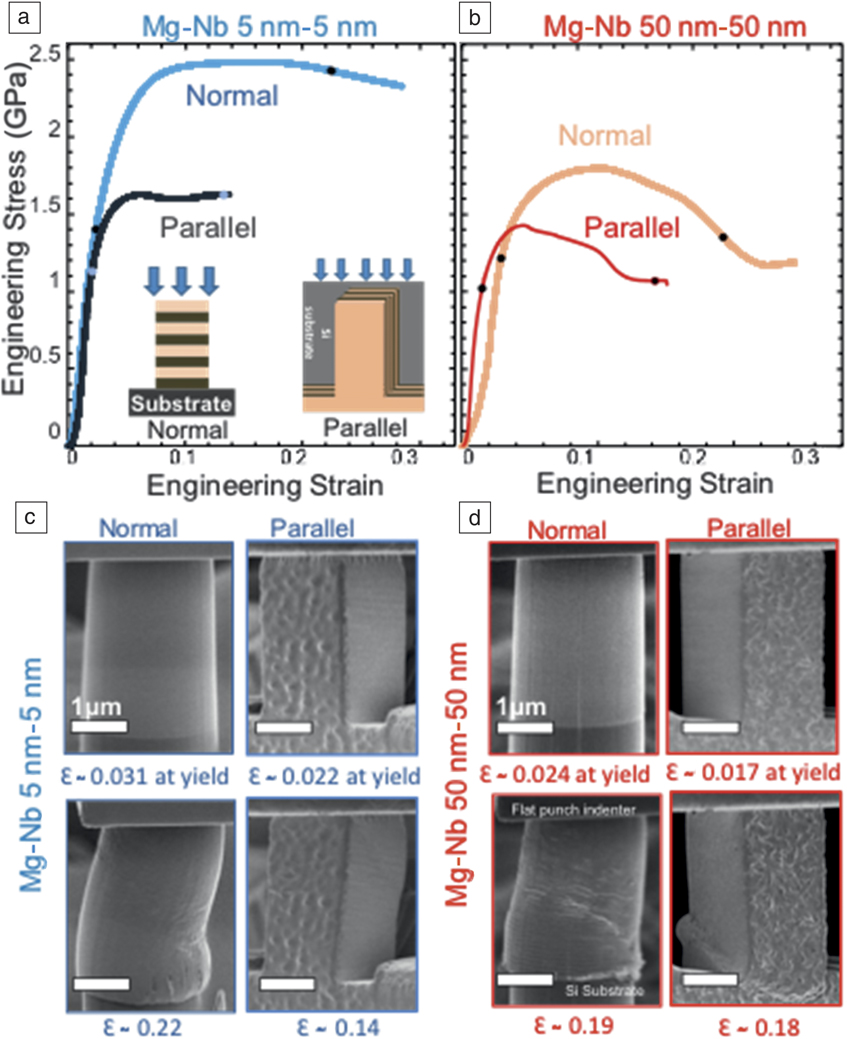
From the films shown in Figure 1, micron-diameter pillars were fabricated using a focused ion beam (FIB)-based technique and tested in compression to obtain the composite mechanical response. Micropillar compression tests were carried out with the compression axis either (1) normal or (2) parallel to the Mg/Nb interface planes. Figure 5 compares the typical engineering stress–strain curves obtained from these two micropillar compression tests. In both directions, hcp Mg/Nb and bcc Mg/Nb exhibited outstanding strength, 50% stronger than that of coarse-grained counterparts or a volume average of their strengths.
Comparison of the engineering stress–strain responsesReference Pathak, Velisavljevic, Baldwin, Jain, Zheng, Mara and Beyerlein30 between (a) Mg/Nb 5 nm/5 nm and (b) Mg/Nb 50 nm/50 nm multilayered nanocomposites with interfaces oriented normal (isostress) and parallel (isostrain) to the loading direction. (c, d) Scanning electron microscope images for each combination of layer thickness and orientation are shown below the stress–strain graphs displaying the pillar deformation at yield and after instability (as indicated by the black dots on the stress–strain graph in [a]).
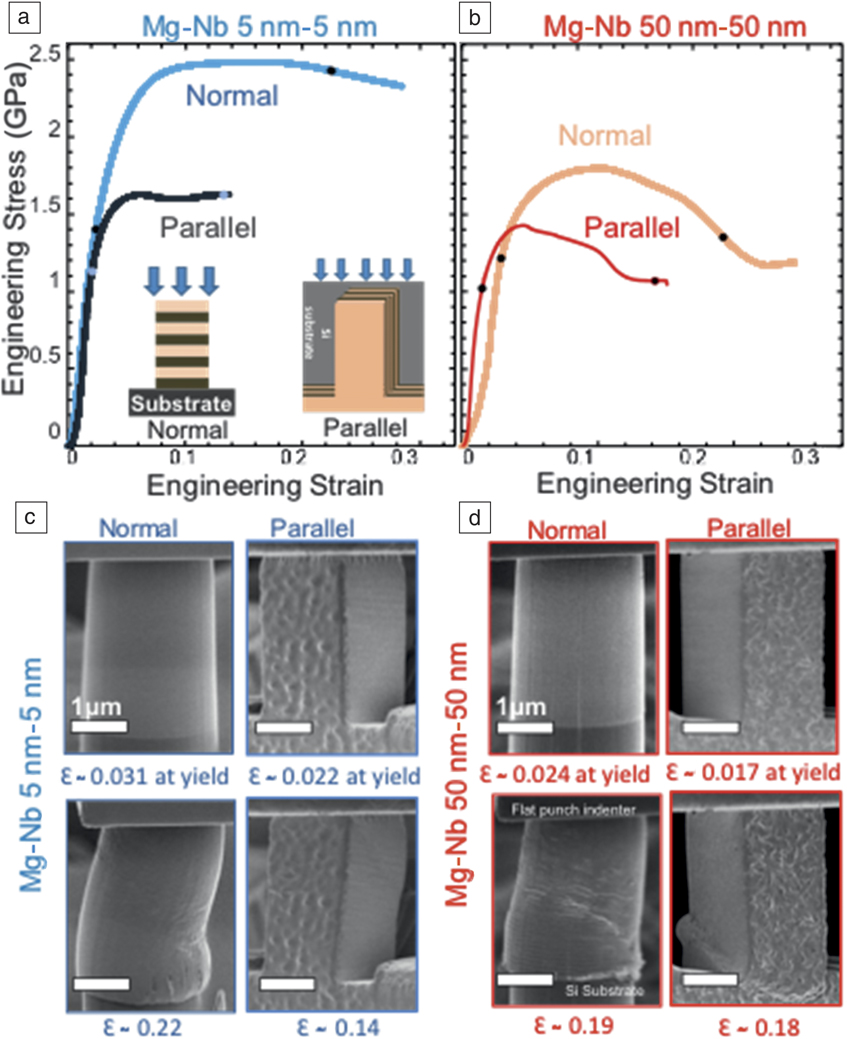
Direct observations during the in situ compression tests suggest that anisotropy of the noncubic phase is responsible for the catastrophic failure mode. The fully bcc nanolaminates exhibited a gentle, non-catastrophic failure, while the hcp Mg-based composite failed by more catastrophic shear localization and macroscopic softening. Postmortem microscopic characterization of an interrupted test indicated that shear banding, a mechanism that is promoted by plastic anisotropy, resulted in failure of the hcp/bcc Mg/Nb nanocomposite when strained normal to the interfaces.
Similar characterization found that in the parallel-interface compression tests, a local instability occurred due to the onset of kink bands, which are large-aspect-ratio microstructure domains that are misoriented and more highly deformed relative to the surrounding material. The fully developed kink band can be seen at the bottom of the pillar in Figure 5d. In general, only highly anisotropic materials, such as fiber composites, tend to fail by kink banding.Reference Nizolek, Begley, McCabe, Avallone, Mara, Beyerlein and Pollock51,Reference Nizolek, Mara, Beyerlein, Avallone and Pollock52 No kink bands were identified in the bcc Mg/Nb nanocomposites. The comparison of their failure modes implied that plastic anisotropy of the noncubic phase instigated localized failure.
Interface-affected mechanisms at the mesoscale
Materials are often designed based on their yield and ultimate strength. In newer materials, such as the noncubic/cubic nanolaminates with highly oriented and complex structures, understanding strength benefits from understanding how noncubic/cubic interfaces affect the motion of dislocations. Especially, after elastic-plastic transition, the macroscopic deformation response is the result of the collective motion of many dislocations, and for noncubic crystals, these dislocations can easily belong to at least two to three distinct modes of slip.
Over several decades, mesoscale crystal plasticity (CP)-based techniques have been advanced to relate subcrystalline multislip, multimode deformation of noncubic crystals to polycrystalline yield, and ultimate strength.Reference Beyerlein, Knezevic, Andreoni and Yip53,Reference Knezevic and Beyerlein54 While this may appear ideal for calculating noncubic/cubic nanolaminate behavior, the constitutive laws traditionally used in CP-based models consider the motion of homogeneous arrangements of dislocations, and their actions are independent of the interface and interface spacing. In nanolaminates, the layer thickness, h, is typically <50 nm in size, which is only one order of magnitude larger than the width of the dislocation core. Thus, CP-based models and their laws are usually deemed not appropriate for nanolaminates.
Ardeljan et al.Reference Ardeljan, Knezevic, Jain, Pathak, Kumar, Li, Mara, Baldwin and Beyerlein40 recently proposed a CP model with h-dependent slip strengths based on confined layer slip (CLS), a glide mechanism that has been observed in nanolaminate materials, to understand the dislocation-based mechanisms responsible for the flow response of noncubic/cubic nanolaminates.Reference Embury and Hirth55,Reference Misra, Hirth and Hoagland56 The basic idea behind CLS is that the interfaces confine the movement of the dislocations, forcing them to thread through the layers, depositing dislocation lines within the interfaces as they propagate.
The CPFE-CLS model was applied to understand the mechanisms responsible for the yield, strain hardening, and plastic anisotropy in the Mg/Nb composites shown in Figure 5c. At the subcrystalline scale, this model employs the CLS model to define the critical resolved shear stress (CRSS) for every slip system operating at a crystalline point. In hcp Mg, the three main slip modes available are basal 〈a〉 slip, prismatic 〈a〉 slip, and pyramidal 〈c + a〉 {1122}〈1123〉 slip.Reference Arul Kumar, Beyerlein and Tome26,Reference Meyers and Chawla27 For bcc Nb, the two slip modes available are {110}〈111〉 slip and {112}〈111〉 slip. At the scale of the sample, the model used an explicit representation of the Mg/Nb bi-laminate configuration and generated a sufficiently fine finite element (FE) mesh for stress and strain calculation.Reference Carpenter, Nizolek, McCabe, Zheng, Scott, Vogel, Mara, Pollock and Beyerlein57,Reference Ardeljan, Savage, Kumar, Beyerlein and Knezevic58 The FE mesh is divided into two equal sections/volumes that represent a layer of the Mg bonded to a layer of Nb. As in the fabricated film, both layers are polycrystalline in-plane, and one grain spans the layer thickness. The grains are nearly equiaxed with 50-nm thickness and 100-nm width. The initial Mg and Nb phases textures were produced by assigning orientations randomly selected from their corresponding measured textures. Mg and Nb grain pairs share a common {0001}||{011} interface plane.
After validating that the simulated stress–strain response of the micropillar tests in Figure 5 could replicate the measurement, it was then possible to analyze the underlying slip activities and determine the origins of plastic anisotropy and strain hardening. Generally, the Nb phase is the plastically stronger phase, with higher slip strengths than those of any slip mode in the Mg phase. The model predicts that Nb accommodates proportionally more applied strain in normal loading than parallel loading,Reference Ardeljan, Knezevic, Jain, Pathak, Kumar, Li, Mara, Baldwin and Beyerlein40 a difference that alone would cause interface-normal loading to give rise to a higher flow stress than interface-parallel loading.
In addition, the orientation of the crystals in the noncubic/cubic nanolaminate requires activating more 〈c + a〉 slip in the Mg phase in normal loading than in parallel loading. In Mg, pyramidal 〈c + a〉 slip has the highest CRSS compared to prismatic 〈a〉 and basal 〈a〉 slip, and thus, its larger activity at the microscopic level would explain the larger yield in normal loading than parallel loading at the macroscopic one. In formulating the CLS law, no mechanism for evolution of CLS resistance with strain (“strain hardening”) is included; yet the model was able to capture the strain hardening seen in the measurement. The model found that the strain hardening is higher in the interface-normal test than in the interface-parallel test, since the reduction in h with straining is more severe.Reference Ardeljan, Knezevic, Jain, Pathak, Kumar, Li, Mara, Baldwin and Beyerlein40
Scaling up from thin-film nanolaminates to structural sizes
The majority of research in this area has been conducted on bimetallic systems fabricated using a bottom-up approach, such as magnetron sputtering or other deposition methods. These synthesis pathways are limited in terms of industrial scale-up because of their minimal volume buildup. One approach to nanostructuring a structural-sized material is through the use of the severe plastic deformation (SPD) technique, a special class of metal-forming process designed to repetitively introduce plastic deformation without changing the sample dimensions.Reference Beyerlein, McCabe and Tomé59–Reference Valiev and Langdon61 A particularly promising SPD technique for manufacturing sheets of nanolaminated metals is accumulative roll bonding (ARB).Reference Saito, Utsunomiya, Tsuji and Sakai62 ARB takes advantage of rolling, a well-known, scalable, industrial process. It involves repetitive cycles of high reduction (e.g., >50% reduction) passes to establish the bond, followed by cutting and restacking, and rolling again. Tens to thousands of percent strain are needed to produce tens to thousands of bimetallic interfaces, spaced <100 nm apart. The final product is a thick sheet of material that is in a suitable form and size for making structures. Over the years, for a wide range of immiscible, cubic/cubic bimetallic systems, Cu/Nb, Ag/Ni, Cu/Fe, and Ag/Fe, it has been proven able to refine the individual layer size h from 1 mm to <100 nm.Reference Kikuchi, Kuwahara, Mazaki, Urai and Miyamura63–Reference Shingu, Ishihara, Otsuki, Hashimoto, Hasegawa, Daigo and Huang66 A recent series of studies focused on ARB Cu/Nb nanocomposites demonstrated that sheet material possessed a similar set of desirable properties as the Cu/Nb nanocomposite deposited films, such as high strength, thermal stability, and radiation and shock resistance.Reference Han, Demkowicz, Mara, Fu, Sinha, Rollett, Wang, Carpenter, Beyerlein and Misra8,Reference Han, Cerreta, Mara, Beyerlein, Carpenter, Zheng, Trujillo, Dickerson and Misra67–Reference Nizolek, Beyerlein, Mara, Avallone and Pollock71
Exploiting ARB for composite systems involving the technically relevant noncubic alloys, such as Zr, Mg, and Ti, has proven challenging. Many bimetallic composites with hcp constituents have been made with ARB (e.g., Al/Zn,Reference Dehsorkhi, Qods and Tajally72 Mg/Al,Reference Chang, Zheng, Xu, Fan, Brokmeier and Wu73 Ti/Al,Reference Yang, Cizek, Hodgson and Wen74 Cu/Zn,Reference Ghalandari, Mahdavian and Reihanian75 Cu/Zr,Reference Sun, Tsuji, Fujii and Li76 and Zr/NbReference Carpenter, Nizolek, McCabe, Zheng, Scott, Vogel, Mara, Pollock and Beyerlein57), but none of them were able to continue the plastic-forming process to the extreme amounts of accumulated strains necessary to produce nanolayered material. The cubic systems used in prior ARB studies are soft and formable, whereas the significantly higher plastic anisotropy characteristic of noncubic metals compared to cubic metals, limits their formability and ability to be repeatably deformed by ARB without cracking and shear banding. Carpenter et al. recently used ARB to produce a continuous layered nanostructured Zr/Nb material with layer thicknesses below 100 nm from stacks of 1 mm thick stock sheet metal.Reference Carpenter, Nizolek, McCabe, Zheng, Scott, Vogel, Mara, Pollock and Beyerlein57,Reference Ardeljan, Savage, Kumar, Beyerlein and Knezevic58
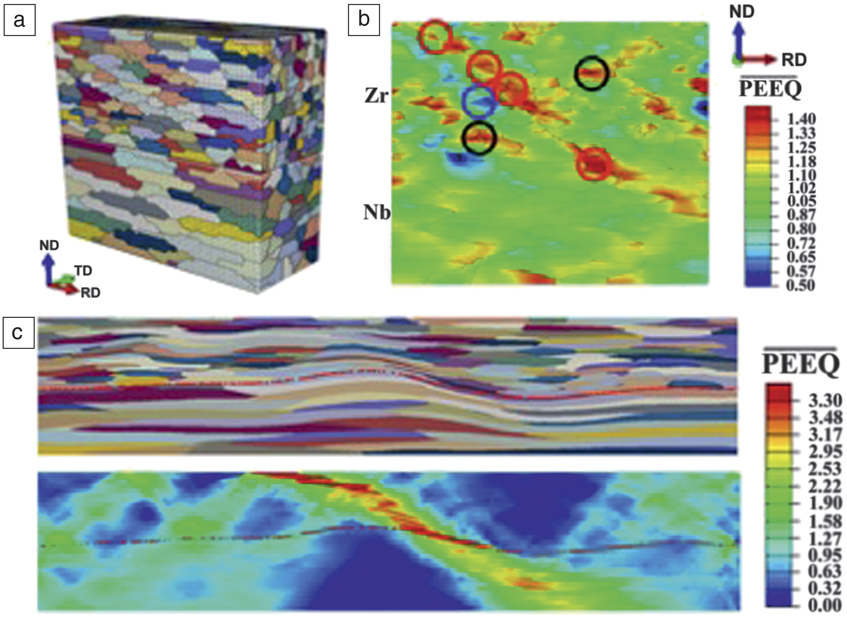
To reduce the layers from 1 mm to 100 nm layers, the key additional processing step was intermediate annealing at a relatively high temperature of 550°C. If this was not employed, the material would undergo shear banding and edge cracking, two instabilities that would prevent further layer refinement with increased mechanical deformation. The critical need for intermediate annealing was identified by a combination of microstructure characterization and multiscale modeling to understand the microstructural and mechanistic origins of the shear bands.Reference Ardeljan, Knezevic, Nizolek, Beyerlein, Mara and Pollock77 Figure 6a shows the model, which fully mirrored the three-dimensional (3D) microstructure of the Zr/Nb nanolaminate from the texture and grain shapes. When deformed, as in rolling, the simulation predicted that these bands initiated not in the Zr/Nb interface and not in the Nb phase, but in the hcp Zr phase; they formed not immediately but only after large strains, >240%.
(a) Three-dimensional model microstructure of Zr/Nb.Reference Ardeljan, Knezevic, Nizolek, Beyerlein, Mara and Pollock77 (b) Spatial map of the normalized value of equivalent plastic strain (PEEQ) showing strain heterogeneities developing at grain boundaries and triple/quadruple junctions. Red circles indicate hot spots forming a band. Black circles indicate hot spots disappearing and not forming a band. Blue circles indicate cold spots. (c) Shear banding after softening elements experience hot spots: deformed grain structure (top) and distributions of equivalent strain normalized by the applied equivalent plastic strain (bottom) after subsequent straining of 0.2. Note: RD, rolling direction; ND, normal direction; TD, transverse direction.
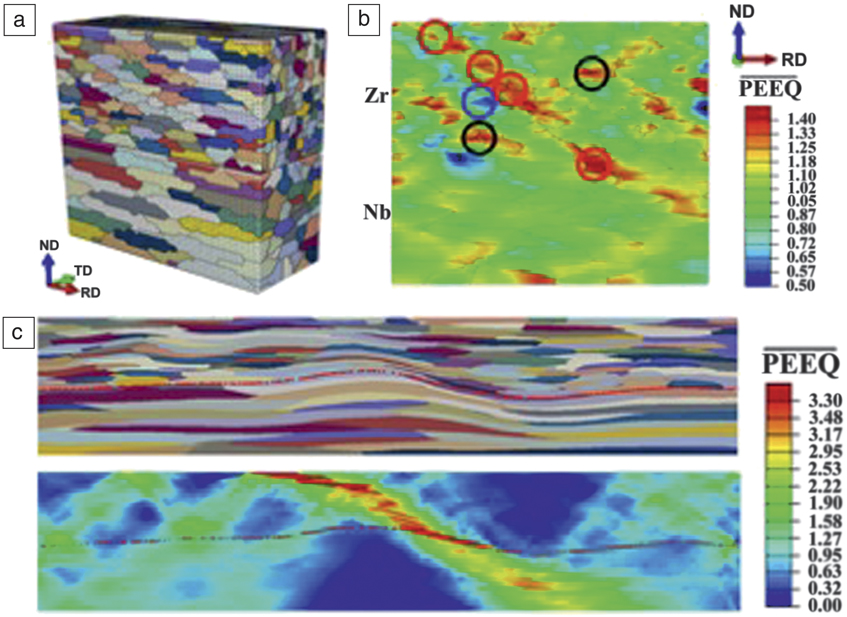
After some amount of strain within the hcp Zr phase, at particular microstructural triple junctions, highly localized stress concentrations developed (Figure 6b), which were identified as the precursors to shear banding (Figure 6c). Analysis of slip activities and orientation gradients indicated that these microstructural exceptionally high stress points corresponded to highly divergent lattice orientation rates, and resulted from anisotropic hardening in the grains. Among the grains that happened to be joined at these statistically few trouble spots, some neighbor orientations could slip by the easiest slip mode, prismatic slip, whereas the other neighbors were oriented to slip by the harder slip mode, pyramidal 〈c + a〉 slip. To reduce the deformation-enhanced plastic anisotropy, the model suggested that intermediate annealing during processing would help to reduce dislocation hardening and thwart slip-band formation.Reference Ardeljan, Knezevic, Nizolek, Beyerlein, Mara and Pollock77 This insight from modeling led to revising the processing pathway and successful refinement to nanolayer sizes. More generally, the important guidance provided is that the intermediate annealing step should be designed to reduce the plastic anisotropy of the noncubic phase without resulting in intermixing at the interface.
Nanoenabled formability in noncubic phases
In principle, the ARB process can be repeated indefinitely, and layers in bulk nanolaminates can be made much finer than 100 nm. Another study attempted to further refine the layers in the Zr/Nb nanolaminate from 100 nm to 15 nm. In doing so, they reported the intriguing finding that the ARB process could be repeated, but without the need for intermediate annealing.Reference Ardeljan, Savage, Kumar, Beyerlein and Knezevic58 The material exhibited an apparent enhanced formability that was not seen in the coarse-layered material and not typical of noncubic metals.
The unique formable-like behavior was first credited to microstructure and the expectation was that sudden formability metals resulted from nearly isotropic (uniform) texture development. However, subsequent neutron diffraction measurements of the bulk sample revealed the unexpected finding that the texture became oddly highly oriented. This deformation texture contains only two special orientations, strikingly fewer than that normally seen in conventionally rolled Zr. Another unique microstructural aspect that may have played a role is strong geometric constraint which facilitates deformation compatibility. When the layers refine to the nanoscale, only one crystal spans the layers, so every Zr grain is bonded to a Nb grain. Satisfying compatibility in this highly constrained configuration could have altered the orientation stability of many of the components usually stable in polycrystalline Zr.
In another recent study,Reference Ardeljan, Savage, Kumar, Beyerlein and Knezevic58 a crystal plasticity-based model was used to analyze the deformation stability of Zr/Nb bicrystals. It indicated that all Zr crystal orientations, when bonded to Nb crystals, are orientationally unstable in rolling, which differs greatly from Zr–Zr bonded crystals that have several stable orientations in rolling. In other words, no Zr–Nb bonded pair crystals should be stable in the rolled nanolaminate.
With the same Zr/Nb bicrystal plasticity model, it was shown that when the ratios of slip resistance among prismatic, pyramidal, and basal modes in Zr reduced substantially from conventional ratios of five to eight to ratios below two, only the two “nanostable” Zr orientations, seen in the Zr phase of the nanolaminate, were stable in rolled Zr–Nb bonded crystals. The important finding was that “nanopreferred” texture components arise when the plastic anisotropy of Zr is substantially reduced. The result was insensitive to the orientation of the Nb crystal.
The question then becomes how did the interfaces augment the anisotropy of the Zr phase? In nanoscale grains, dislocations no longer primarily originate from the grain boundaries or the interiors of the grains, but at the phase interfaces. The phase interfaces serve as nucleation sites, annihilation sites, and barriers. Due to differences in their atomic structure, it would be expected that the critical stresses for activating dislocations from phase interfaces would be different from those for forming dislocations from internal crystal defects and grain boundaries. Atomic-scale calculation would provide one means to determine whether the barriers for nucleating dislocations in the different slip modes are more similar and less anistropic. As one indication that they may be closer, DFT calculations find that a similar ratio for the ideal shear stress on these three slip systems in Zr lies below 2.5.Reference Ardeljan, Knezevic, Nizolek, Beyerlein, Mara and Pollock77
Summary and future challenges
In this article, we have discussed recent insights into the deformation mechanisms affected by noncubic/cubic interfaces when nanolaminates are strained. Insight gained were outcomes of integration of experimental and computational tools that varied over many length and time scales, from first-principles DFT, MD, continuum dislocation and defect theory, single-crystal plasticity, and polycrystalline plasticity. For instance, the effects of interfaces on macroscopic response were enabled by 3D, mesoscale CP-based modeling techniques, and some recent advancements in the ability to model the role that grains (orientation and size), grain boundaries, and interface properties play on dislocation motion. As is common in all modeling efforts, models and their capability to inform and predict could benefit from a number of extensions.
For the modeling techniques reviewed here, useful future modifications concern the ability to model the effects of microstructure on the onset (when), formation (where), and propagation of dislocations and deformation twins. The list of possible phenomena that would be affected by the selection of slip mode or twin mode is long: nucleation and growth of cracks and voids, development of localized slip bands within crystals, and shear bands across crystals. There are also a number of phenomena that would require the ability to model moving noncubic/cubic interfaces, such as phase transformations, recrystallization, grain growth, and deformation twins.
Also included in the area of mesoscale modeling advancement is the need to account for interactions between dislocations and twins with grain boundaries, interfaces, or precipitates. The number of possible defect/interface reactions that could affect microstructural evolution is long as well. While many of these aspects have been studied intensively and widely using atomic-scale simulation, representing the role of such highly resolved atomic-scale reactions in a mesoscale model is lacking. At the same time, new strategies are needed to overcome the numerical issues, such as dynamically creating and evolving boundaries in explicit microstructure mesoscale models.
Acknowledgments
I.J.B. acknowledges support from the US Department of Energy (DOE), National Nuclear Security Administration under Award No. DE-NA0003857. J.W. would like to acknowledge research sponsorship by the DOE, Office of Basic Energy Sciences under Award No. DE-SC0016808 and the Nebraska Center for Energy Sciences Research, which is a collaboration between the Nebraska Public Power District and the University of Nebraska–Lincoln.

Irene J. Beyerlein is a professor at the University of California, Santa Barbara, with a joint appointment in the Mechanical Engineering and Materials Departments. She received her PhD degree in theoretical and applied mechanics at Cornell University in 1997. She was a J.R. Oppenheimer Fellow at Los Alamos National Laboratory, where she remained on the scientific staff in the Materials Science Division and later, the Theoretical Division, until 2016. Beyerlein has published more than 250 peer-reviewed articles, five book chapters, and one book in the field of structural composites, dislocations and twinning, materials processing, and polycrystalline plasticity. She is an editor for Acta Materialia and Scripta Materialia. She is also on the editorial boards of the International Journal of Plasticity and Modelling and Simulation in Materials Science and Engineering. Beyerlein can be reached by email at beyerlein@ucsb.edu.

Jian Wang has been a professor of mechanical and materials engineering at the University of Nebraska–Lincoln since 2015. He received his PhD degree in mechanical engineering from Rensselaer Polytechnic Institute in 2006. He subsequently worked at Los Alamos National Laboratory (LANL) as a technical staff member for nine years. His research interests include quantitative exploration of the structure–properties relationships of structural and nanostructured materials using multiscale theory, modeling, and experimental methods and techniques. He was awarded the LANL Distinguished Postdoctoral Performance Award (2009), The Minerals, Metals & Materials Society MPMD Young Leader Award (2013), the International Plasticity Young Researcher Award (2015), and the Materials Today 2018 Rising Star Award. Wang can be reached by email at jianwang@unl.edu.