Introduction
Tomato is one of the most widely cultivated vegetable crops worldwide (Jiang et al., Reference Jiang, Yang, Zhang, Chen, Hu, Chen and Zhang2023). The tomato leafminer Tuta absoluta (Meyrick) (Lepidoptera: Gelechiidae), native to South America, has rapidly invaded more than 100 countries and regions, causing yield losses of 30–100% in severely infested fields (Ayalew, Reference Ayalew2015; Gharekhani et al., Reference Gharekhani, Salekebrahimi and Chi2023; Weng et al., Reference Weng, Shashank, Godfrey, Plotkin, Parker, Wist and Kawahara2024). In response, tomato growers often rely on frequent insecticide applications. However, this practice not only increases production costs and accelerates resistance evolution but also raises concerns about pesticide residues in soil and surface waters, non-target arthropod mortality, and potential risks to human health (Desneux et al., Reference Desneux, Han, Mansour, Arnó, Brévault, Campos and Biondi2022; Eissa et al., Reference Eissa, Al-Sisi and Ghanem2022; Wang et al., Reference Wang, Chang, Zhang, Jiang, Yang and Wang2022). Against this background, developing environmentally friendly and cost-effective tools for monitoring and managing T. absoluta is a key priority for sustainable tomato production.
Among physical control methods, pheromone traps and colour sticky traps are the most widely used for T. absoluta monitoring and management. Sex pheromone traps target male moths by releasing synthetic pheromones, reducing mating frequency and subsequent larval populations; however, their efficacy is limited by factors such as trap type, placement height, and pheromone release rate (Zhang et al., Reference Zhang, Li, Huang, Jiang, Zhang, Meng, Wang and Du2024; Sadique et al., Reference Sadique, Ishtiaq, Qayyum, Alkherb, Abbasi, Arshad and Rebouh2025). Colour sticky traps utilise the phototactic and colour preference of T. absoluta adults: studies have shown that blue traps (465 nm wavelength) placed horizontally at ground level exhibit the highest trapping efficiency, but their performance varies significantly under different cultivation systems (e.g. open-field vs. greenhouse) (Zhang et al., Reference Zhang, Zhang, Liu, Zhang, Xian, Wan, Feng, Zhao, Liu, Liu, Zhang, Li and Wang2021). Recent studies have attempted to combine these two technologies to improve efficacy: Xie et al. (Reference Xie, Meng, Zhao, Yang, Yao, Yang, Yang, Chen and Shen2023) found that ship-shaped traps installed at 0.8–1.2 m, combined with four specific sex pheromones, achieved optimal trapping in tomato fruiting stages.
However, three critical research gaps remain in the current literature (Raghavendra et al., Reference Raghavendra, Rekha, Ramesh, Felix and Chander2024). (1) Lack of systematic comparison of trap types: Most studies focus on single-type traps (e.g. pheromone or colour traps), but few have compared the efficacy of traps integrating multiple mechanisms (e.g. pheromone + colour) for T. absoluta. (2) Insufficient research on trap layout optimisation: Existing studies on trap placement (height, position relative to plants) are fragmented, and no consensus has been reached on the optimal layout for triangular traps (a newly developed low-cost trap type). (3) Poor understanding of performance stability: The efficacy of traps under different cultivation systems (sheltered mulch, open-field, and greenhouse) and seasons has not been systematically evaluated, limiting their practical application in diverse tomato production scenarios.
To address these gaps, we optimised a low-cost triangular pheromone trap for T. absoluta monitoring in tomato crops by (i) comparing its trapping performance and selectivity with planar traps and colour-only sticky boards; (ii) determining the optimal vertical position and diel trapping period; and (iii) evaluating performance stability across three protected cultivation systems and two consecutive growing seasons. Our overarching goal was to develop a standardised, environmentally friendly monitoring protocol that can support pesticide-reducing integrated pest management (IPM) in protected tomato production.
Materials and methods
Materials
All trapping materials were purchased from Beijing Jinyi Runnong Science and Technology Co., Ltd. Among them, there are sticky plates, planar traps, and triangular traps.
Field experiments were carried out at the Dazhai Planting Base in Yixiang Town, Pu’er City, Yunnan Province, China. The study site experiences a subtropical monsoon climate, characterised by a mean annual temperature of 18.9 ℃ and mean annual precipitation of 1560 mm. During the 2023 experimental period, the air temperature inside the greenhouses ranged from 20 ℃ to 32 ℃, while relative humidity fluctuated between 65% and 90%. To prevent interference with trap efficacy, no insecticides targeting T. absoluta were applied within the experimental plots throughout the trapping period.
Tomato seedlings were transplanted at the end of April 2023. Sampling commenced 20 days after transplantation and continued throughout the entire growing season. The experiment included the following items: sticky plates, T. absoluta pheromone lures, planar traps, colour sticky boards, and triangular traps.
Optimisation of trap configuration and layout
Trapping efficacy of different trap types and colour combinations
The field was divided into nine experimental plots, separated by four ridges to avoid cross-interference. A randomised complete block design (RCBD) was adopted, with three replicates per trap configuration. Tested configurations included the following:
Triangular traps (with lure) in blue, yellow, and white;
Planar traps (with lure) in blue, yellow, and white;
Colour sticky boards (without lure) in blue, yellow, and white.
During each sampling event, traps were replaced every 24 h, and the experiment was repeated at 10-day intervals throughout the tomato growing season (total six times) to ensure temporal representativeness. The number of trapped T. absoluta adults per trap was recorded.
Effect of installation position on trapping efficacy
Three vertical installation positions on tomato plants were tested: basal position, mid-canopy position, and apical position. The experiment adopted RCBD with three replicates per position. Traps were operated in 24 h cycles. Sampling was conducted every 10 days for five consecutive cycles (Tan et al., Reference Tan, Fu, Jia, Li, Ding, Tursun, Feng and Guo2022).
Effect of trapping time window on efficacy
The experiment adopted RCBD with three replicates per position. Traps were used to test four time windows: morning, noon, afternoon, and night. Traps not replaced during the test period, only the number of trapped T. absoluta adults was recorded at the end of each time window (Qiao et al., Reference Qiao, Zhang, Ban, Ni, Han and Tan2023).
Stability evaluation of triangular traps
Trapping performance under different cultivation systems
Three facility cultivation systems were evaluated: mulching of the whole greenhouse, whole-house mulch-free cultivation, and sheltered mulch cultivation. Each cultivation system had three replicate greenhouses. For each system, trapping efficacy was assessed using three-colour triangular traps (basal position, 20:00–08:00 time window) that were placed in each greenhouse (experiment adopted RCBD with nine replicates per position). Traps were replaced every 24 h, and the number of trapped T. absoluta was recorded every 10 days (Yang et al., Reference Yang, Dou, Li, Li, Jiang, Chen and Zhang2022).
Phenological period of T. absoluta under different cultivation systems
The phenological stages (egg, larva, and adult) of T. absoluta were divided into early, peak, and late periods using quartile analysis of population proportion data:
Early period: Cumulative population proportion <25% (1st quartile);
Peak period: Cumulative population proportion 25–75% (2nd + 3rd quartiles);
Late period: Cumulative population proportion ≥75% (4th quartile).
The ‘population peak day’ was defined as the date when the cumulative population reached 50% of the total seasonal population (Zhang et al., Reference Zhang, Yang, Wan and Lövei2014). Population surveys were conducted every 5 days (three replicates per cultivation system) to collect phenological data.
Trapping performance across planting seasons
Experiments were conducted in two consecutive growing seasons:
Summer–autumn 2023 (June–October);
Autumn–winter 2023/2024 (November 2023–March 2024).
Based on local cultivation surveys, sheltered mulch cultivation was the most widely adopted system; thus, only this system was tested across seasons. Three-colour triangular traps (basal position, 20:00–08:00 time window) were used, with three replicates per season (each replicate = one greenhouse). Sampling was conducted every 10 days, and mean catch per trap was calculated for each season.
Data processing and statistical analysis
All data were analysed using SPSS 27.0 (IBM Corp., USA) and plotted with Origin 2024 (OriginLab, USA). Specific statistical methods were matched to experimental objectives as follows:
Trap type/colour and installation position efficacy: Single-factor analysis of variance (ANOVA) with least significant difference (LSD) post hoc test (P < 0.05) was used to compare significant differences in mean catch among treatments.
Trapping time window: Repeated-measures ANOVA (P < 0.05) was used to account for temporal autocorrelation in data.
Phenological period division: Quartile analysis (Q1 = 25%, Q2 = 50%, Q3 = 75%) was used to classify population stages, with descriptive statistics (mean ± standard error, SE) for peak day calculation.
Trapping effect indices were calculated using the following formulas:
 ${\text{Mean catch per trap:}}\frac{{{\text{ Total number of trapped adults }}}}{{{\text{ Number of traps}} \times {\text{ Sampling cycles }}}}$
 ${\text{Attractance ratio}}\left( {\text{\%}}\right){\text{:}}\frac{{{\text{ Mean catch of treatment }}}}{{\sum\text{ Mean catch of all treatments}}} \times 1 $
Results and analysis
Optimisation of triangular trap configuration for T. absoluta trapping
Effects of trap type and colour on trapping performance
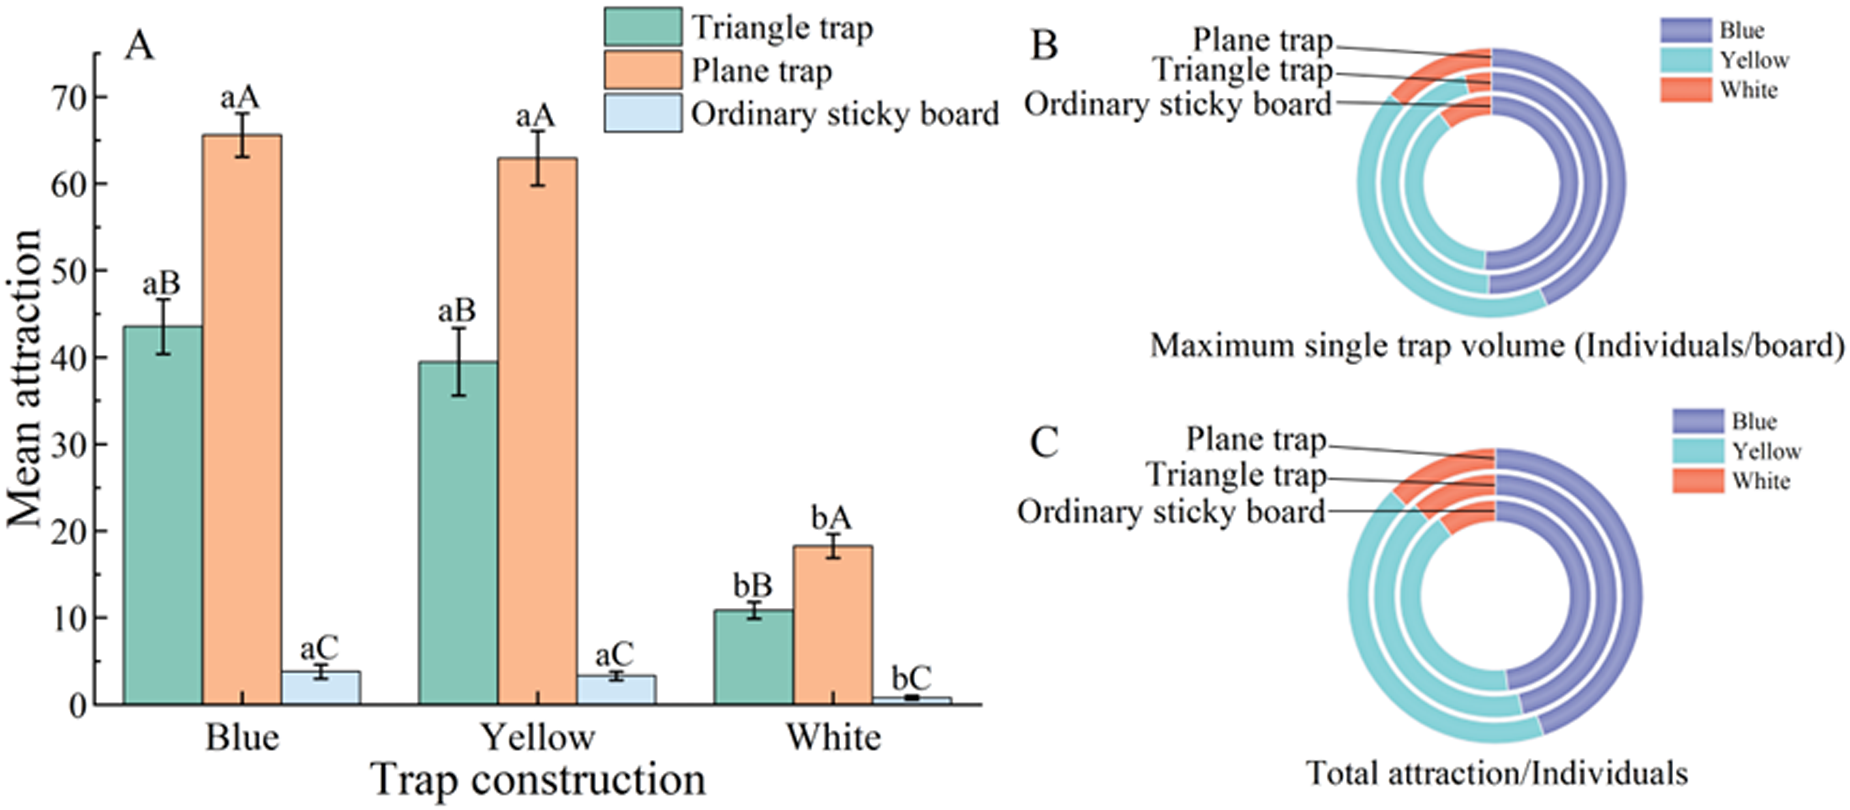
The triangular trap demonstrated superior performance for precision monitoring compared to the other two trap types. Although planar traps achieved the highest total capture (328.00 adults), triangular traps (217.67 adults) exhibited significantly lower bycatch of non-target insects (e.g. Aphis gossypii and Bemisia tabaci), thereby providing a more accurate reflection of field T. absoluta population dynamics. Statistical modelling confirmed that trap type was a critical determinant of capture efficiency (F₂,₄₅ = 327.9, P < 0.05). Consequently, the triangular trap is recommended as a more reliable tool for IPM programmes requiring precise pest surveillance due to its high specificity.
Blue traps consistently outperformed yellow and white variants across all designs, with a clear hierarchy of attraction: blue > yellow > white (F₂,₁₄ = 36.70, P < 0.01). For instance, in triangular traps, blue accounted for 46.40% of total captures, exceeding yellow and white catches by 1.1-fold and 4-fold, respectively (fig. 1). These results indicate a strong spectral preference of T. absoluta adults for blue wavelengths, establishing colour selection as a simple yet effective leverage point for optimising monitoring efficacy.
Trapping efficiency of different trap configurations for T. absoluta adults. (A) The average capture volume of different traps; (B) the maximum catch of various traps; (C) the distribution of different colours in the trap. Different lowercase letters indicate significant differences in catch among colours for the same trap type; different uppercase letters indicate significant differences in catch among trap types for the same colour (LSD test, P < 0.05). Data are presented as mean ± SE, n = 3 replicates.

Figure 1 Long description
A) The grouped bar chart shows mean attraction on the vertical axis from 0 to 70. The horizontal axis lists trap construction types: Blue, Yellow and White. The legend identifies Triangle trap, Plane trap and Ordinary sticky board. Blue: Triangle trap approximately 40, Plane trap approximately 65, Ordinary sticky board approximately 35. Yellow: Triangle trap approximately 35, Plane trap approximately 62, Ordinary sticky board approximately 30. White: Triangle trap approximately 12, Plane trap approximately 22, Ordinary sticky board approximately 2. Letter annotations indicate statistical differences. B) The ring chart titled 'Maximum single trap volume (Individuals/board)' compares trap types and colors. Plane trap has the largest segment, followed by Triangle trap and Ordinary sticky board. C) The ring chart titled 'Total attraction/Individuals' shows similar proportions, with Plane trap leading, followed by Triangle trap and Ordinary sticky board. Both ring charts use a legend for Blue, Yellow and White colors. The charts collectively illustrate that Plane traps generally have higher attraction and capture volumes across colors, with Blue being the most effective color overall.
Effects of position and time window on triangular trap efficacy
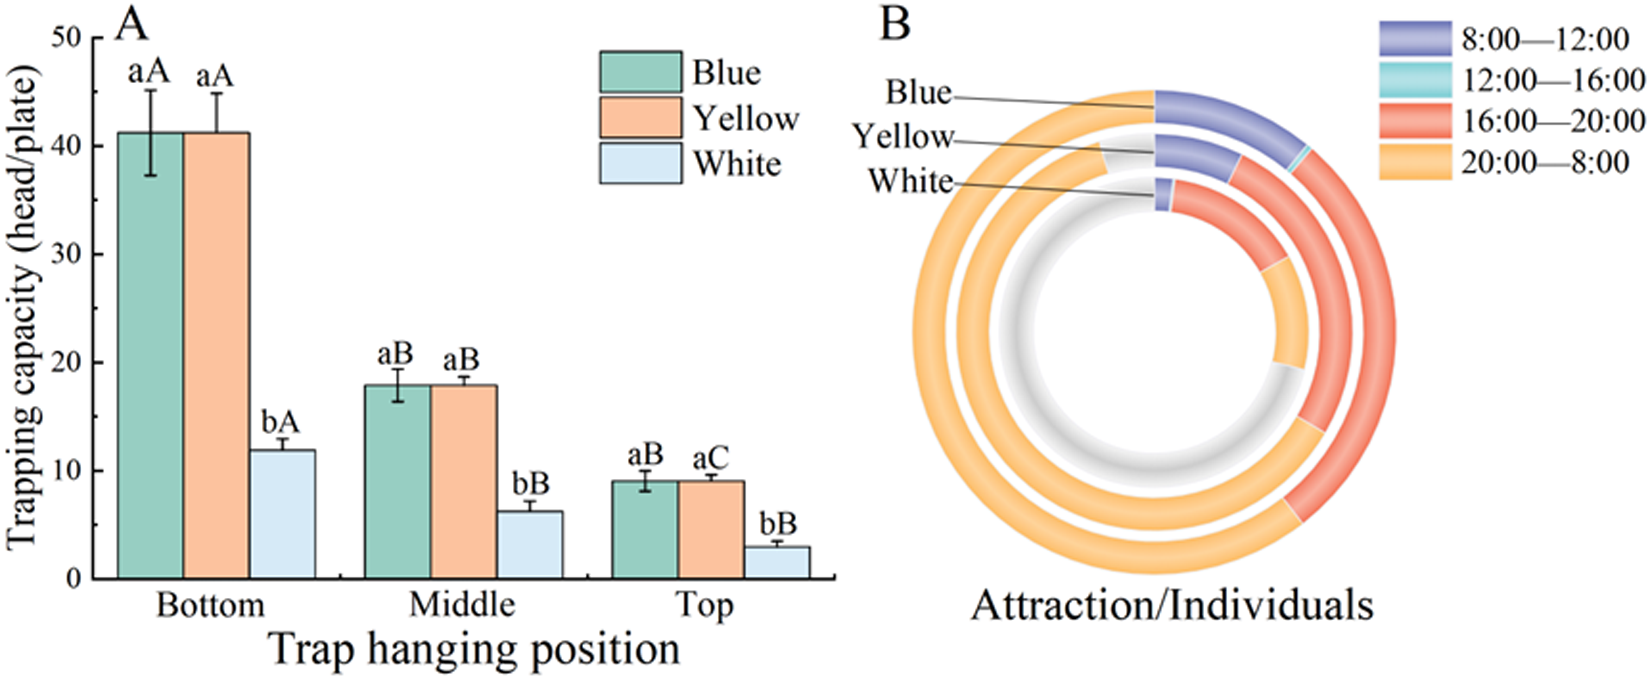
Trap deployment position exerted a dominant influence on capture rates, with basal placement yielding consistently superior results across all colours. Blue triangular traps positioned at the plant base captured a mean of 41.12 adults/trap, significantly outperforming mid-canopy and apical placements by 2.3-fold and 4.5-fold, respectively (F₂,₁₄ = 44.34, P < 0.05). This clear vertical stratification in trapping efficacy underscores that positioning traps near the plant base is critical for maximising detection sensitivity in field monitoring programmes.
The diel activity pattern of T. absoluta was strongly nocturnal, with over 60% of adults captured during the night-time window (20:00–08:00). Catches during this period significantly exceeded those in all daytime intervals combined (F₃,₁₉ = 55.75, P < 0.05), while the noon window (12:00–16:00) proved particularly ineffective, with catches approaching zero (fig. 2). This pronounced temporal specialisation confirms that monitoring efforts should be preferentially evaluated based on night-time catches to accurately assess pest pressure and timing control interventions.
Trapping efficiency of triangular traps at different positions and time windows on tomato plants. (A) The influence of trapping positions in different traps on the trapping quantity; (B) the influence of trapping time in different traps on the trapping quantity. Bottom: 10 cm above ground; Middle: 5th–6th functional leaf height; Top: 10 cm below terminal bud. Error bars represent mean ± SE, n = 3 replicates. Different lowercase letters indicate significant differences among colours at the same position; different uppercase letters indicate significant differences among positions for the same colour (LSD test, P < 0.05).

Figure 2 Long description
A) The bar chart titled A. The horizontal axis label is Trap hanging position. The categories are Bottom, Middle, Top. The vertical axis label is Trapping quantity (adult/plant). The vertical axis range is 0 to 50. Three bar groups are shown with a legend listing Blue, Yellow, White. Bottom: Blue bar is 44 with error bars; Yellow bar is 44 with error bars; White bar is 12 with error bars. Middle: Blue bar is 18 with error bars; Yellow bar is 18 with error bars; White bar is 8 with error bars. Top: Blue bar is 10 with error bars; Yellow bar is 10 with error bars; White bar is 2 with error bars. Letter annotations above bars: Bottom Blue has aA; Bottom Yellow has aA; Bottom White has bA. Middle Blue has aB; Middle Yellow has aB; Middle White has bB. Top Blue has aC; Top Yellow has aC; Top White has bC. B) The circular chart titled B. The chart label text reads Attraction/Individuals. A legend lists Blue, Yellow, White. A second legend lists time windows: 8:00 to 12:00, 12:00 to 16:00, 16:00 to 20:00, 20:00 to 8:00. Three concentric rings are shown, corresponding to Blue, Yellow, White. Each ring is divided into four arc segments corresponding to the four time windows.
Stability of triangular traps under different cultivation systems
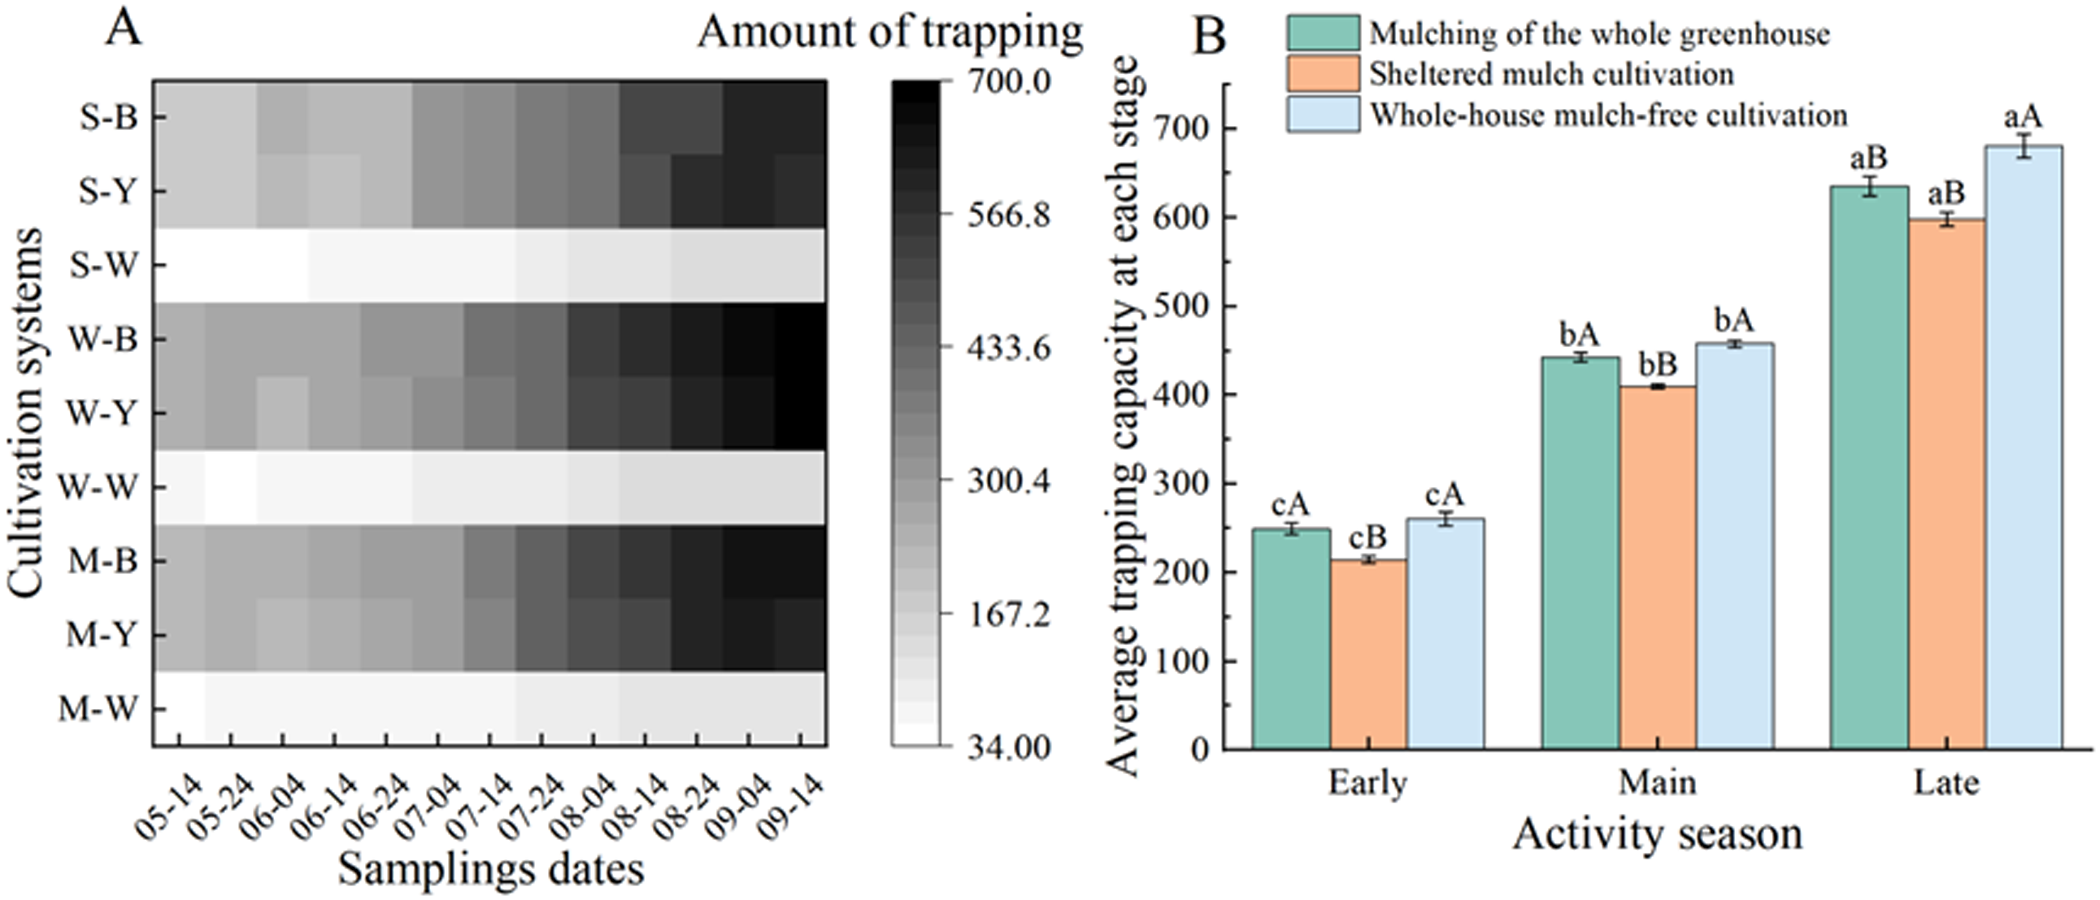
The strong colour preference of T. absoluta for blue and yellow over white remained remarkably stable across three distinct protected cultivation systems. In sheltered mulch cultivation, for instance, blue traps accounted for 52.3% of the total catch, outperforming white traps by nearly 9-fold, a pattern that was statistically significant across all systems (e.g. sheltered mulch cultivation: F₂,₈ = 1260, P < 0.05). This consistent visual attraction confirms that the colour-based trapping mechanism is robust and reliable, enabling the deployment of a standardised monitoring protocol in diverse tomato production environments.
Blue triangular traps maintained a high and stable trapping efficacy across different pest occurrence periods within each cultivation system, despite significant fluctuations in population density over time (F₂,₈ = 587.88, P < 0.01). Although some variation was observed among cultivation systems in the early season (F₂,₈ = 14.44, P < 0.01), the performance of the blue traps remained at a consistently high level throughout (fig. 3). This temporal and cross-system reliability underscores the practical value of this trap configuration for providing comparable and trustworthy population data across an entire growing season, which is fundamental for implementing effective, season-long IPM strategies.
Temporal dynamics of triangular trap efficiency under different cultivation systems. (A) Trapping quantity of the triangular trap at different times; (B) trapping efficiency of blue triangular traps across T. absoluta occurrence stages under different cultivation systems. S-B, S-Y, S-W: Sheltered mulch cultivation – blue, yellow, white traps; W-B, W-Y, W-W: whole-house mulch-free cultivation – blue, yellow, white traps; M-B, M-Y, M-W: mulching of the whole greenhouse – blue, yellow, white traps. Different lowercase letters indicate significant differences between different occurrence periods under the same cultivation mode, while different uppercase letters represent significant differences in the same occurrence period among different cultivation modes (LSD test, P < 0.05). Error bars represent mean ± SE, n = 3 replicates.

Figure 3 Long description
The image A showing a heatmap titled Amount of trapping. The vertical axis label is Cultivation systems. The horizontal axis label is Sampling dates. The cultivation system row labels are S dash B, S dash Y, S dash W, W dash B, W dash Y, W dash W, M dash B, M dash Y, M dash W. The sampling date labels run from 05 dash 14 through 04 dash 19. A scale bar is labeled 34.00, 167.2, 300.4, 433.6, 566.8, 700.0. Darker shading corresponds to higher values on this scale and lighter shading corresponds to lower values on this scale. Across all nine rows, shading is lighter at earlier sampling dates and becomes darker toward later sampling dates. The darkest shading appears at the latest sampling dates for multiple cultivation systems, aligning with the upper end of the scale near 700.0. The lightest shading appears at the earliest sampling dates for multiple cultivation systems, aligning with the lower end of the scale near 34.00. The image B showing a grouped bar chart. The vertical axis label is Average trapping capacity and the unit is aea. The vertical axis range is 0 to 700. The horizontal axis label is Activity season. The horizontal axis categories are Early, Main, Late. The legend entries are Mulching of the whole greenhouse, Sheltered mulch cultivation, Whole dash house mulch dash free cultivation. Each bar has an error bar and a letter label above it. Early: Mulching of the whole greenhouse 270.0 with cA; Sheltered mulch cultivation 220.0 with cB; Whole dash house mulch dash free cultivation 280.0 with cA. Main: Mulching of the whole greenhouse 450.0 with bA; Sheltered mulch cultivation 420.0 with bB; Whole dash house mulch dash free cultivation 470.0 with bA. Late: Mulching of the whole greenhouse 620.0 with aB; Sheltered mulch cultivation 600.0 with aB; Whole dash house mulch dash free cultivation 660.0 with aA. Both images present trapping results by cultivation grouping. The heatmap shows changes across sampling dates within each cultivation system and the bar chart shows average trapping capacity grouped by activity season for the three cultivation categories.
Seasonal stability of triangular trap performance
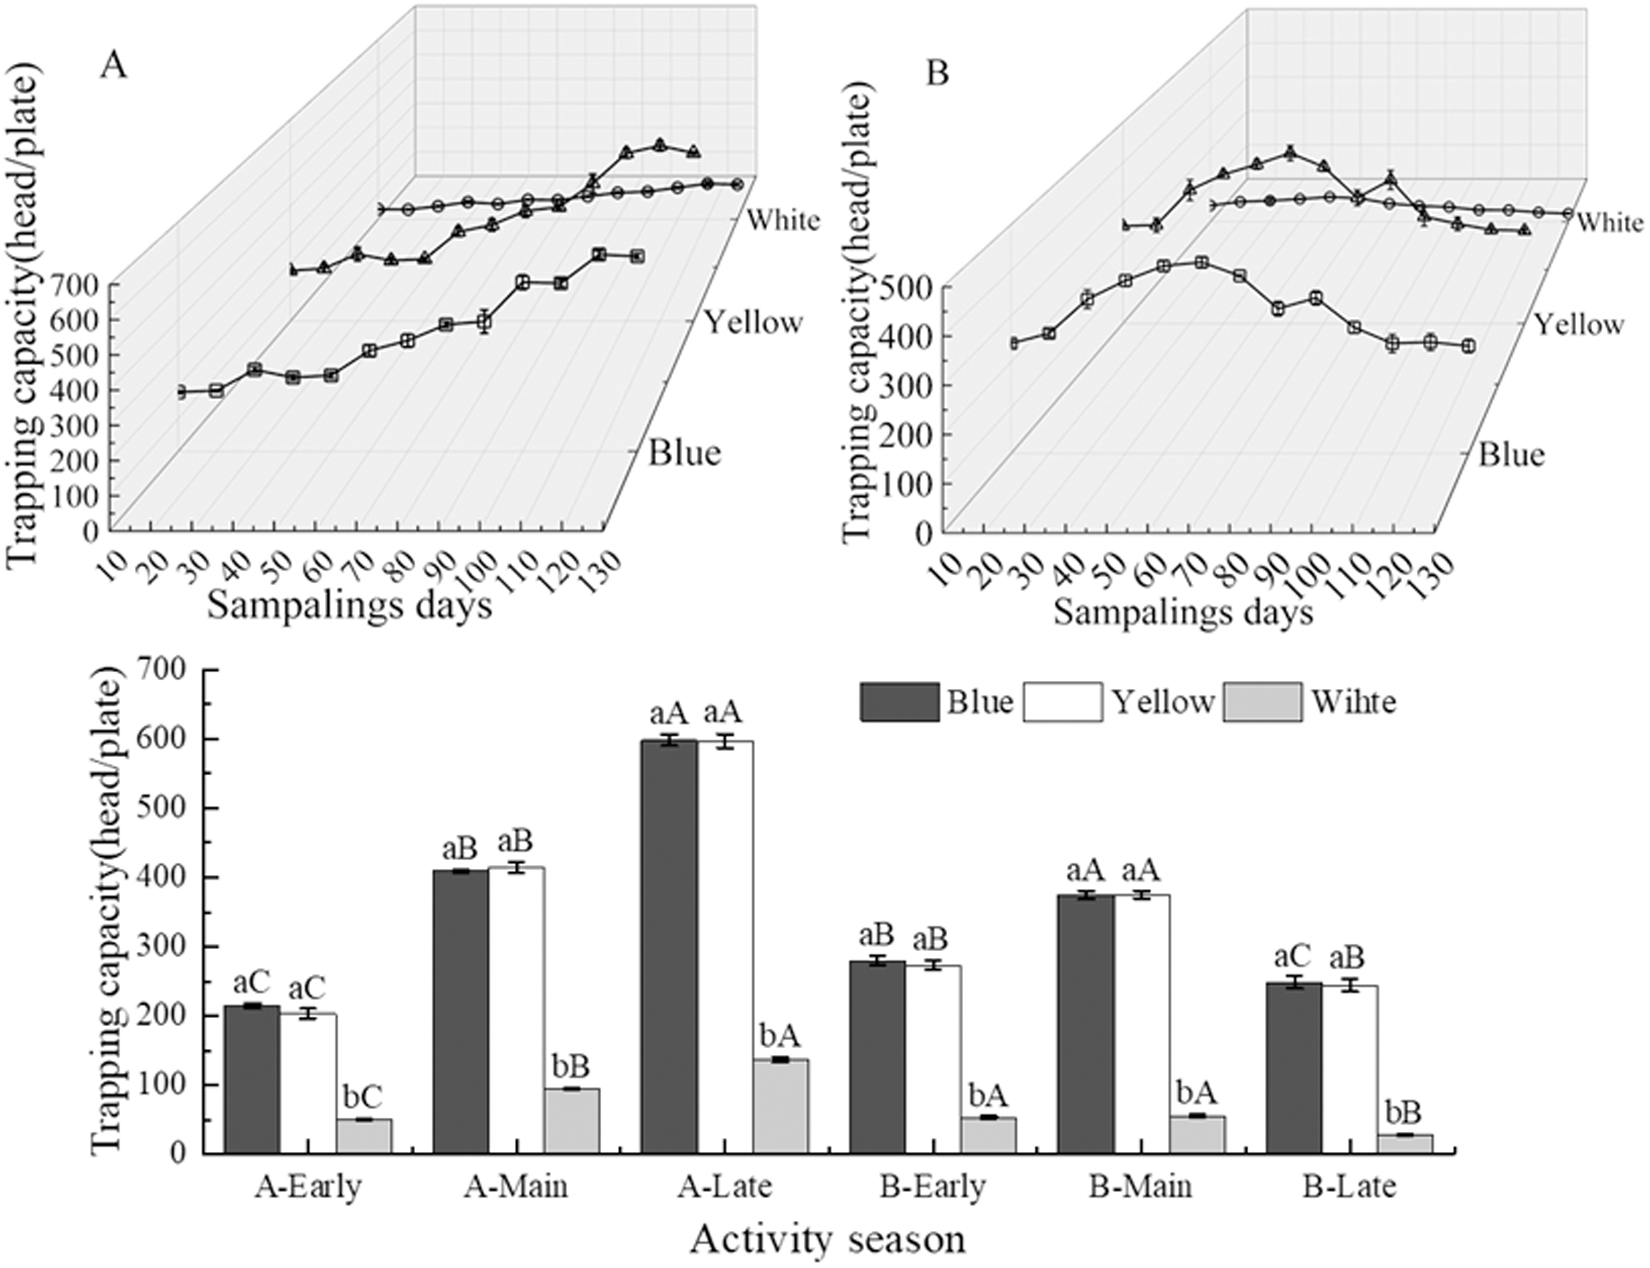
The optimised blue triangular trap configuration demonstrated remarkable temporal stability, maintaining high monitoring efficiency across two consecutive growing seasons with contrasting climatic conditions. Throughout both the summer–autumn and autumn–winter cycles, blue and yellow traps consistently and significantly outperformed white traps (e.g. early autumn–winter stage: blue 279.9 adults/trap vs. white 53.56 adults/trap, a greater than 5-fold difference; F₂,₈ = 581.255, P < 0.001). This consistent performance confirms that the trapping system provides a reliable and comparable metric of pest population density, enabling robust, long-term trend analysis and management evaluation for T. absoluta across different years and seasons.
The trapping efficacy of each colour variant successfully tracked predictable fluctuations in pest population density within each season. Catches varied significantly across the early, peak, and late occurrence stages, with the blue trap capture in the autumn–winter season, for instance, peaking at 374.8 adults/trap and then declining (F₂,₈ = 82.80, P < 0.001) (fig. 4). This ability to accurately reflect intra-seasonal population dynamics underscores the trap’s high sensitivity and confirms its practical utility not only for detecting pest presence but also for timing interventions according to the specific pest pressure within a growing season.
Seasonal performance of triangular traps for T. absoluta monitoring. (A) Summer–autumn 2023; (B) autumn–winter 2023/2024. Error bars represent mean ± SE, n = 3 replicates. Different lowercase letters indicate significant differences among colours at the same stage; different uppercase letters indicate significant differences among stages for the same colour (LSD test, P < 0.05).

Figure 4 Long description
The image A showing a line graph with the vertical axis labeled Trapping capacity (head/plate) and tick labels 0, 100, 200, 300, 400, 500, 600, 700. The horizontal axis is labeled Sampling days and shows tick labels 1, 2, 3, 4, 5, 6, 7, 8, 9, 10, 11, 12, 13, 14, 15, 16, 17, 18, 19, 20. Three lines are labeled White, Yellow and Blue. White line values by sampling day: 1 about 500, 2 about 520, 3 about 540, 4 about 560, 5 about 580, 6 about 600, 7 about 610, 8 about 620, 9 about 630, 10 about 640, 11 about 650, 12 about 660, 13 about 670, 14 about 680, 15 about 690, 16 about 700, 17 about 700, 18 about 700, 19 about 700, 20 about 700. Yellow line values by sampling day: 1 about 300, 2 about 310, 3 about 320, 4 about 330, 5 about 340, 6 about 350, 7 about 360, 8 about 380, 9 about 400, 10 about 420, 11 about 440, 12 about 460, 13 about 480, 14 about 500, 15 about 520, 16 about 540, 17 about 560, 18 about 580, 19 about 600, 20 about 620. Blue line values by sampling day: 1 about 300, 2 about 300, 3 about 310, 4 about 320, 5 about 330, 6 about 340, 7 about 350, 8 about 360, 9 about 370, 10 about 380, 11 about 390, 12 about 400, 13 about 410, 14 about 420, 15 about 430, 16 about 440, 17 about 450, 18 about 460, 19 about 470, 20 about 480. The image B showing a line graph with the vertical axis labeled Trapping capacity (head/plate) and tick labels 0, 100, 200, 300, 400, 500, 600, 700. The horizontal axis is labeled Sampling days and shows tick labels 1, 2, 3, 4, 5, 6, 7, 8, 9, 10, 11, 12, 13, 14, 15, 16, 17, 18, 19, 20. Three lines are labeled White, Yellow and Blue. White line values by sampling day: 1 about 450, 2 about 470, 3 about 490, 4 about 510, 5 about 530, 6 about 550, 7 about 560, 8 about 570, 9 about 580, 10 about 590, 11 about 580, 12 about 570, 13 about 560, 14 about 550, 15 about 540, 16 about 530, 17 about 520, 18 about 510, 19 about 500, 20 about 490. Yellow line values by sampling day: 1 about 350, 2 about 370, 3 about 390, 4 about 410, 5 about 430, 6 about 450, 7 about 460, 8 about 470, 9 about 480, 10 about 490, 11 about 480, 12 about 470, 13 about 460, 14 about 450, 15 about 440, 16 about 430, 17 about 420, 18 about 410, 19 about 400, 20 about 390. Blue line values by sampling day: 1 about 350, 2 about 360, 3 about 370, 4 about 380, 5 about 390, 6 about 400, 7 about 410, 8 about 420, 9 about 430, 10 about 440, 11 about 430, 12 about 420, 13 about 410, 14 about 400, 15 about 390, 16 about 380, 17 about 370, 18 about 360, 19 about 350, 20 about 340. A grouped bar chart showing Trapping capacity (head/plate) on the vertical axis with tick labels 0, 100, 200, 300, 400, 500, 600, 700. The horizontal axis is labeled Activity season and shows categories A-Early, A-Main, A-Late, B-Early, B-Main, B-Late. A legend shows Blue, Yellow, White. A-Early bars: Blue about 200 with label aC, Yellow about 250 with label aC, White about 100 with label bC. A-Main bars: Blue about 400 with label aB, Yellow about 420 with label aB, White about 100 with label bB. A-Late bars: Blue about 600 with label aA, Yellow about 620 with label aA, White about 100 with label bB. B-Early bars: Blue about 150 with label bA, Yellow about 250 with label aB, White about 260 with label aB. B-Main bars: Blue about 100 with label bA, Yellow about 400 with label aA, White about 410 with label aA. B-Late bars: Blue about 50 with label bB, Yellow about 250 with label aC, White about 260 with label aB.
Discussion
Optimisation of triangular trap configuration and deployment parameters addresses critical gaps in T. absoluta monitoring, providing a robust foundation for IPM (Zheng et al., Reference Zheng, Liu, Zhang, Liu, Ju, Shi and Zhou2023). This study focused on optimising the layout of triangular traps to enhance their stability and efficacy in T. absoluta monitoring, with a specific aim to address three key research gaps identified earlier: the lack of systematic comparisons of trap types integrating visual and chemical cues, insufficient data on optimal deployment parameters for triangular traps, and poor understanding of trap performance across diverse cultivation systems and seasons.
Synergistic effects of visual and chemical cues
Pheromone-baited blue and yellow triangular traps outperformed white traps and non-baited sticky boards is consistent with Wang et al. (Reference Wang, Feng, Wang, Wang, Pu, Song and Pu2020), who reported that pheromone lures increased T. absoluta catch by 2.3–3.1 times – this synergy between chemical cues (sex pheromones) and visual cues (trap colour, structure) is attributed to enhanced targeting of male moths during mating flights (Silva et al., Reference Silva, Das Neves, da Costa, de Oliveira, da Costa Viana, Brito and Costa Neta2024). Notably, discrepancies in colour preference were observed across studies: Kadel et al. (Reference Kadel, Sah, Devkota, Colavito, Norton, Rajotte and Muniappan2018) found white traps most effective in high-altitude Nepalese tomato fields, whereas our study (Yunnan, subtropical climate) and Zhang et al. (Reference Zhang, Zhang, Liu, Zhang, Xian, Wan, Feng, Zhao, Liu, Liu, Zhang, Li and Wang2021) (eastern China) identified blue as optimal. This inconsistency likely stems from environmental adaptability of T. absoluta: in high-altitude regions with strong ultraviolet (UV) radiation, white traps reflect more UV light (a wavelength range the pest is sensitive to), while in subtropical regions, blue traps (465 nm wavelength) better match its visual sensitivity under moderate UV conditions (Ong and Høye, Reference Ong and Høye2025). Grupe and Meyhöfer (Reference Grupe and Meyhöfer2024) further confirmed that blue traps amplify pheromone efficacy by increasing visual attractiveness, which supports our finding that blue triangular traps (integrating pheromone and colour) achieved the highest catch.
Behavioural traits underlying optimal placement and timing
Regarding deployment parameters, the basal position’s superiority aligns with Li et al. (Reference Li, Sheng, Li, Wu, Huang, Zhao, Wang, Sheng and Wang2024), who reported ground-level blue traps captured 1.49–2.49 times more T. absoluta than traps placed 30–65 cm above ground. This can be explained by the pest’s behavioural traits: adult moths rest on lower plant parts during the day to avoid high temperatures and crawl upward to mate or oviposit at night, making basal traps effective at intercepting their movement (Zhang et al., Reference Zhang, Ma, Liu, Wang, Fu, Wang, Gao and Wan2019; Aceves-Aparicio et al., Reference Aceves-Aparicio, Narendra, McLean, Lowe, Christian, Wolff and Herberstein2022). In contrast, Xie et al. (Reference Xie, Meng, Zhao, Yang, Yao, Yang, Yang, Chen and Shen2023) recommended an installation height of 0.8–1.2 m for ship-shaped sticky traps; this difference in optimal height is likely driven by trap structural design. Specifically, ship-shaped traps rely on upward-facing sticky surfaces, whereas triangular traps, with their multi-directional vertical sticky surfaces, can more effectively intercept insects crawling or flying short distances within dense basal vegetation. Taken together, the concentration of adult activity near the lower canopy and the vertical, multi-directional adhesive surfaces of the triangular trap likely explain why this trap performed best when positioned near the plant base, particularly during the night period when adult activity was greatest. Accordingly, triangular traps are more suitable for placement at the base of the plant canopy. For the time window, the peak night-time catch is consistent with T. absoluta’s nocturnal activity: Zhang et al. (Reference Zhang, Ma, Liu, Wang, Fu, Wang, Gao and Wan2019) documented adult mating flights initiating at dusk (18:00–20:00) and continuing until dawn, and even when normalised by time, Hermans et al. (Reference Hermans, Litovska, de Pastors, Visser and Spoelstra2024) noted night-time hourly catch was 3.2 times higher than daytime. The near-zero noon catch, meanwhile, is attributed to high temperatures (≥30 ℃) inhibiting adult activity – a common trait in Lepidopteran pests (Wang et al., Reference Wang, Gao, Ma, Liu, Zhai, Chen, Zheng and Yu2018).
Robustness across cultivation systems and seasons
The stability of triangular traps across cultivation systems and seasons is a key advantage for practical application, as environmental fluctuations often reduce trap efficacy (Wang et al., Reference Wang, Chang, Zhang, Jiang, Yang and Wang2022). In our study, even with microclimate differences between fully enclosed and semi-open systems, the relative catch efficiency of blue vs. yellow vs. white traps remained unchanged – this resilience is likely due to consistent visual (colour) and chemical cues that are not disrupted by cultivation-induced environmental variations. Similar results were reported by Shi et al. (Reference Shi, Sun, Han and Yu2023), who found yeast traps for Bactrocera dorsalis maintained efficacy across orchard types, as attractant traits (metabolites, colour) are resilient to external changes. Seasonal stability, meanwhile, indicates triangular traps adapt to temperature ranges (15–30 ℃) typical of tomato growing seasons in southern China, further supporting their regional applicability.
Implications for pesticide use and environmental sustainability
From an environmental sciences perspective, optimising trap-based monitoring has direct implications for pesticide use and associated risks. In many tomato-growing regions, T. absoluta infestations trigger calendar-based insecticide sprays, sometimes exceeding six to eight applications per season (Mali et al., Reference Mali, Shah, Raghunandan, Prajapati, Patel, Trivedi and Subramanian2023). By providing reliable, season-long monitoring signals, the optimised triangular traps developed in this study can underpin threshold-based decisions and help avoid unnecessary treatments. Although this study did not directly quantify pesticide reductions, our findings indicate that growers could concentrate insecticide applications at periods of high trap catches, reducing overall pesticide inputs, off-site transport to soil and water bodies, and impacts on non-target arthropods. In addition, the traps are low-cost, require no external power and generate minimal waste, making them particularly suitable for smallholder farming systems in developing regions.
Conclusions
This study provides a comprehensive optimisation and stability evaluation of triangular pheromone traps for Tuta absoluta monitoring in protected tomato cultivation. We show that pheromone-baited blue triangular traps deployed 10 cm above ground and operated from 20:00 to 08:00 achieve high and stable trapping efficiency across contrasting cultivation systems and growing seasons. Compared with planar traps and colour-only sticky boards, this configuration offers a better balance between target catch and non-target interception and is inexpensive and easy to deploy. The standardised protocol proposed here can be readily integrated into tomato IPM programmes to support more precise and potentially less frequent insecticide applications. Future work should validate pesticide reductions and non-target impacts in real-world IPM programmes and evaluate the applicability of this monitoring strategy in other climatic regions and cropping systems.
Acknowledgements
We thank Mr. Shunwen Zhou (Yunnan Agricultural University) for helping us collect the T. absoluta populations in the field. We would like to thank Mr. Bo Zhang for the discussions. This research work was supported by the National Key Research and Development Program (2024YFC2607600), Reserve Talents of Young and Middle-aged Academic and Technological Leaders in Yunnan Province (202105AC160071), and the Yunnan Xingdian Talent Support Program (YNWRQNBJ2020291).
Author contributions
Conceptualisation: HC, JLZ, GHC, XMZ; Methodology: HC, JLZ, WJH, XJW, GHC, XMZ; Investigation: YS, JHZ, XYC, ZXW, JHZ; Visualisation: HC, JLZ, XMZ; Supervision: JLZ, XMZ; Writing – original draft: HC, XMZ; Writing – review & editing: HC, JLZ, XMZ.
Competing interests
All other authors declare they have no competing interests.
Data and materials availability
All data are available in the main text.