


INTRODUCTION
Conservation agriculture (CA) is defined by three principles: minimum soil disturbance, permanent organic mulch covering the soil and diversified crop rotations and associations (Food and Agriculture Organization (FAO), 2010a; Hobbs, Reference Hobbs2007; Reicosky, Reference Reicosky and Goddard2008). Mulch plays an important role in CA benefits. In particular, soil cover acts on (i) weeds control, (ii) erosion control and (iii) improvement of crop–water balance. Weed control, besides allelopathic effects, results from physical effects of mulch on temperature, light extinction and physical obstruction of weed seedling emergence (Bilalis et al., Reference Bilalis, Sidiras, Economou and Vakali2003; Teasdale and Mohler, Reference Teasdale and Mohler1993, Reference Teasdale and Mohler2000). The percentage of ground cover has more direct influence than the quantity of biomass on weed emergence (Teasdale and Mohler, Reference Teasdale and Mohler2000), on erosion control (Smets et al., Reference Smets, Poesen and Knapen2008) and on improvements in the crop–water balance (Scopel et al., Reference Scopel, Silva, Corbeels, Affholder and Maraux2004). By contrast, other benefits of mulch, such as contributions to increase soil carbon contents (Neto et al., Reference Neto, Scopel, Corbeels, Cardoso, Douzet, Feller, Piccolo, Cerri and Bernoux2010) or provision of nitrogen for subsequent crop growth (Maltas et al., Reference Maltas, Corbeels, Scopel, Wery and da Silva2009), are directly proportional to the amount of mulch and its content of each element.
In the Lake Alaotra region of Madagascar, farmers face different constraints in different fields within their farming systems. In upland fields, soil's organic matter stocks are declining because of reduced fallow time. On these types of fields, dry spells can have a strong impact on crops’ yields. In most of paddy fields, rice transplanting is delayed and because of poor water control, weeds threaten rice yield. The average rice yield for conventional fields is around 1 t ha−1 for upland rice and 2.5 t ha−1 in paddy fields with poor water control (Penot et al., Reference Penot, Scopel, Domas and Naudin2010).
As part of a long-term research and development programme exploring options for enhancing the productivity and sustainability of farming systems in Madagascar, considerable emphasis has been devoted to identify suitable CA systems (Husson et al., Reference Husson, Charpentier, Raharison, Razanamparany, Moussa, Rasolomanjaka, Michellon, Naudin, Rakotoarinivo, Rakotondramanana, Enjalric and Séguy2010). In the Lake Alaotra region, in 2009, 1420 farmers have implemented CA cropping systems on a total of 1000 ha, i.e. on average 0.7 ha per adopting farmer (Rakotondramanana et al., Reference Rakotondramanana, Enjalric and Husson2010). Extension agents regularly monitor grain production, but biomass production is measured neither in terms of quantity nor in terms of soil cover.
Various authors have stressed on the lack of biomass for use as mulch in smallholder farming systems in Africa (Erenstein, Reference Erenstein2003; Giller et al., Reference Giller, Witter, Corbeels and Tittonell2009; Wezel and Rath, Reference Wezel and Rath2002). First it is difficult to produce enough biomass without external inputs, and second, once biomass is produced, it is difficult to retain it as mulch because of competing uses, especially for livestock feed. Surprisingly, few quantitative data are available concerning mulch availability under smallholder conditions, or on the amount of mulch required to fulfil different ecological functions. To the best of our knowledge, previous research has not addressed the question to what quantity of the available biomass can be removed from field while maintaining a degree of soil cover required for specific agronomic functions. Some authors propose thresholds for biomass exportation but provide few justifications. For example, Govaerts et al. (Reference Govaerts, Sayre, Lichter, Dendooven and Deckers2007) suggest that it is possible to remove 50–70% of the residue while keeping adequate benefits to the soil only considering cereal yields.
The hypotheses of this study are that when CA systems are implemented by smallholder farmers, in some cases the production and/or conservation of biomass lead to a partial soil cover; consequently, we can assume that not all cover functions will be effective. We can support farmers and technicians’ decisions, in terms of biomass management, by establishing curves taking into relation soil cover and mulch quantity by mulch type.
MATERIALS AND METHODS
Location
All fields investigated were located in the Lake Alaotra region, Madagascar, between 17°28.0′S and 17°53.0′S, 48°08.0′E and 48°38.0′E, and 760–950 m above sea level. The mid-altitude tropical climate has a mean annual temperature of 22 °C. Average rainfall near Ambatondrazaka was 994 mm from 2000 to 2010 and 1553 mm from October 2008 to September 2009 (Figure 1) (Bas Rhône Languedoc (BRL), 2010). The hillside soils are Cambisols (texture 20% clay, 38% silt and 42% sand). Lowland paddy fields are Ferralsols (texture 39% clay, 29% silt and 32% sand) (A. Albrecht, personal communication 2010; FAO, 2010b; Razafimbelo et al., Reference Razafimbelo, Albrecht, Feller, Ravelojaona, Moussa, Razanamparany, Rakotoarinivo, Razafintsalama, Michellon, Naudin and Rabeharisoa2010). The hillside soils C stocks (0–20-cm layer) are smaller (15.6 to 19.7 t ha−1) than the paddy soils (23.6 to 29.0 t ha−1) (Razafimbelo et al., Reference Razafimbelo, Albrecht, Feller, Ravelojaona, Moussa, Razanamparany, Rakotoarinivo, Razafintsalama, Michellon, Naudin and Rabeharisoa2010).
Rainfall in the Ambongabe village (48°28′11.2″S, 17°51′50.6′E), lower and upper quartile for the 2000–2010 time period and 2008–2009 season rainfall.

Experimental design
The study was conducted in 91 farmers’ fields in 2008 and 2009. The study was done in one crop cycle but the aim was to stress the intra-annual variability coming from farmers’ management. Cropping systems differ according to their location in the landscape. On the hillsides, locally called tanety, all the crops are rain-fed. In the lowland, paddy field crops are irrigated but with poor water control, as the irrigation network is not fully functional, i.e. the farmers largely depend on rainfall and natural drainage in and out of fields. Two cropping sequences were studied on the hillsides. The first sequence was maize + pulse in year n, followed by upland rice in year n + 1. Pulses were cowpea (Vigna unguiculata (L.) Walp) or dolichos (Dolichos lablab L.), (Figure 2a). The second crop sequence included one year of the forage legume Stylosanthes guianensis Aubl., ‘CIAT 184’. In year n, S. guianensis was sown alone or intercropped with main crops such as Bambara nut (Vigna subterranea (L.) Verdc.), groundnut (Arachis hypogaea L.), maize (Zea mays L.), and cassava (Manihot esculenta Crantz). In year n + 1/+2/+3, S. guianensis was grown alone for as long as the farmer wished. The last year of rotation, i.e. years n + 3 or n + 4, S. guianensis was killed mechanically by cutting the crown. After 2–3 weeks, when the mulch had been flattened, rice was sown (Figure 2b). The third sequence studied was in lowland paddy fields with poor water control, where a cover crop was sown during off-season and rice was sown into the mulch of the cover crop at the beginning of the rainy season. The cover crop was hairy vetch (Vicia villosa Roth) or D. lablab (Figure 2c). In all cropping systems rice was directly seeded without tillage. Less than one-fifth of the maize + pulse fields received nitrogen, phosphorus and potassium (NPK) (in ratio of 11:22:16) or urea fertilizer, and in each case less than 50 kg ha−1 of fertilizer was used. The season before V. villosa and D. lablab were grown less than one-fifth of the paddy crops were fertilized. These fields were fertilized with less than 50 kg ha−1 urea.
(Colour online available at journals.cambridge.org/EAG) Examples of crop and cover crop sequences in CA cropping systems in the Lake Alaotra region, Madagascar. (a) A two-year rotation on hillsides with maize + D. lablab in year n, and upland rice in year n + 1; (b) a multi-annual succession on hillsides with a crop + S. guianensis in year n, S. guianensis alone in year n + 1/2/3, upland rice the last year; (c) a double crop sequence within a year in lowland fields with V. villosa in the off-season and rice in the main season. Modified from Séguy et al. (Reference Séguy, Husson, Charpentier, Bouzinac, Michellon, Chabanne, Boulakia, Tivet, Naudin, Enjalric, Chabierski, Rakotondralambo and Rakotondramanana2009).

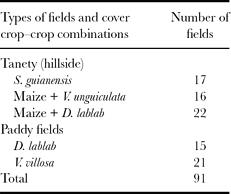
Sizes of the fields were diverse but relatively small, ranging from 100 m2 to 5000 m2. Farmers conducted all cultural operations. Table 1 shows the distribution of fields regarding the crop sequence and their locations.
Number of fields investigated for each of the crop–cover crop combinations. In four fields, measurements were taken in both 2008 and 2009, giving a total of 95 samples.
Aboveground biomass measurement
The available biomass was estimated from October to the first week of December, when rice is usually sown. Where biomass was still living (e.g. S. guianensis on hillside and V. villosa and D. lablab in paddy fields) it was cut close at 5 to 15 cm above the soil surface. Where the plants had already senesced (e.g. maize + D. lablab or maize + V. unguiculata), the dead material was removed from the soil to be weighed. Five sub-samples of 1 m2 were taken in each field, one in the centre of the field and others at the middle of each diagonal linking the centre and the corners of the field. Each sub-sample was weighed separately and a composite sample prepared. The composite sample was weighed in the field, air-dried and finally reweighed. Samples of the biomass (200 g) were oven-dried at 55 °C for 48 h to allow correction for moisture content and stored for near-infrared reflectance spectroscopy (NIRS) predictions. All biomass values are expressed on a dry matter basis.
For some fields of maize + V. unguiculata and maize + D. Lablab, the aboveground biomass was also measured at the end of the growing season (March–April). At this date, five plots of 2.5 m2 were sampled from each field using the above-described pattern. As the maize rows were spaced 1 m apart, each sample included 2.5-m length of one row of maize.
Soil cover measurement
The relationship between mulch mass and soil cover was determined by measuring soil cover of the known mass of plant residue. Residues of D. lablab, V. villosa, maize + D. lablab mixture and S. guianensis were collected from farmers’ fields. In order to give uniform background, quantities of residues equivalent to 1, 3, 6, 9, 12 and 15 t ha−1 were spread on a 1 m2 blue plastic tarpauline. A nadir view photograph of the residue was taken. Digital images were processed using the Photoshop® software to determine the visible area of the blue background. From this we inferred the proportion of the area covered by plant residues. For each quantity of residue, two replicate pictures were taken with a different random arrangement of residues. For randomly distributed mulch elements, the fraction of the soil covered by mulch (C) can be related to the mulch mass (M) by

where Am is an area-to-mass ratio depending on mulch type (Gregory, Reference Gregory1982; Scopel et al., Reference Scopel, Chavez Guerra and Arreola-Tostado1999; Smets et al., Reference Smets, Poesen and Knapen2008). The coefficient Am has physical dimension of area covered by one average straw per mass of one average straw. We determined Am by adjusting a non-linear regression to observed data using the ‘non-linear regression’ function of the XLStat 2010.1.01 software.
Nitrogen content
An NIRS prediction was used to determine the nitrogen content of samples. This method has proved to be an efficient tool to screen the quality of organic resources (Shepherd et al., Reference Shepherd, Palm, Gachengo and Vanlauwe2003). Dried samples were finely grounded (1 mm) and scanned twice at 2-nm intervals over the 1100–2500-nm wavelengths on a monochromator (FOSS—NIR Systems 5000, Silver Spring, MD, USA). Mathematical analysis of the spectral data was performed with WinISI III Version 1.63 software (Infrasoft International, Port Matilda, PA, USA). The NIRS prediction referential used in the present study consisted of a large tropical and temperate forage database pairing reflectance values and reference analyses for concentrations of nitrogen (Tran et al., Reference Tran, Salgado and Lecomte2009). The nitrogen content is reported here only for S. guianensis on hillside and V. villosa, D. lablab on paddy fields, as the analysis has been made on biomass sample just before the seeding of rice. Thus, part of the nitrogen content of this biomass is available to following rice through mulch decomposition.
RESULTS
Production of biomass and amount of mulch available
The mulch available at the end of the dry season (October 2009) compared to the biomass produced at the beginning of the dry season (April–May 2009) was higher for maize + D. lablab fields and lower for maize + V. unguiculata ones (Figure 3). The mean quantity of mulch available prior to sowing of rice on hillsides was 3.6 t ha−1 for fields of S. guianensis, 4.0 t ha−1 for maize + V. unguiculata fields and 5.4 t ha−1 for maize + D. lablab fields. In paddy fields, the mean mulch available was 6.8 t ha−1 with V. villosa and 7.3 t ha−1 with D. lablab (Figure 4a). For all types of mulch, there was considerable variability between the hillside fields, but less variability in the paddy fields.
Relationship between the amount of vegetative biomass (dry matter) produced by cereal (+ cover crop) in April–May 2009 and the amount of mulch left in October 2009. Data from 17 farmers’ fields.

(a) Aboveground dry biomass available as mulch prior to sowing of rice. (b) Soil cover calculated from the amount of biomass measured in the field. Measured in the hillside fields and paddy fields in the Lake Alaotra region, 2008–2009. Number of fields (n): S. guianensis = 19; maize + V. unguiculata = 17; maize + D. lablab = 23; V. villosa = 21; D. lablab = 15. Box plot: median (horizontal continuous line), mean (cross).

Soil cover
The digital picture analysis allowed relationships between the quantity of mulch and soil cover to be derived for four types of mulch (S. guianensis, maize + D. lablab, D. lablab alone and V. villosa). Equation (1) proved to be a good descriptor of this relationship, as the coefficient of determination between observed soil cover and curve fit was greater than 0.99 in all cases (Figure 5a). Am for maize + D. lablab, D. lablab, S. guianensis and V. villosa are presented in Table 2. The capacity of plant residues to cover the soil varied strongly between different residues. For example, 3 t ha−1 of maize + D. lablab covered around 50% of the soil surface, 3 t ha−1 of D. lablab covered 60%, whereas a similar quantity of V. villosa biomass covered nearly 90% of the soil surface. Ninety-five percent of soil cover was obtained with less than 5 t ha−1 of V. villosa, but the same cover rate required 10 t ha−1 of D. lablab.
(a) Soil cover (%) as a function of the amount of mulch for different crop–cover crop combinations. *Data from this study, †data from Teasdale and Mohler, (Reference Teasdale and Mohler2000), ‡data from Scopel et al. (Reference Scopel, Chavez Guerra and Arreola-Tostado1999). Equation: C = 1 − exp (−Am ×M ), where C is the fraction of the soil covered by mulch, M is the mulch mass in t ha−1 and Am is an area-to-mass ratio depending on mulch type. The R2 for the fitted curves for S. guianensis, maize + D. lablab, D. lablab and V. villosa are, 0.991, 0.990, 0.998 and 0.998, respectively. (b) Soil cover calculated from the quantities of biomass measured in the field. The relationship between mulch quantity and soil cover for maize + V. unguiculata has been inferred from the relationship for maize + D. lablab. Number of fields (n): S. guianensis = 19; maize + V. unguiculata = 17; maize + D. lablab = 23; V. villosa = 21; D. lablab = 15.

Area-to-mass ratio values (Am) from this study and from the literature for different crops and cover crops.

The range of biomass quantity (Figure 4a) was then converted to soil cover (Figure 4b) using Equation (1) and the Am values given in Table 2. The calculated average soil cover (lower and upper quartile between commas) for S. guianensis, maize + V. unguiculata, maize + D. lablab, V. villosa and D. lablab was 66% (58–79%), 56% (30–74%), 70% (62–84%), 97% (99–100%) and 87% (84–94%), respectively. The range of variability observed for mulch quantity was different from those of soil cover. For example, CV of the average quantity of mulch of V. villosa was 34%, but the CV for soil cover was only 8%. For maize + D. lablab cover the CV varied from 27 to 41% (Figures 4a, b).
Impact of biomass removal on soil cover
Using the biomass production of V. villosa, D. lablab, S. guianensis, and maize + V. unguiculata measured in the field (Figure 4a) and the soil cover curves derived from this data (Figure 5b), estimates were made of the effects of biomass removal on soil cover (Figure 6). This was done using the upper and the lower quartiles of biomass production among farmers’ fields. For V. villosa, points A, B, C and D mark the maximum quantity of biomass that can be removed before reaching 90% of soil cover (A, B) or 30% (C, D), for three quarters of fields (A, C) or one-quarter of fields (B, D). For three quarters of the V. villosa fields, 3 t ha−1 can be removed while maintaining 90% soil cover, and 5.6 t ha−1 can be removed from one-quarter of the fields (Figure 6). If the target is 30% of soil cover, then the removable biomass will be 5.6 and 7.9 t ha−1 for three quarters or one-quarter of the fields, respectively.
Effect of biomass removal on soil cover for five different cover crops, V. villosa, D. lablab, maize + D. lablab, S. guianensis and maize + V. unguiculata and quartile values from farmers’ fields. Points A, B, C and D mark the maximum quantity of dry biomass, which can be removed while maintaining 90% soil cover (A, B) or 30% (C, D), for 3/4 of the fields (A, C) or 1/4 of the fields (B, D). These quantities for A, B, C and D are 3.0, 5.3, 5.6 and 7.9 t ha−1, respectively.

Nitrogen content
The average nitrogen content of samples was respectively 2.7% of dry matter for S. guinanensis, 3.4% for V. villosa and and 1.8% for D. lablab. Combining with total biomass available, this gave 82 (±21) kg N ha−1 in the mulch for S. guinanensis, 236 (±97) kg N ha−1 for V. villosa, and 123 (±46) kg N ha−1 for D. lablab (Figure 7).
Amount of nitrogen (kg ha−1) contained in the aboveground dry biomass of different cover crops. Number of fields (n): S guianensis, n = 5; V. villosa, n = 21; D. lablab, n = 15. Box plot: median (continuous line), mean (cross).

DISCUSSION
Production and conservation of biomass
Although maize + D. lablab fields had more biomass at the end of the dry season than at the beginning, less biomass remained in almost all maize + V. unguiculata fields. Three reasons can explain the difference between these two cover crops. First, V. unguiculata had ceased to grow before the end of the rainy season, whereas D. lablab continued to grow into the dry season. Second, cattle herders tend not to graze their cattle in fields of maize + D. lablab fields, as they see D. lablab is still growing there. As all the standing biomass dries in situ in maize + V. unguiculata fields, herders consider it to be a ‘normal’ field available for grazing. Third, farmers grew D. lablab only to produce biomass for the next crop, and not for edible grain. By contrast, farmers grew V. unguiculata for grain with the additional benefit of biomass for use as mulch. Nevertheless, the amount of biomass remaining at the end of the dry season in the Alaotra region of Madagascar is large compared with CA systems in other countries of sub-Saharan Africa, e.g. 3.5 t ha−1 (Naudin et al., Reference Naudin, Gozé, Balarabe, Giller and Scopel2010) or 2 t ha−1 (Wezel and Rath, Reference Wezel and Rath2002).
S. guianensis can be cut and killed at the beginning of the third year after sowing to produce mulch where rice can be sown (Husson et al., Reference Husson, Charpentier, Raharison, Razanamparany, Moussa, Rasolomanjaka, Michellon, Naudin, Rakotoarinivo, Rakotondramanana, Enjalric and Séguy2010). All S. guianensis fields investigated were in the third, fourth or fifth year but the average biomass available at the beginning of the subsequent rainy season was 3.6 t ha−1, a small amount compared with the other cover crops, and much less than reported elsewhere (e.g. Saito et al. Reference Saito, Azoma and Oikeh2010 reported 7.4 t ha−1 for a two-year stand in Benin). Under controlled conditions, S. guianensis produced from 5 to 20 t ha−1 (Husson et al., Reference Husson, Charpentier, Razanamparany, Moussa, Michellon, Naudin, Rakotoarinivo, Rakotondramanana and Séguy2008), but under real farmers’ conditions most of these fields had been partially grazed during the dry seasons, which explained the relatively small amount of remaining biomass. S. guianensis is well known to support multiple cuts during the growing season to provide fresh forage for animal feed, and is resistant to grazing (Roberge and Toutain, Reference Roberge and Toutain1999). Nevertheless, this reduces its final growth and biomass available. Furthermore, S. guianensis is usually grown on the worst fields where farmers intend to improve soil fertility and can afford to leave the field uncropped. The 2008–2009 cropping season was rainy season (1553 mm) compared with the average rains (994 mm), thus the biomass obtained on hillsides was close to the optimum attainable in this region. Biomass production on paddy fields should be less sensitive to this climatic condition, as the water is not limiting in this kind of fields.
In the lowland paddy fields, biomass production of D. lablab and V. villosa was similar at around 7 t ha−1, and greater than reported earlier in the literature, e.g. 2.44 to 5.16 t ha−1 (Sainju et al., Reference Sainju, Whitehead, Singh and Wang2006). None of these V. villosa or D. lablab fields have been grazed. Farmers prefer to grow V. villosa in this kind of field, as it can be intercropped with vegetables. V. villosa requires more water than D. lablab, so it is found only in lower lying fields with fine soil texture that allow capillary rise. When water is more limiting, D. lablab is selected.
In the Lake Alaotra region of Madagascar where no basal fertiliser is applied, large amount of legume biomass was achieved in the lowland fields, but less biomass was produced in the upland fields probably due to poorer soil fertility. In particular, this poor production can be linked with low phosphorus availability. In many parts of the tropics basal fertilisation with phosphorus and other nutrients is required to get good legume growth and nitrogen fixation (Giller and Cadisch, Reference Giller and Cadisch1995). In paddy fields, the use of adapted legumes (D. lablab and V. villosa) on relatively fertile soils allowed production of a large amount of biomass each year without competing with other crops. The paddy fields are usually under exploited during the off-season, as vegetables are the only crops grown where manual irrigation is possible. The area covered by vegetables is small due to the labour required, leaving a large area where cover crops could be grown.
Relationships between biomass and soil cover
The capacity of plant residues to cover soil varied strongly between different residues. The presence of small leaves in V. villosa, S. guianensis and D. lablab gives the higher Am value compared with cereal residues alone so that much less biomass is needed to obtain the same percentage of soil cover. The digital picture analysis proved to be a useful tool for generating predictive equations to relate biomass with soil cover for different residue mixtures (Figure 5a). This method is relatively easy to use even with low resources. It should be used more in order to better characterise mulch characteristics and thus to allow a better explanation for CA cropping systems impacts. As we can see in Figure 4a, the variability in terms of biomass production is relatively high, as is commonly found in smallholder cropping systems in developing countries (Naudin et al., Reference Naudin, Gozé, Balarabe, Giller and Scopel2010; Tittonell et al., Reference Tittonell, Vanlauwe, Corbeels and Giller2008). This variability results in a wide range of soil cover (Figure 4b) and nitrogen input (Figure 7). These examples demonstrate the wide variability in biomass yield found under farmer's conditions, even for one type of cropping system, so that the agronomic benefits expected from CA are not necessarily fulfilled. Further, the agronomic benefits are not linearly linked with the quantity of mulch and therefore thresholds should be defined for specific combinations of environmental conditions, cover crop and expected function.
Maintaining sufficient mulch
We can infer from Smets et al. (Reference Smets, Poesen and Knapen2008) that a minimum of 30% soil cover is required to reduce inter-rill soil erosion substantially, whereas a target of 90% is the minimum required to obtain a good weed control (Bilalis et al., Reference Bilalis, Sidiras, Economou and Vakali2003; Teasdale and Mohler, Reference Teasdale and Mohler2000). The amount of mulch required to achieve these rates of soil cover can be readily derived from Figure 5a. On the hillside fields where the biomass production was less than in the lowland paddy fields, the amount of biomass that could be removed was substantially less. For example, for S. guianensis, 90% of soil cover was reached in less than a quarter of the fields. With a target of 30% of soil cover, the removable biomass was between 1.4 t ha−1 for three quarters of the fields and 3.4 t ha−1 for a quarter of the fields. Thus, the amount of biomass that can be removed for livestock, or grazed in situ varies strongly between the hillside and lowland paddy fields and between different legumes or residue mixtures. Govaerts et al. (Reference Govaerts, Sayre and Deckers2005) stressed the need to establish critical amount of residue required for maintaining soil productivity while using part of the biomass as fodder. These authors also mentioned that zero tillage with residue retention give better cereal yield results than without residue. But they did not specified the quantity of mulch retained and even less the percentage of corresponding soil cover.
Knowing the relationship between potential removable biomass and impact in terms of soil cover rate can help farmers to take decisions regarding the possibility to use part of the biomass produced in field. It also helps to compare the management flexibility of different cropping systems. In fact, in no-till cropping systems, the lack of mulch, less or equal to 30% of soil cover, can lead to increased erosion (Volk et al., Reference Volk, Cogo and Streck2004) and weed competition (Bilalis et al., Reference Bilalis, Sidiras, Economou and Vakali2003) compared with tilled cropping.
Nitrogen availability and role on short-term productivity and long-term fertility
Beyond the quantity of biomass produced, the quality also varies among cover crops and fields. Again, for the same types of field (paddy field) and cropping system (annual rotation with rice), the quantity of nitrogen available in the residues can double with the type of cover crop, e.g. 123 kg N ha−1 for D. lablab against 236 kg N ha−1 for V. villosa. Values for V. villosa are higher than those observed by Sainju et al. (Reference Sainju, Whitehead, Singh and Wang2006), which varied from 76 to 167 kg N ha−1 depending on the year. These authors showed that even with the smaller amount of biomass added, the available inorganic nitrogen content increased in the soil when V. villosa was killed resulting in increased grain and biomass yields of the subsequent sorghum crop.
The biomass nitrogen can be partially returned to soil to benefit the following rice crop, or be fed to cattle to improve animal productivity. As stressed by Rufino et al. (Reference Rufino, Rowe, Delve and Giller2006), the direct application of plant materials to soil results in more efficient cycling of nitrogen, with fewer losses from the system than from materials fed to livestock and then returned to the soil through manure. However, livestock provide many other benefits, and animal manure can contain large amount of available nitrogen, which can promote crop growth in short term (Rufino et al., Reference Rufino, Rowe, Delve and Giller2006). The partial allocation of the biomass to cattle or to mulch is driven by the goals of the farmer; especially by trade-offs between expected benefits from rice yield improvement, reduction in labour required for weeding and enhanced cattle production.
The short-term effects of mulch, such as water balance improvement (Scopel et al., Reference Scopel, Silva, Corbeels, Affholder and Maraux2004; Thierfelder and Wall, Reference Thierfelder and Wall2010), are more easily perceived by farmers than long-term effects on soil fertility. Although after eight years of implementation of CA in the Lake Alaotra region, the C stock was consistently greater in CA plots (between 1.1 t ha−1 and 3.5 t ha−1) than in ploughed plots, but the difference was not statistically significant (Razafimbelo et al., Reference Razafimbelo, Albrecht, Feller, Ravelojaona, Moussa, Razanamparany, Rakotoarinivo, Razafintsalama, Michellon, Naudin and Rabeharisoa2010). Furthermore, these results were obtained when all of the plant residues were returned as mulch in the CA plots (rarely achieved in farmers’ fields) compared with complete removal of crop residues in the ploughed plots. These results reinforce the conclusion that the fulfilment of agroecological functions by CA will depend on the amount of biomass returned to soil and length of time the system is implemented.
CONCLUSION
Our results showed that it is possible to produce and keep sufficient biomass in the field for CA systems even under smallholder farming conditions where livestock graze freely during dry season. However, the quantity of biomass produced varies strongly between hillsides and valleys, and between cover crops and farmers’ management. Soil cover is not linearly related to mulch quantity. Thus, for a given quantity of biomass exported to feed cattle, the impact is different depending on the cover crop, the initial amount of biomass and the agroecological functions of mulch searched by farmers. When comparing benefits of different types of CA cropping systems, it is important to report the amount and quality of biomass produced, and the corresponding rate of soil cover. In terms of the agroecological functions of soil cover, such as weed control, erosion control and water retention, different amount of mulch is required with different cover crops. The relationships between biomass export for cattle feed and these agroecological functions require more systematic study. The decision on how much biomass can be removed from the field will depend on the local biophysical conditions, the biomass characteristics and the farmer's goals for his/her whole farm system.
Acknowledgements
This study was conducted in collaboration with the BV Lac project (Bassins versants–Lac Alaotra) of the Malagasy Ministry of Agriculture implemented by Centre de Coopération Internationale en Recherche Agronomique pour le Développement (CIRAD) and funded by the Agence Française de Développement (AFD). The farmers were advised by Agronomes et Vétérinaires Sans Frontières (AVSF) and Bas Rhône Languedoc-Madagascar (BRL-Madagascar). We are grateful to all of them for their technical support. This study was funded by (i) PEPITES project from Agence Nationale de la Recherche (ANR), (ii) PAMPA project from AFD, Fond Français pour l'Environnement Mondial (FFEM) and Ministère des Affaires Étrangères (MAE) and (iii) CIRAD.



