The opportunity to attend college and earn a degree has increased dramatically in China. Government appropriations for higher education have increased from 33.4 billion yuan in 1997 to around 164.8 billion yuan in 2007, an annual real growth rate of over 13 per cent.Footnote 1 Through this large-scale investment, more than 800 new comprehensive universities (or colleges – which will be the word used to cover both universities and colleges in the rest of the paper) and professional colleges were founded, nearly doubling the number of tertiary institutions in China. The enrolment rate of colleges has also increased by more than five times from about 3 million students in 1997 to over 17 million in 2007.Footnote 2 Statistics from the Ministry of Education support these numbers. The aggregate gross enrolment rate at the higher education level increased more than sevenfold between 1990 and 2006, from 3.4 per cent to 22 per cent. This means that in 2006, more than one out of five students in the 18- to 22-year-old cohort had the opportunity to achieve a higher education.Footnote 3
One reason for this expansion was to provide opportunities for a broader, more diverse set of students to attend college. There are many policy documents that explicitly state this as one of the goals of China's higher education policy. For example, in one policy, the Initiative for the Development of Chinese Women, China's leaders asserted that if women were ensured the right to pursue higher education, this would help make them more equal in political, economic, cultural, social and family affairs. Similarly, one of the goals of The Law of Higher Education (1998) is to help students from poor areas and students of minority ethnic origins in their pursuit of college degrees.
Although China has always maintained an ideology that has stated equality as one of its main goals, there has been research in the past that has questioned the effectiveness of these policy pronouncements, especially in the case of higher education. Emily Hannum et al. have shown that minorities have been systematically excluded from colleges.Footnote 4 Yaohui Zhao has concluded that rural students have less of a chance to go to college than urban students.Footnote 5 There is research on the challenges of women – even those with urban registered residence (hukou 户口) – being systematically squeezed out of certain disciplines in college.Footnote 6 While these works clearly show that China's higher education institutions have not treated all students equally, most of the studies predate the recent expansion of the college system. There have been few studies that have examined China's renewed policy commitment (at least in principle) to provide educational opportunities for all. Among the studies that have addressed these issues, almost none have provided any systematic, evidence-based data on the topic.
The purpose of this research note is simple. We want to report on the results of a recent comprehensive survey of all incoming freshmen in four tier one colleges in Shaanxi, Sichuan, and Anhui. In this survey, we collected information that will allow us to categorize each student as: urban or rural (by hukou status); male or female; Han (汉) or non-Han; rich or poor. We then assessed if certain types of students (for example: Han, male, urban, rich, or some combination thereof) are over-represented while other types of students (for example, minorities, female, rural, or poor) are under-represented.
The research note makes several contributions. First, we present material from a new set of primary data that was collected in 2009, almost a decade after the start of the expansion of China's university system in the late 1990s. Being collected from all freshmen (nearly 100 per cent of them) inside the particular university system, it provides information from a unique data collection exercise. According to the data, there are several original findings. First, we confirm that the under-representation of women and rural individuals documented by earlier studies continues – even after the expansion of the college system (that was, in part, done to eliminate such under-representation). Second, due to the nature of the data (which allow for identification of disaggregated groups of college students in a new way), we find that the gender bias documented by others is due (at least in our four tier one universities) to the under-representation of rural women; urban women are not under-represented. We find that rich rural individuals are not under-represented; those from poor areas are. Finally, we identify and quantify that the most under-represented group is poor, rural, minority women. Such individuals are in tier one colleges at less than one-fifth of their population share. The greatest degree of under-representation is in nationally supported tier one colleges (as opposed to provincially supported tier one colleges).
Data
In this paper we use a set of data that we collected in 2008. This survey is a complete census of all incoming freshmen at four colleges – two nationally supported colleges (Xi'an Jiaotong University 西安交通大学 and Sichuan University 四川大学) and two provincially supported colleges (Anhui University 安徽大学 and Northwest University 西北大学 in Xi'an).Footnote 7 These four colleges are located in three poor provinces: Shaanxi, Sichuan and Anhui.Footnote 8 For clarity, we call this survey the Four College Freshmen Survey.
In order to implement the survey, we worked closely with the student affairs division of each college. The division head assigned a task force to make sure that the survey form was distributed to each student at some point during the first week of the academic year. Within each college, a set of survey forms was distributed to each class captain (banzhuren 班主任), which is the equivalent of a homeroom teacher in US high schools. Students were informed that the surveys were voluntary, anonymous, and that the information in them would only be used for research purposes. The students returned the completed forms to their class captain, who relayed the forms to the student affairs office by the end of the second week of September. The response rate was over 99 per cent.
The content of the survey was relatively simple. We asked each student a series of questions about their own unique characteristics and a set of questions about their poverty status. Specifically, we asked for the students' gender, ethnicity and hukou status. We also asked for the province and county of their birth and the province and county in which they attended high school. From this we were able to determine if the student was from a county that was a nationally designated poor county.
One of the main uses of the student survey was for collecting information that could identify students that were truly poor. In addition to the questions described in the previous paragraph, each student also was asked to fill out a checklist of the durable assets owned by his or her household. Once a value was attached to each asset (based on the national Household Income and Expenditure Survey which is organized and published by the China National Bureau of Statistics), we were able to have a single metric of the value of the asset holdings of each student's household.Footnote 9
We surveyed a total of 20,253 students. Sichuan University had by far the most students, at over 8,800. The number of surveyed students from the other colleges ranged from 3,000 at Northwest University to 4,900 at Anhui University (Table 1).Footnote 10
Distribution of Sample Freshmen by University

Source:
Authors' Four College Freshmen Survey.
Access to Higher Education in China
In order to use our data to assess whether or not different groups of students have been gaining equal access to college, we compare the enrolment rates of these student groups with their share of the population as a whole. We are, of course, comparing students who are 19 years of age (plus or minus one or two years) with those in the general population that are in the same age cohort (14- to 22-year-olds). Our assessment of whether or not a particular group is under- or over-represented depends on whether or not the share of that group in the total incoming freshman class is smaller or larger than the share of that group in the population as a whole. For example, if males make up 60 per cent of the incoming class, but only 54 per cent of the 19-year-old cohort in the population at large, they would be over-represented in college and females would be under-represented.
Alternatively, we can also calculate the ratio of the share of a specific group (e.g. rural students) in the overall enrolment rate of the sample colleges. The ratio can be used to compare the share of the same group in the population as a whole to the share of the similar age-cohort generation in the population, respectively. If the ratio is less than 1, it means this group is under-represented in the college education system. If the ratio is larger than 1, it means this group is over-represented in the college education system.
Rural versus urban
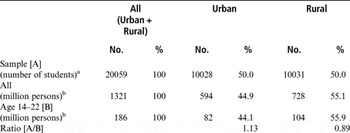
Although national education statistics materials do not include a breakdown of the share of students from rural or urban areas, statistics based on data from our Four College Freshmen Survey show that across all colleges (in our sample) there is a tendency to admit relatively more urban students. The enrolment rates of students from urban and rural areas are almost exactly the same (Table 2, column 5 and 7, rows 1). However, the shares of population in urban and rural areas are not. In China today, 45 per cent of the population is categorized as urban while 55 per cent of the population is considered rural, with rural hukou status.Footnote 11 Looking at the 14 to 22 age cohort, there is a similar split between urban and rural. Since the share of rural cohort in the total population (or in the nation's total 14- to 22-year-old population) is larger than the share of the students from rural areas (50 per cent), this means that rural students are under-represented. The share of rural college students is 6 percentage points lower than its corresponding population share. Of course, this also means that urban students are over-represented. Another way of characterizing this over-representation is by noting that the ratio of the share of students from urban areas to the share of the urban population in China's overall population is greater than 1 (1.13).
The number and percentage of the freshmen by urban and rural areas

Notes:
a The unit of observation in the sample is “number of students.”
b The unit of observation are “million persons.” These represent the total number of persons in China/urban and rural (row 2); and the number of persons in the 14–22 age cohort/urban and rural (row 3).
Source:
Data are from the authors' Four College Freshmen Survey (row 1); the national data are from China's Population and Employment Statistical Yearbook (NBS, 2008 – rows 2 and 3).
While the gap (6 percentage points) is significant when comparing the share of urban to rural population China as a whole, it is even larger if we use urbanization rates from only Sichuan, Shaanxi and Anhui provinces. In this case we use the data from the home provinces of the colleges in our sample. Using data on the share of the 14- to 22-year-old cohort that are from urban areas in Sichuan, Shaanxi and Anhui, the share of urban students in the Four College Freshmen Survey is 18 percentage points greater (statistics are not shown in the tables for the sake of brevity).Footnote 12,Footnote 13
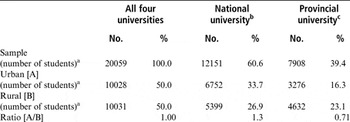
Dividing the data by nationally supported colleges (Sichuan University and Xi'an Jiaotong University) and provincially supported colleges (Northwest University and Anhui University) we see that the urban bias is, in fact, completely driven by the more elite, nationally supported colleges (Table 3, rows 1 to 3; columns 4 to 7). As per the discussion above, across all four of the colleges the representation ratio (1) shows that urban students are over-represented. Significantly, in our sample's provincially supported colleges, the ratio is actually less than 1 (0.71). This means that provincially supported colleges have relatively more rural students. In contrast, in the sample's nationally supported colleges, the representation ratio of the share of urban students to the population share of urban students is 1.3. From this it is clear that the over-representation of urban students in our sample is fully driven by nationally supported colleges.
The Number and Percentage of Freshmen by University and by Urban or Rural Areas

Notes:
a The unit of observation in the sample is “number of students.”
b National universities refer to Xi'an Jiaotong University and Sichuan University;
c Provincial universities refer to Northwest University and Anhui University.
Source: Data are from authors' Four College Freshmen Survey.
Male versus female
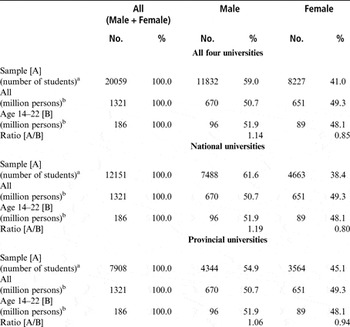
The data from the Four College Freshmen Survey also demonstrate that males are over-represented (Table 4, rows 1 to 4). According to our data, the share of female students in the sample is 41 per cent. However, the share of the population in the 14- to 22-year-old cohort is 48 per cent. This means that women are under-represented by 7 percentage points. The representation ratio is less than 1 (0.85). When examining the nationally supported colleges (not shown) it is clear that here, too, there is more of a bias against female students. The representation ratio is only 0.80 in nationally supported colleges and 0.94 in provincially supported colleges.
The Number and Percentage of Freshmen by Gender and by Universities

Notes:
a. The unit of observation in the sample is “number of students.”
b. These are total population and population at the age of 14–22 at the national level in 2007; the unit of the data at the national level is “million persons.”
Source:
Sampled data are from the authors' Four College Freshmen Survey; the data at the national level in 2007 are derived from China's Population and Employment Statistical Yearbook (NBS, 2008).
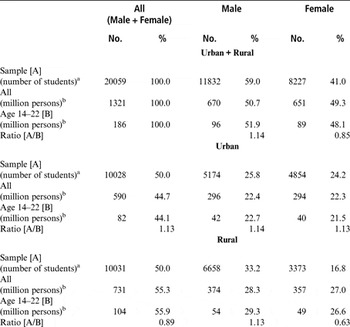
When dividing the sample by urban/rural status and gender, we see that the under-representation of women in the Four College Freshmen Survey is due to the fact that rural women attend colleges at a rate far lower than their population share (Table 5, rows 5 to 12). In fact, the representative ratio of urban males, urban females and rural males are almost the same, ranging between 1.13 and 1.14. The ratio of the share of rural female students who attend college to the share of the women in the 14 to 22 age cohort is only 0.63. In our sample, rural women make up only 17 per cent of the entire sample (3,373/20,059). By contrast, rural women make up 27 per cent of China's population of 14- to 22-year-olds. In fact, the low share of women in college is not surprising. Kipnis noted that parents in rural areas (even well off ones, like those in Shandong, the location of his study) often do not encourage their daughters to go to high school.Footnote 14 If the high school enrolment rates of girls are low, the college rates will also necessarily be low. His conclusion is mirrored by Hannum; in poor rural areas of China girls, particularly those from resource-limited families, are still disadvantaged in education, enrolment and transition to upper secondary education.Footnote 15 Nevertheless, many researchers have demonstrated that the educational performance of girls has gradually become more comparable with (and even exceeds) that of boys (both around the world and in China's large cities).Footnote 16
The Number and Percentage of Freshmen by Urban or Rural areas and by Gender

Notes:
a. The unit of observation in the sample is “number of students”.
b. These are total population and population at the age of 14–22 at the national level in 2007; the unit of the data at the national level is “million persons”.
Source:
Sampled data are from the authors' Four College Freshmen Survey; the data at the national level in 2007 are derived from China's Population and Employment Statistical Yearbook (NBS, 2008).
Han versus non-Han
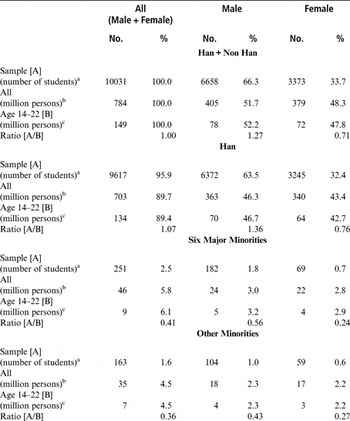
The largest rates of under-representation, however, are for ethnic minorities. When comparing Han to non-Han, we can see that minorities, especially lesser minorities (as opposed to the six large minorities, Zhuang 壮, Manchu 满, Hui 回, Miao 苗, Uyghur 维吾尔and Tujia 土家), are under-represented (Table 6, columns 2 and 3).Footnote 17 Rural China's 14- to 22-year-old cohort is 89.4 per cent Han. However, 95.9 per cent of the Four College Freshmen Survey students were Han. This means, of course, that the representative ratios for non-Han are small. The ratio of the six large minorities is 0.41. The ratio of the other lesser minorities is 0.36. Our results are consistent with the conclusion by Hannum and Park; the gap between Han and non-Han is fundamentally a rural problem.Footnote 18
The Number and Percentage of Freshmen from Rural Areas by Ethnicity and by Gender

Notes:
a. The unit of observation in the sample is “number of students.”
b. These are total rural population at the national level in 2000 in the unit of million persons.c. These are rural population at the age of 14–22 at the national level in 2008 in the unit of million persons. These figures are calculated by the population between the age of 6 and 14 in 2000. Here we ignore the death rate of the population in this age cohort during 2000–2008, and thus these figures could be overestimated.
Source:
Sampled data are from authors' Four College Freshmen Survey; the data at the national level are derived from The Tabulation on Nationalities of 2000 Population Census of China (NBS 2003).
These ratios are even smaller in the case of rural female minority students (Table 6, columns 6 to 7). For example, the representative ratio of rural minority female students (for the six large minorities) is only 0.24. The same number for the other lesser minorities is 0.27 per cent. Clearly the share of rural minority females who are able to attend one of the four sample colleges is around one quarter of its population share.
Poor versus non-poor
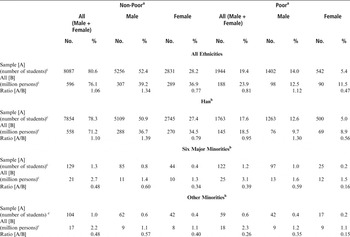
Poor students also are under-represented, especially rural poor students (not shown for brevity). In the analysis, poor students refer to the students from the nationally designated poor counties. When looking at the data from our Four College Freshmen Survey, the representative ratio for students from poor rural areas is 0.81. Students, especially those from poor rural areas, are under-represented in China's colleges, according to our study.
The lowest ratio is for female, minority students from poor rural areas (see Table 7). The ratio of the share of female, minority students from poor rural areas to their age cohort share ranges from 0.16 (for the six large minorities) to 0.15 (for the other lesser minorities). Indeed, in our sample of more than 20,000 college students, only 42 were female minorities from poor rural areas (25 from the six large minorities and 17 from the other lesser minorities). Based on data in the Educational Statistics Yearbook of China, Zhu Zhiyong points out that the percentage of ethnic minority students enrolled in college (institutions of higher education) is still below the percentage of minorities in the nation's population.Footnote 19 Consistent with Hawkins et al. and Postiglione, our results indicate that although tertiary enrolments have increased substantially, these government statistics typically do not reveal the enduring inequities, i.e. minorities, especially those involving females in rural poor areas, have few opportunities for access to upper tier universities, most of which are state funded.Footnote 20
The Number and Percentage of Freshmen from Rural Areas by Poor and Non-poor Counties, Ethnicity and Gender

Notes:
a. Poor means the people are living in the Nation-designated poor counties. Non-poor means the people are not living in the Nation-designated poor counties.
b. Han means Han ethnicity; six major minorities include Zhuang, Manchu, Hui, Miao, Uyghur, Tujia minority nationalities (the populations of each of these six major ethnic groups are more than 8 million); other minorities means people from other minority nationalities but not the above-mentioned seven ethnic groups in China
c. The unit of observation in the sample is “number of students.” The unit of the population at the national level is “million persons.”
Source:
Sampled data are from the authors' Four College Freshmen Survey; data at the national level are derived from The Tabulation on Nationalities of 2000 Population Census of China (NBS 2003).
Conclusion
It is generally understood that education is important and benefits societies as well as individuals. Thus, the question of “who gets higher education” assumes a central place in the historically important issue of social inequality. Based on a census survey in four tier one colleges in China and government census statistics, we examined the impact of higher educational expansion patterns on the attainment of higher education by the location of residence, gender, ethnicity and socioeconomic status. In terms of educational inequalities, the rural–urban gap still exists, especially in the national colleges. Gender disparities are exacerbated when combined with minority ethnicity. Moreover, students from poor rural areas are more under-represented in access to college compared to their counterparts from rich rural areas. These facts suggest that even under the substantial expansion in higher education from the supply side, the inequality of access to higher education at the demand side still exists. This inequality is related to certain characteristics of the prospective student, such as being rural or urban, male or female, Han or non-Han, rich or poor. This leads us to our conclusion that today's Chinese college is still a rich, Han, urban and male club.
Are there institutional features that can be identified as leading to (or minimizing) the under-representation of rural and minority students? If we compare the course offerings (as seen in the presence or absence of departments or colleges) of nationally supported and provincially supported tier one colleges, can we observe that there are more courses/sets of courses that might be more attractive to rural/minority students in provincially supported universities?
In general, this does not seem to be the case. The breadth of colleges and departments and majors are largely the same. This would seem to suggest that there is – for some reason (perhaps more structural) – discrimination against under-represented groups.
However, if one looks closely it is possible to identify a relatively modest number of disciplines offered in provincially supported universities (in the case of this paper – Northwest University and Anhui University) that might be somewhat attractive to rural students (one of the under-represented groups). In Anhui University, for example, students can major in land resource management, tourism management and labour/social security. In Northwest University there are offerings of resource exploration, food science and geology.
Hence, while there are almost certainly more systematic factors accounting for the less representative nature of nationally supported universities, course offerings may explain part of the gap. Also, in drawing this conclusion, we must caution the reader that the findings from our review of department and college offerings from the four sample universities is too small to state systematically that this one of the ways that China could correct the under-representation of rural and minority students. But, the findings of our survey of offerings should help encourage other researchers to view this as an area of future research and a potential source of future policy action.