



1. Introduction
In the face of climate change, high-speed rail has gradually developed to become the key to decarbonizing transportation. As a bluff body operating at high Reynolds number ( $\textit{Re}$), the flow around a high-speed train exhibits complex characteristics of a fully developed three-dimensional turbulent flow (Schetz Reference Schetz2001). The unsteady aerodynamics of high-speed trains is then directly characterized by the fluctuating aerodynamic forces and induced slipstreams. Therefore, understanding the dominant dynamics in the complex turbulent flow around the train is crucial to improving and optimizing aerodynamic performance. For this purpose, the search for and identification of physically significant coherent structures, or modes, is a suitable method (Taira et al. Reference Taira, Brunton, Dawson, Rowley, Colonius, McKeon, Schmidt, Gordeyev, Theofilis and Ukeiley2017). In fact, extracting and understanding the physical mechanisms of instability in complex three-dimensional turbulent flow has been attracting research interest for several decades but remains challenging. In particular, the complexity of the base flow, as well as the high demand for computational resources, causes huge difficulties in solving this problem (Theofilis Reference Theofilis2011). However, due to the increasing demand for transportation efficiency, passenger comfort and operational safety, extracting and understanding the mechanisms of instability in the flow around the train is still of great research interest and significant engineering importance.
Despite its aerodynamic design, the high-speed train exhibits bluff-body flow characteristics reminiscent of those of the well-studied Ahmed body (Ahmed, Ramm & Faltin Reference Ahmed, Ramm and Faltin1984; Lienhart, Stoots & Becker Reference Lienhart, Stoots and Becker2002). Three important structures can be identified in the wake of the body: a recirculation bubble over the slanted surface, a pair of longitudinal C-pillar vortices generated from the two side edges of the slanted surface and a recirculation zone behind the rear vertical base. Several studies have focused on the interaction and control strategies of these structures. In Zhang, Zhou & To (Reference Zhang, Zhou and To2015) and Liu et al. (Reference Liu, Zhang, Zhang and Zhou2021), the unsteady characteristics of Ahmed bodies in the high- and low-drag regimes were investigated using multiple experimental techniques. On the basis of these findings, several steady blow drag reduction strategies have been successfully developed (Zhang et al. Reference Zhang, Liu, Zhou, To and Tu2018; Li et al. Reference Li, Cui, Jia, Li, Yang, Morzyński and Noack2022). Meanwhile, random switching between two reflectional-symmetry breaking states of the wake has been investigated in Grandemange, Gohlke & Cadot (Reference Grandemange, Gohlke and Cadot2013) and He et al. (Reference He, Minelli, Wang, Dong, Gao and Krajnović2021a), with appropriate strategies altering the natural bi-stability of the wake proposed in Grandemange, Gohlke & Cadot (Reference Grandemange, Gohlke and Cadot2014), Evstafyeva, Morgans & Dalla Longa (Reference Evstafyeva, Morgans and Dalla Longa2017) and Haffner et al. (Reference Haffner, Borée, Spohn and Castelain2020).
However, the full picture of the three-dimensional coherent structures in the wake, as well as the associated instability information, remains limited. Therefore, further interpretation and understanding of the physical mechanisms that generate disturbances in the flow are limited. In particular, for more aerodynamically shaped high-speed trains, the identification of the flow structures mentioned above is less obvious. To extend our understanding and control of wake dynamics in a more complex situation, modal decomposition (Taira et al. Reference Taira, Brunton, Dawson, Rowley, Colonius, McKeon, Schmidt, Gordeyev, Theofilis and Ukeiley2017) of the three-dimensional flow must be taken into consideration, which is the objective of this work.
Data-driven analysis has proven to be an effective method to extract coherent structures from flow snapshots as empirical modes. The most classic and widely used data-driven approach, proper orthogonal decomposition (POD), was first introduced to the field of fluid dynamics by Lumley (Reference Lumley1967, Reference Lumley1970). In this approach, the flow is represented as a mean and a superposition of space–time-dependent modes. These resulting modes can then be used for a variety of purposes, from classification to reduced-order modelling to control (Rowley & Dawson Reference Rowley and Dawson2017; Taira et al. Reference Taira, Brunton, Dawson, Rowley, Colonius, McKeon, Schmidt, Gordeyev, Theofilis and Ukeiley2017). Meanwhile, many other empirical approaches have been proposed. For example, balanced POD (Rowley Reference Rowley2005) which serves as an expansion for linear input–output relationships, and dynamic mode decomposition (DMD) (Schmid Reference Schmid2010) which approximates the dynamics of a higher-order system through a combination of linearly growing or decaying modes.
In this paper, we focus on the application of the spectral form of POD, which is called spectral proper orthogonal decomposition (SPOD). This method is derived from the space–time formulation of POD for statistically stationary flow. The resulting modes, which oscillate at a single frequency, are orthogonal under a space–time inner product. In general, SPOD combines the advantages of the classical POD and DMD for statistically stationary flows, meanwhile, it provides an improved robustness over these two methods (Towne, Schmidt & Colonius Reference Towne, Schmidt and Colonius2018). Furthermore, this method has been further extended to achieve more features, such as frequency–time (Nekkanti & Schmidt Reference Nekkanti and Schmidt2021) and triadic interaction (Schmidt Reference Schmidt2020) analyses, or better convergence (Blanco et al. Reference Blanco, Martini, Sasaki and Cavalieri2022; Schmidt Reference Schmidt2022) and lower computational cost (Schmidt & Towne Reference Schmidt and Towne2019), and therefore has received increasing interest in identifying coherent turbulent structures that are physically meaningful in various flow problems. These applications include jet (Schmidt et al. Reference Schmidt, Towne, Rigas, Colonius and Brès2018), pipe flow (Abreu et al. Reference Abreu, Cavalieri, Schlatter, Vinuesa and Henningson2020), flow around airfoils (Abreu et al. Reference Abreu, Tanarro, Cavalieri, Schlatter, Vinuesa, Hanifi and Henningson2021), disk wake (Nidhan, Schmidt & Sarkar Reference Nidhan, Schmidt and Sarkar2022) and various industrial flows (Haffner et al. Reference Haffner, Borée, Spohn and Castelain2020; He et al. Reference He, Fang, Rigas and Vahdati2021b; Li et al. Reference Li, Chen, Liang, Liu and Xiong2021a; Wang, He & Yan Reference Wang, He and Yan2022b).
Considering vehicle wake flow, coherent structures represented by empirical modes are within the research scope of several studies listed above (Grandemange et al. Reference Grandemange, Gohlke and Cadot2013; Haffner et al. Reference Haffner, Borée, Spohn and Castelain2020; He et al. Reference He, Minelli, Wang, Dong, Gao and Krajnović2021a; Li et al. Reference Li, Chen, Liang, Liu and Xiong2021a). However, these applications are limited to two-dimensional planes in the wake, which do not fully capture the complex three-dimensional space–time coherent structures in the flow. Therefore, this study further extends the previous results shown in Li et al. (Reference Li, Chen, Liang, Liu and Xiong2021a), where a parameter study using a two-dimensional database from train wake flow is performed, to find coherent structures from a global perspective. However, although SPOD extracts modes related to the dominant fluctuation of the flow, this method is purely data driven and model free. As such, it does not reveal the mechanisms driving the coherent structures. However, it includes all nonlinear dynamics and may reveal interactions between the structures in a quantitative manner. To further search for the instability mechanisms, one may use either stochastic low-order dynamic models (Rigas et al. Reference Rigas, Morgans, Brackston and Morrison2015; Sieber, Paschereit & Oberleithner Reference Sieber, Paschereit and Oberleithner2021) or a mean field stability analysis.
Mean field linear stability analysis is considered to provide further insight into the mechanisms driving the flow dynamics. It is known that a self-excited oscillation can be described by an unstable global mode (Chomaz Reference Chomaz2005) derived from a global stability analysis. Recently, improved feasibility of large-scale linear algebra computations enabled tri-global stability analysis of flows with three inhomogeneous directions (Theofilis Reference Theofilis2011). Some applications include boundary layer flows with isolated roughness elements (Loiseau et al. Reference Loiseau, Robinet, Cherubini and Leriche2014; Kurz & Kloker Reference Kurz and Kloker2016; Ma & Mahesh Reference Ma and Mahesh2022), lid-driven cavity flows (Gómez, Gómez & Theofilis Reference Gómez, Gómez and Theofilis2014; Paredes Reference Paredes2014), jets in cross-flow (Regan & Mahesh Reference Regan and Mahesh2017) and wakes of rectangular prisms (Zampogna & Boujo Reference Zampogna and Boujo2023). When mean flows display homogeneity in the direction normal to convective motion, the bi-global stability approach can be utilized. This approach considers two-dimensional modes with a spatial wavenumber in the third dimension, and has been applied to a broad range of canonical flow (Theofilis Reference Theofilis2003, Reference Theofilis2011), as well as complex technical flows including swirling flows (Kaiser, Poinsot & Oberleithner Reference Kaiser, Poinsot and Oberleithner2018; Müller et al. Reference Müller, Lückoff, Paredes, Theofilis and Oberleithner2020), reacting flows (Casel et al. Reference Casel, Oberleithner, Zhang, Zirwes, Bockhorn, Trimis and Kaiser2022; Wang, Lesshafft & Oberleithner Reference Wang, Lesshafft and Oberleithner2022a), turbo-machinery flows (Müller et al. Reference Müller, Lückoff, Kaiser and Oberleithner2022) and two-phase flows (Schmidt & Oberleithner Reference Schmidt and Oberleithner2023). For flows that are weakly non-parallel, evolving slowly in the streamwise direction, the bi- and tri-global stability can be approximated from a local stability analysis (LSA), i.e. local one-dimensional analysis in the lines normal to the streamwise direction to construct bi-global instability. As reviewed by Huerre & Monkewitz (Reference Huerre and Monkewitz1990), the method is based on a spatio-temporal analysis of the local velocity profile invoking the Wentzel-Kramers-Brillouin-Jeffreys (WKBJ) approximation. The relationship between local absolute instability and global modes can be found in Monkewitz, Huerre & Chomaz (Reference Monkewitz, Huerre and Chomaz1993) and Chomaz (Reference Chomaz2005), who concluded that a region of local absolute instability is a necessary condition for the existence of global instability. Comparisons between results of local and global stability analyses can be found in Giannetti & Luchini (Reference Giannetti and Luchini2007), Juniper, Tammisola & Lundell (Reference Juniper, Tammisola and Lundell2011), Juniper & Pier (Reference Juniper and Pier2015), Kaiser et al. (Reference Kaiser, Poinsot and Oberleithner2018) and Demange et al. (Reference Demange, Qadri, Juniper and Pinna2022). In general, local stability analyses require less computational memory than global stability analyses, since they convert a large matrix eigenvalue problem into several small independent matrix eigenvalue problems (Juniper & Pier Reference Juniper and Pier2015). Meanwhile, as the local linearized Navier–Stokes (LNS) equation is solved at each discrete streamwise position, the eigenvalues can be continuously tracked to provide an accurate spatial description of the mode. Therefore, local stability analysis is still widely used for flows beyond the range of global analysis (Pier Reference Pier2008; Oberleithner et al. Reference Oberleithner, Sieber, Nayeri, Paschereit, Petz, Hege, Noack and Wygnanski2011; Rukes et al. Reference Rukes, Sieber, Paschereit and Oberleithner2016).
To the best of the authors’ knowledge, there are limited studies regarding the linear instability mechanisms of fully developed turbulent wake flows behind vehicles. Zampogna & Boujo (Reference Zampogna and Boujo2023) investigated the global stability of rectangular prisms with rounded front edges, which approximate the geometry of the Ahmed body. However, this study considered a laminar flow without a ground effect, such that the problem could be treated with two symmetries. From a more practical perspective, flows behind high-speed trains may consist of a series of vortex structures that are subject only to a spanwise symmetry condition. In addition, the spatial and temporal evolution of these vortex structures differs greatly from free-evolving structures due to the presence of the ground (Schetz Reference Schetz2001). Up to now, the instability mechanisms in typical vehicle wakes of high industrial relevance remain an unanswered question. Is there a linear global mode that drives the instability in the turbulent wake? How does the linear global mode compare with the leading SPOD mode? Which part of the wake serves as the origin of the global instability and is most sensitive to external forcing? These questions need to be answered to serve as a basis for further optimizations, while extending the applications of these two approaches to more complex flow problems and higher  $\textit{Re}$.
Since the flow problem considered is only subject to spanwise symmetry, tri-global stability with three inhomogeneous directions should be considered. The WKBJ approximation then converts the three-dimensional linearized problem into several two-dimensional local problems to account for global instability. This is generally a more complex situation than the research shown in Juniper & Pier (Reference Juniper and Pier2015), Rukes et al. (Reference Rukes, Sieber, Paschereit and Oberleithner2016) and Kaiser et al. (Reference Kaiser, Poinsot and Oberleithner2018), where local one-dimensional analyses are used to construct the bi-global mode. Meanwhile, the parallelism or weak non-parallelism in a local analysis could be a strong assumption (Chomaz Reference Chomaz2005; Pier Reference Pier2008; Rukes et al. Reference Rukes, Sieber, Paschereit and Oberleithner2016; Puckert & Rist Reference Puckert and Rist2018) in the flow problem considered. How the non-parallelism would affect the results of global instability and how to deal with the non-parallelism in the complex base flow are also important issues to be solved.
The outline of the paper is as follows. The large eddy simulation (LES) set-up used to obtain the three-dimensional flow field around the train is shown in § 2, along with the description of the time-averaged wake-flow structures. In § 3, we use SPOD to extract the dominant empirical modes and provide a first insight into the spatio-temporal characteristic of the coherent structures. Meanwhile, bispectral mode decomposition is considered to compute triadic interactions, which explains the features in the SPOD spectrum. The tri-global stability mode obtained from two-dimensional local stability analysis is presented in § 4. In § 5, we compare the SPOD mode with the linear global mode at each streamwise location, and the mechanism of the fundamental instability is interpreted based on the comparison results. The main findings and conclusions are summarized in § 6.
2. Flow problem description
2.1. Large eddy simulation
The database for both the data-driven and the theoretical mode calculations is obtained from a large eddy simulation performed with the commercial code STAR-CCM+ 14.02. A complete description of the numerical set-up can be found in Li et al. (Reference Li, Liang, Wang, Xiong, Chen, Yu and Chen2021b), here, only the essential information is presented.
A simplified version of the Intercity-Express 2, also known as the aerodynamic train model, is considered. The simulation is carried out on the scale of  $1:10$, resulting in a height of the model of
 $H=0.36\,{\rm m}$, width of the model of
 $W=0.30\,{\rm m}$ and length of the model of
 $L=2.5\,{\rm m}$, as shown in figure 1(a). To simulate the relative motion between the train and the surrounding environment, the upstream boundary, located 10
 $H$ from the train head, is assigned the inflow velocity
 $U_\infty =4\,{\rm m}\,{\rm s}^{-1}$. Meanwhile, the ground boundary, with a distance to the train bottom surface of 0.15
 $H$, is defined with the same moving velocity. The resulting
 $\textit{Re}$ based on the height of the train and
 $U_\infty$ is
 $9.5\times 10^4$. The downstream boundary is located 30
 $H$ from the train tail, with a zero static pressure outlet condition. On the side and roof of the computational domain, the symmetry plane boundary condition is assigned, with a distance of 10
 $H$ from the train model. The coordinate system is shown in figure 1(a), with the origin located at the ground height of the train tail nose tip. The computational domain is then discretized using unstructured hexahedral volume meshes, with the wall-normal and wall-parallel distances expressed in viscous units, respectively,
 ${\Delta }y^+=0.16$ and
 ${\Delta }x^+={\Delta }z^+=28$ for cells attached to the train surface, as shown in figure 1(b). The total number of volume meshes used in the study is 46.8 million.
Large eddy simulation set-up. Reproduced from Li et al. (Reference Li, Liang, Wang, Xiong, Chen, Yu and Chen2021b). (a) Geometric model. (b) Distribution of computational grid. (c) Instantaneous snapshot of vortex structures; the arrow shows the flow direction.

In the current research, the large eddy simulation based on the wall-adapting local-eddy viscosity (WALE) subgrid-scale model is chosen. The use of a novel form of the velocity gradient tensor in the WALE subgrid-scale model allows for much more universal model coefficients compared with other widely used subgrid-scale models. Meanwhile, the WALE subgrid-scale model does not require any form of near-wall damping but automatically provides accurate scaling at the walls. More details about the WALE subgrid-scale model can be found in Nicoud & Ducros (Reference Nicoud and Ducros1999). An implicit unsteady segregated incompressible finite-volume solver is used, with the convective terms discretized based on a bounded central-differencing scheme, and the diffusion and turbulence terms discretized with the second-order upstream scheme. The time marching procedure is performed using the implicit second-order accurate three-time level scheme, with the discretized convective time step set to  $0.0067t^*$ (
 $t^*=W/U_\infty$), which leads to a Courant–Friedrichs–Lewy number below unity in most of the computational grids. An instantaneous scene of the flow structures around the generic high-speed train, which briefly illustrates the formation of the turbulent wake, is shown in figure 1(c). Note that the LES results have been validated in Li et al. (Reference Li, Liang, Wang, Xiong, Chen, Yu and Chen2021b), where the simulated pressure coefficients are compared with experimental results. Here, to further enhance the confidence of the results presented in the paper, the LES data are further validated by a wind tunnel experiment, in terms of both the time-averaged flow velocity and turbulent statistics. The detailed comparisons are shown in Appendix A.
We started to collect the field data after the simulation had been run for  $50t^*$. It can be seen from the time-history curves of global quantities shown in figure 2 that the flow has already reached the statistically stationary state at this moment. Then, the three-dimensional snapshot database was continuously collected from a square box extending from
 $x/W=-1.33$ upstream of the tail nose tip to
 $x/W=6.67$ downstream of the tail nose tip,
 $y/W=1.33$ from the centre plane of the train in both spanwise directions, and
 $z/W=1.33$ from the ground in the vertical direction, for the duration of
 $800t^*$. The time step between two consecutive snapshots is
 $0.1t^*$, resulting in a total of 8000 snapshots collected during the simulation. These values have been shown to be sufficient to produce well-converged SPOD results according to the parametric study shown in Li et al. (Reference Li, Chen, Liang, Liu and Xiong2021a).
Time histories of the aerodynamic force coefficients. (a) Drag force. (b) Lift force.

2.2. Mean flow properties
We consider the time-averaged field as the base state for the linear stability analysis and introduce it in this section. Furthermore, prior knowledge of the mean field will facilitate understanding of the physics associated with the extracted coherent structures. In figure 3(a), the time-averaged sectional streamlines in the wake are shown at several representative locations. Meanwhile, vortex regions in the wake are identified by the isosurface of  $\varOmega$ (Liu et al. Reference Liu, Wang, Yang and Duan2016), coloured by the magnitude of the vorticity. The
 $\varOmega$-method works as a vortex identification criterion similar to the
 $Q$-criterion (Chong, Perry & Cantwell Reference Chong, Perry and Cantwell1990) and
 ${\lambda }_2$-criterion (Jeong & Hussain Reference Jeong and Hussain1995), however, it is less sensitive to threshold value to capture both strong and weak vortices in different cases. Note that the wake flow is symmetric about the central plane after long-term time averaging, so only the
 $y>0$ half is shown here for better visualization. In figure 3(b), to provide with more quantitative information, the time-averaged pressure coefficient and streamwise skin-friction coefficient along the central line of the train (also shown in this figure) are plotted. The
 $x$-axis is denoted by the distance from the starting point along the tail central line in the clockwise direction. The regions with negative streamwise skin-friction coefficients indicative of flow recirculation are highlighted with green patches.
Time-averaged mean flow distributions. (a) Flow structures around the train tail visualized by isosurface of vortex identification criterion  $\varOmega =0.6$ and streamlines; the arrow shows the flow direction. (b) Distributions of pressure coefficient and streamwise skin-friction coefficient along the central line of the train tail in the clockwise direction; the greed patches highlight the regions with negative skin-friction coefficients.

The distribution of the time-averaged flow along the symmetry plane is illustrated first. It can be observed that, as the flow approaches the slanted surface of the tail, the adverse pressure gradient imposed by local flow acceleration forces the attached flow to separate from the surface at point  $a$ (see figure 3b). However, the flow separated from point
 $a$ is highly deformed and fails to form a strong vortex region, since in figure 3(a), no obvious structure is identified at this location by the isosurface of
 $\varOmega$. Then, in figure 3(b), the re-attachment can be identified at point
 $b$, downstream of which the attached flow on the slanted surfaces gradually approaches the rear end. Further downstream, the strong adverse pressure near the tail nose point forces the attached flow on the slanted and bottom surfaces to respectively separate at point
 $c$ and point
 $d$, forming the spanwise vortex pair located just behind the tail nose point, as identified in figure 3(a).
In addition to the flow structures related to the separation across the symmetry plane, we can also observe in figure 3(a) that a pair of longitudinal vortices is located above the side edges of the tail, which is similar in nature to the C-pillar vortex in the Ahmed body wake flow (Zhang et al. Reference Zhang, Zhou and To2015; He et al. Reference He, Minelli, Wang, Dong, Gao and Krajnović2021a; Liu et al. Reference Liu, Zhang, Zhang and Zhou2021; Li et al. Reference Li, Cui, Jia, Li, Yang, Morzyński and Noack2022). This pair of longitudinal vortices is formed by flow separation from the side surface, which exerts a strong pressure-suction effect in this area and continuously rolls up flow from the slanted surface. As the longitudinal vortex propagates downstream, it gradually increases in diameter and lifts away from the tail surface toward the ground. Due to the strong downwash from the slanted surface, the trailing vortex is pushed away from the central symmetry plane as it travels downstream. From  $x/W\approx 1.5$ onward, the longitudinal vortex structure attaches to the ground and then propagates nearly parallel to the ground in the downstream wake.
In general, the mean field is fully three-dimensional in the near-wake region, and its complexity gradually decreases downstream of the solid body, developing to be nearly parallel downstream of  $x/W\approx 2.0$. The two main features, the spanwise recirculation bubble and the streamwise vortex pair, are likely to be related to the mean field instability due to the strong velocity gradient and will therefore be discussed further in the following content.
3. Data-driven coherent structure identification
3.1. Spectral proper orthogonal decomposition
The SPOD approach is the frequency-domain counterpart of the standard POD approach. It seeks modes that optimally represent space–time flow statistics (Schmidt et al. Reference Schmidt, Towne, Rigas, Colonius and Brès2018; Towne et al. Reference Towne, Schmidt and Colonius2018). A brief overview of this method is provided in this part.
We denote the mean subtracted snapshots as
 \begin{equation} \boldsymbol{q}'_i=\boldsymbol{q}'(t_i)=\begin{bmatrix} u'(x,y,z,t_i) \\ v'(x,y,z,t_i) \\ w'(x,y,z,t_i) \\ p'(x,y,z,t_i)\end{bmatrix}, \end{equation}
where  $i$ represents the number of snapshots, u, v, w and p are the normalized velocity components and pressure. To estimate the spectral contents using discrete Fourier transform (DFT), the snapshot database is first segmented into
 $n_{{blk}}$ overlapping blocks, with
 $n_{{DFT}}$ snapshots in each individual block. Here,
 $n_{{DFT}}=256$, along with an overlap of
 $50\,\%$, is used in our study, and the resulting angular frequency resolution is
 $\Delta \omega =0.245$ (
 $\omega$ is the angular frequency normalized by the factor of
 $U_{\infty }/W$). With the above parameters,
 $n_{{blk}}$ can be determined with the value of 61, which is sufficient for well-converged SPOD energy spectra and modes (Schmidt & Colonius Reference Schmidt and Colonius2020). The blocks are then Fourier transformed, and all Fourier realizations at the
 $k$th frequency are collected into a new data matrix
 \begin{equation} \boldsymbol{\hat{Q}}_k=\begin{bmatrix} \boldsymbol{\hat{q}}^{(1)}_k & \ \boldsymbol{\hat{q}}^{(2)}_k & \cdots & \boldsymbol{\hat{q}}^{(n_{{blk}})}_k \end{bmatrix}. \end{equation}
At this point, the orthogonal basis can be obtained by solving the eigenvalue problem defined by
 \begin{equation}
\left(\boldsymbol{\hat{Q}}_{k}^H\boldsymbol{W}{\boldsymbol{\hat{Q}}_k}\right)
/
n_{{blk}}=\boldsymbol{U}_k\boldsymbol{\varLambda}_k\boldsymbol{U}_k^H,
\end{equation}
where  $\boldsymbol{\varLambda}_k$ and
 $\boldsymbol{U}_k$ are respectively the eigenvalue and eigenvector of this problem, and
 $\boldsymbol {W}$ is the diagonal matrix containing weight information of each flow quantity at each sampling node. Therefore, the weight matrix
 $\boldsymbol{W}$ defines the energy norm used in SPOD, thus determining the physical process to be highlighted (Colonius et al. Reference Colonius, Rowley, Freund and Murray2002). Here, the weight matrix is given as
 \begin{equation} \boldsymbol{W}=\int_{\varOmega}\begin{bmatrix} 1 & & & \\ & 1 & & \\ & & 1 & \\ & & & 0 \end{bmatrix}\,{{\rm d}}V \end{equation}
so that the turbulent kinetic energy (TKE) norm can be defined. The matrices  $\boldsymbol {\varLambda }_k={\rm {diag}}(\lambda _{k_1},\lambda _{k_2},\ldots,\lambda _{k_{n_{blk}}},)$ contain the SPOD energies which are therefore based only on the TKE. Then both the velocity modes, as well as the associated pressure modes, can be recovered by
 \begin{equation} \boldsymbol{\varPhi}_k=\frac{1}{\sqrt{n_{{blk}}}}\boldsymbol{\hat{Q}}_k\boldsymbol{U}_k\boldsymbol{\varLambda}_k^{{-}1/2}. \end{equation}
In addition, since the described flow problem is subjected to the spanwise symmetry, fluctuations of the sampled flow field can be divided into symmetric and antisymmetric contributions (Hack & Schmidt Reference Hack and Schmidt2021). To properly isolate coherent structures defined by the two different types of fluctuations, an additive decomposition was applied to the collected snapshot data before extracting empirical modes. The symmetric contribution of the  $i$th snapshot is defined as
 \begin{equation} \boldsymbol{q}'_S(t_i)=\frac{1}{2}\begin{bmatrix} u'(x,y,z,t_i)+u'(x,-y,z,t_i) \\ v'(x,y,z,t_i)-v'(x,-y,z,t_i) \\ w'(x,y,z,t_i)+w'(x,-y,z,t_i) \\ p'(x,y,z,t_i)+p'(x,-y,z,t_i) \end{bmatrix} \end{equation}
and the antisymmetric contributions is defined as
 \begin{equation} \boldsymbol{q}'_A(t_i)=\frac{1}{2}\begin{bmatrix} u'(x,y,z,t_i)-u'(x,-y,z,t_i) \\ v'(x,y,z,t_i)+v'(x,-y,z,t_i) \\ w'(x,y,z,t_i)-w'(x,-y,z,t_i) \\ p'(x,y,z,t_i)-p'(x,-y,z,t_i) \end{bmatrix} \end{equation}
A visualization of one snapshot of the fluctuating streamwise velocity field, together with the contributions from the symmetric and antisymmetric components, is shown in figure 4. The spanwise symmetrical and anti-symmetrical contributions of all collected samples are arranged into two separate data matrices. They are then independently solved following the procedures described above, to extract and analyse, respectively, the symmetric and antisymmetric empirical modes. Note that, due to the zero-integral property of an even and an odd function in the sampling domain, the symmetric and antisymmetric modes yield mutual orthogonality (Hack & Schmidt Reference Hack and Schmidt2021).
Symmetric and antisymmetric decomposition of a single snapshot. (a) Original field. (b) Symmetric component. (c) Antisymmetric component.

3.2. Spectral proper orthogonal decomposition energy spectra and modes
Spectral proper orthogonal decomposition solves the eigenvalue problems at each discrete frequency independently, and produces energy-ranked eigenvalues. Therefore, the energy distributions of different modes at each frequency can be best visualized in the form of a spectrum (Schmidt et al. Reference Schmidt, Towne, Rigas, Colonius and Brès2018). Figure 5(a,c) shows SPOD spectra for both symmetric and antisymmetric components. Meanwhile, the cumulative energy content and the percentage of energy accounted for by each mode as a function of frequency are shown in the right column. The symmetric component displays a higher overall energy level compared with the antisymmetric component, indicating its dominant role in the dynamics of the turbulent wake. The low-rank behaviour, characterized by a large separation between the first and second modes, also appears to be more pronounced in the symmetric component. In particular, in the angular frequency range of  $2<\omega <4$ of the symmetric component, the first modes contribute more than
 $50\,\%$ of the fluctuating energy according to figure 5(b). The angular frequency of the dominant symmetric coherent structure is
 $\omega =3.437$, as shown in figure 5(a). The corresponding Strouhal number is
 $St=0.547$, based on the free-stream velocity
 $U_{\infty }$ and the train width
 $W$. Additionally, the spectral energy concentration at
 $\omega \approx 6.9$, and a less pronounced peak around
 $\omega \approx 1.7$, can be identified respectively. These two angular frequencies could be associated with the first harmonic and subharmonic of the fundamental mode. This will be further investigated by checking the mode bi-spectrum in § 3.3.
Spectral proper orthogonal decomposition mode energy spectrum. Panels (a,c) show the spectral curves with the shading of the line colour representing the increase in the mode number. Panels (b,d) show the percentage of energy that each mode accounts for as a function of frequency, with solid lines indicating that the cumulative energy represents  $50\,\%$ and
 $90\,\%$ of the total energy at each frequency. (a,b) Symmetric component. (c,d) Antisymmetric component.

In figure 6, the spatial distributions of the leading symmetric SPOD modes at  $\omega =3.437$,
 $\omega =1.718$ and
 $\omega =6.874$ are visualized based on the isosurfaces of the streamwise velocity components. A common feature of these modes is that they all behave very differently between the near- and far-wake regions, due to the complexity of the mean flow. For the leading SPOD mode at
 $\omega =3.437$, coherent vortex shedding is observed from the recirculation region just behind the train tail. The generated coherent structures move downstream and gradually approach the bottom boundary due to effect of the moving ground (Wang et al. Reference Wang, Minelli, Cafiero, Iuso, He, Basara, Gao and Krajnović2023). Once fully attached, they vanish and separate at the symmetry plane to evolve into far-wake coherent structures with nearly constant streamwise wavelength. For the leading mode at
 $\omega =1.718$, both alternate shedding of the spanwise vortex and co-shedding from the side surfaces are observed in the near wake. Similar to the most dominant SPOD mode, these structures slowly evolve into streamwise wavepackets when propagating to the far wake. Then, for the leading mode at
 $\omega =6.874$, no obvious structures can be identified in the near wake, and the far wake is mainly dominated by tilted wavepackets.
Spatial distributions of the leading symmetric SPOD modes visualized based on isosurface of the streamwise velocity components; (a)  $\omega =3.437$, (b)
 $\omega =1.718$, (c)
 $\omega =6.874$.

Another important observation is that, with the increase of the frequency from  $\omega =1.718$ to
 $\omega =6.874$, the spatial scales of the coherent structures gradually decrease. This phenomenon is more pronounced in the far wake, where the mean flow is nearly parallel and the coherent structures at different frequencies are all characterized by nearly constant streamwise wavenumbers. In particular, the streamwise wavelengths of the far-wake coherent structures at
 $\omega =1.718$ and
 $\omega =6.874$ can be observed to be approximately twice and half that of the most dominant SPOD mode, respectively. This phenomenon indicates a linear dispersion relation of the wake flow, which will be further discussed and confirmed in the following content.
To better quantify the frequency–wavenumber characteristics, a streamwise Fourier transform is applied to the streamwise velocity component of the SPOD modes, to convert the signal into the domain of streamwise wavenumber  $\alpha$ (normalized by a factor of
 $1/W$). Due to the dominant role of the symmetric perturbation in the wake, only symmetric modes are considered. First, the power spectral density (PSD) of the streamwise velocity component of the leading mode is averaged along the
 $z$-axis following the expression
 \begin{equation} \bar{P}_1(\alpha,\omega,y)=\frac{\int_{z_{{min}}}^{z_{{max}}} \left|\hat{\varPhi}_u(\alpha,\omega,y,z)\right|\,{{\rm d}}z}{z_{{max}}-z_{{min}}}, \end{equation}
where  $\hat {\varPhi }_u$ denotes the streamwise Fourier transform of the streamwise velocity mode, and
 $0\leq {z/W}\leq 1.3$. Meanwhile, we isolate the mechanism in near-wake and far-wake regions by using two different spatial window functions (Schmidt et al. Reference Schmidt, Towne, Rigas, Colonius and Brès2018) that constrain the signal to
 $0< x/W<1$ and
 $1< x/W<6.67$ when the Fourier transform is performed. The results of
 $\bar {P}_1$ at
 $\omega =3.437$ using the two different window functions are then shown in figures 7(a) and 7(b), respectively. In the near-wake region, the maximum PSD is located in the symmetric plane, with
 $\alpha \approx 8$. We can also observe that the high PSD value occurs over a wide range of
 $\alpha$, which can be attributed to the growth of the wavelength of the spanwise vortex shedding mode. Note that the non-zero values along
 $\alpha =0$ in figure 7(a) are due to spectral leakage in the discrete Fourier transform. In the far-wake region, the coherent structure has a nearly constant streamwise wavenumber, with the maximum PSD located away from the symmetry plane. This is consistent with what is shown in figure 6.
Streamwise wavenumbers of the SPOD modes: (a)  $0< x/W<1$ at
 $\omega =3.437$; (b)
 $1< x/W<6.67$ at
 $\omega =3.437$; (c) Angular frequency–streamwise wavenumber diagram.

Then for the first SPOD modes at all discrete frequency points, a window function including both near wake and far wake is used to compute  $\bar {P}_1$, followed by averaging along the
 $y$-axis, which can be expressed as
 \begin{equation} \bar{P}_2(\alpha,\omega)=\frac{\int_{y_{{min}}}^{y_{{max}}}\bar{P}_1(\alpha,\omega,y)\,{{\rm d}}y}{y_{{max}}-y_{{min}}}, \end{equation}
with  $0\leq {y/W}\leq 1.2$, to construct the frequency–wavenumber diagram shown in figure 7(c). In general, a constant phase velocity of 0.83 can be observed for perturbation waves of all discrete frequencies considered in the research, which confirms the linear dispersion relation of the wake. This value lies between the convective velocity of the streamwise vortex and the outer free stream. Such a phase velocity is typical of the Kelvin–Helmholtz convective instability found in free-shear flow (Schmidt et al. Reference Schmidt, Towne, Rigas, Colonius and Brès2018). Since the frequency–wavenumber diagram includes both near-wake and far-wake instability waves, the phase velocity tends to decrease at frequencies with a pronounced low rank due to the near-wake mode.
3.3. Triadic interactions
The dynamic behaviour of a nonlinear flow system is significantly influenced by resonance phenomena driven by different mechanisms (Tang et al. Reference Tang, Cheng, Tong, Lu and Zhao2017). Triadic resonance, resulting from the quadratic nonlinearity of the Navier–Stokes equations, can play an important role in the energy transfer process in turbulent wake flows. Through this mechanism, coherent structures associated with the tonal components of vortex shedding can triadically interact with themselves as well as the background turbulence. As a consequence, the energy of the limit-cycle oscillation saturated from a fixed point supercritical bifurcation (Sipp & Lebedev Reference Sipp and Lebedev2007) is redistributed over different scales. Therefore, turbulent wake flows often exhibit a mixed tonal–broadband dynamics, comprising an underlying broadband spectrum and tonal components associated with vortex shedding. The broadband coherent dynamics with several identifiable peaks in the SPOD power spectrum shown in figure 5 indicates such behaviour, and is therefore further discussed in this section.
Bispectral mode decomposition (BMD) (Schmidt Reference Schmidt2020) detects triadic interactions by their characteristic phase coupling between two spectral components at frequencies  $\omega _1$ and
 $\omega _2$, and a third frequency at
 $\omega _3$, obeying the resonance condition
 $\omega _1\pm \omega _2\pm \omega _3=0$. Bispectral mode decomposition extends classical bispectral analysis to multidimensional data, thereby simultaneously facilitating the detection of nonlinear triadic interactions from the complex mode bispectrum
 $\lambda _1(\omega _1,\omega _2)$, as well as the identification of the associated coherent flow structures as bispectral modes. For details on the derivation and implementation, the reader is referred to Schmidt (Reference Schmidt2020).
The mode bispectrum is then computed using the same spectral estimation parameters as in the SPOD of § 3.1. Since the flow is subject to the spanwise symmetry, triadic interactions can be further categorized into three different types: self-interaction of the symmetric component, self-interaction of the antisymmetric component and interaction between the symmetric and the antisymmetric components. Note that the third frequency component resulting from the self-interactions of both the symmetric and the antisymmetric components is symmetric, while the third frequency component resulting from the mutual interaction of symmetric and antisymmetric components is antisymmetric. Here, we confirm that the mode bispectra of the triadic interaction between the symmetric and antisymmetric components are overall lower in intensity and cannot be identified with distinguishable peaks, therefore will not be further discussed.
Hence, in figure 8, only the mode bispectra of the symmetric and antisymmetric self-interactions are presented. Consistent with the SPOD spectra, the mode bispectra also appear to be broadband. Here, the self-interaction of the symmetric component shown in figure 8(a) is identified with several distinct peaks. We refer to  $\omega _f$ as the fundamental frequency detected in SPOD. Conceptually, the triplet
 $(\omega _f,0,\omega _f)$ on the mode bispectrum can be regarded as the coherent perturbation driven by the mean flow. However, due to the finite sampling frequency, the zero-frequency bin contains unresolved low-frequency components. In this case, the mode bispectrum on the
 $\omega _1$-axis should not be interpreted (Nekkanti et al. Reference Nekkanti, Maia, Jordan, Heidt, Colonius and Schmidt2022). A local maximum of the distribution can be found that corresponds to the sum interaction of the fundamental mode with itself, generating the first harmonic at twice the fundamental frequency via the triad
 $(\omega _f,\omega _f,\omega _{2f})$. At the same time, the doublets
 $(\omega _{2f},-\omega _f)$ and
 $(\omega _{({1}/{2})f},\omega _{({1}/{2})f})$, which include the first harmonic and subharmonic, respectively, interact with
 $\omega _f$. The triad
 $(\omega _f,-\omega _{({1}/{2})f},\omega _{({1}/{2})f})$, analogously, indicates an interaction with the subharmonic frequency. The mean field distortion, indicated by the peak values along line
 $\omega _1=-\omega _2$, can be identified over a wide frequency range. Meanwhile, in figure 8(b), a weak triad at
 $(\omega _{({1}/{2})f},\omega _{({1}/{2})f})$ can be identified, representing the sum self-interaction of the antisymmetric subharmonic contributing to the fundamental frequency in the symmetric component.
Mode bispectra of triadic interactions in both the sum and difference regions. (a) Self-interaction of the symmetric component. (b) Self-interaction of the antisymmetric component.

Selected dynamically relevant bispectral modes are shown in figure 9. Rows in this figure represent the constant third frequencies of  $\omega _3=\omega _{({1}/{2})f}$,
 $\omega _3=\omega _{f}$ and
 $\omega _3=\omega _{2f}$. An important observation is that the modes along the diagonals are similar in shape, and resemble the SPOD modes at corresponding frequencies, as shown in figure 6. This confirms that the spatial structures involved in or generated by nonlinear triadic interactions with strong phase correlations are also the most energetic coherent structures (Nekkanti et al. Reference Nekkanti, Nidhan, Schmidt and Sarkar2023). The analysis confirms the expected nonlinear dynamics that is characterized by a fundamental vortex shedding frequency and different interactions of the fundamental mode at
 $(\omega _f,0,\omega _f)$ and its sub- and super-harmonics, including the mean flow distortion. Also apparent and consistent with the SPOD analysis, the train wake behaves stochastically, with the uncertainty of the fundamental frequency
 $\omega _f$ leading to broad spectral and bispectral peaks. Nonetheless, the continuous evolution and phase coupling of these structures results in the low-rank behaviour observed over a wide range of frequencies, as shown in figure 5. In addition to shedding light on the different nonlinear interactions that cumulatively lead to peaks in the SPOD energy spectra, the BMD analysis also reveals the self-interaction of the antisymmetric component at the subharmonic frequency in the mode bispectrum in figure 8(b) that couples the antisymmetric to the symmetric component.
Spatial distribution of the bispectral modes resulting from significant triads, visualized based on isosurface of the streamwise velocity component. (a) Self-interaction of the symmetric component. (b) Self-interaction of the antisymmetric component.

4. Physics-based coherent structure modelling
Linear global stability analysis is conducted to identify the mechanisms that drive the dominant coherent structure identified in the SPOD. In this work, instead of directly solving the three-dimensional stability equation, we conduct a two-dimensional local analysis to obtain more local information meanwhile reducing computational resource. In this manner, the flow is assumed to be weakly non-parallel in the streamwise direction. Then the full three-dimensional matrix eigenvalue problem is replaced by several local independent matrix problems, each based on the two-dimensional cross-flow planes at different streamwise locations. To determine the global mode, the concept of local convective/absolute instability is applied within the WKBJ approximation (Huerre & Monkewitz Reference Huerre and Monkewitz1990). To be clear, the approach used in the research does not conceptually correspond to the bi-global analysis (Theofilis Reference Theofilis2011), but is similar to the approach used in Huerre & Monkewitz (Reference Huerre and Monkewitz1990), Monkewitz et al. (Reference Monkewitz, Huerre and Chomaz1993) and Juniper, Hanifi & Theofilis (Reference Juniper, Hanifi and Theofilis2014), in which the bi-global stability is approximated using one-dimensional local analysis.
4.1. Linearized operator and treatment of the non-parallel flow
Coherent structures can be described by the triple decomposition (Reynolds & Hussain Reference Reynolds and Hussain1972), which leads to a further decomposition of the fluctuating component into coherent and stochastic parts as
 \begin{equation} \boldsymbol{q}'(\boldsymbol{x},t)=\boldsymbol{\tilde{q}}(\boldsymbol{x},t)+\boldsymbol{q}''(\boldsymbol{x},t), \end{equation}
where  $\boldsymbol {\tilde {q}}(\boldsymbol {x},t)$ is the coherent fluctuation part and
 $\boldsymbol {q}''(\boldsymbol {x},t)$ is the stochastic fluctuation part. This decomposition is substituted into both the momentum and continuity equations, and both are time averaged and phase averaged. Then, by subtracting the time-averaged set of equations from the phase-averaged set of equations, the equations governing the evolution of coherent structures can be written (Reynolds & Hussain Reference Reynolds and Hussain1972)
 \begin{gather} \frac{\partial{\boldsymbol{\tilde{u}}}}{\partial{t}}+(\boldsymbol{\tilde{u}}\boldsymbol{\cdot}\boldsymbol{\nabla})\boldsymbol{\bar{u}}+(\boldsymbol{\bar{u}}\boldsymbol{\cdot}\boldsymbol{\nabla})\boldsymbol{\tilde{u}}={-}\boldsymbol{\nabla}{\tilde{p}}+\boldsymbol{\nabla}\boldsymbol{\cdot}\left(\frac{1}{\textit{Re}}(\boldsymbol{\nabla}+\boldsymbol{\nabla}^{\rm{T}})\boldsymbol{\tilde{u}}\right)-\boldsymbol{\nabla}\boldsymbol{\cdot}\left(\tau_R+\tau_N\right) \end{gather}
 \begin{gather} \boldsymbol{\nabla}\boldsymbol{\cdot}\boldsymbol{\tilde{u}}=0. \end{gather}
Here,  $\tau _N$ describes the quadratic interactions of the coherent perturbation. Considering that the energy contribution from this process is higher order, this term is neglected in the following. The term
 $\tau _R$ is the fluctuation of the stochastic Reynolds stresses related to the stochastic–coherent interaction, which contributes at leading order, according to the energy considerations of Reynolds & Hussain (Reference Reynolds and Hussain1972), and is therefore retained in the equation. However, this term is not known a priori and needs to be properly modelled to close the governing equation. In this paper, we use Boussinesq's eddy viscosity model as the closure. The Reynolds stresses are then expressed as
 \begin{equation} \tau_R={-}\nu_t\left(\boldsymbol{\nabla}+\boldsymbol{\nabla}^{\rm{T}}\right)\boldsymbol{\tilde{u}}. \end{equation}
Here,  $\nu _t$ is the normalized eddy viscosity, which can be calculated using quantities of the LES mean flow. Since this approach yields an eddy viscosity for each independent Reynolds Stress component, a reasonable compromise is to take a value of
 $\nu _t$ that minimizes the mean squared error from the six constitutive relations using
 \begin{equation} \nu_t=\frac{\left\langle-\overline{\boldsymbol{u}'\boldsymbol{u}'}+2/3k\boldsymbol{I},\bar{\boldsymbol{S}}\right\rangle_{{F}}}{2\left\langle\bar{\boldsymbol{S}},\bar{\boldsymbol{S}}\right\rangle_{{F}}}, \end{equation}
with  $\langle {\cdot },{\cdot }\rangle _{{F}}$ denoting the Frobenius inner product,
 $k$ the kinetic energy,
 $\boldsymbol {I}$ the identity matrix and
 $\bar {\boldsymbol {S}}$ the mean shear strain rate tensor. This approach has been widely used in the linear stability analysis of turbulent flows, as presented in Tammisola & Juniper (Reference Tammisola and Juniper2016), Rukes et al. (Reference Rukes, Sieber, Paschereit and Oberleithner2016), Kaiser et al. (Reference Kaiser, Poinsot and Oberleithner2018), Müller et al. (Reference Müller, Lückoff, Paredes, Theofilis and Oberleithner2020) and Kuhn, Soria & Oberleithner (Reference Kuhn, Soria and Oberleithner2021).
The linearized momentum and continuity equations for the coherent perturbation can be obtained as
 \begin{gather} \frac{\partial{\boldsymbol{\tilde{u}}}}{\partial{t}}+(\boldsymbol{\tilde{u}}\boldsymbol{\cdot}\boldsymbol{\nabla})\boldsymbol{\bar{u}}+(\boldsymbol{\bar{u}}\boldsymbol{\cdot}\boldsymbol{\nabla})\boldsymbol{\tilde{u}}={-}\boldsymbol{\nabla}{\tilde{p}}+\boldsymbol{\nabla}\boldsymbol{\cdot}\left(\left(\frac{1}{\textit{Re}}+\nu_t\right)(\boldsymbol{\nabla}+\boldsymbol{\nabla}^{\rm{T}})\boldsymbol{\tilde{u}}\right), \end{gather}
 \begin{gather} \boldsymbol{\nabla}\boldsymbol{\cdot}\boldsymbol{\tilde{u}}=0. \end{gather}
These equations can be then rewritten as
 \begin{equation} \boldsymbol{\mathcal{L}}\boldsymbol{\tilde{q}}=0, \end{equation}
where  $\boldsymbol {\mathcal {L}}$ is the operator of the linearized equations superimposing the spatial discretization and base state (Paredes et al. Reference Paredes, Hermanns, Le Clainche and Theofilis2013).
By assuming that the mean field has much smaller derivatives in the streamwise direction than in the transverse and vertical directions, the system can be Fourier transformed in the streamwise direction, following the streamwise weakly non-parallel flow assumption. The coherent perturbation can be then written as
 \begin{equation} \tilde{q}(x,y,z,t)=\hat{q}(y,z)\exp\left[{\rm{i}}\left(\alpha{x}-\omega{t}\right)\right]+{\rm c.c.}, \end{equation}
where  $\boldsymbol {\hat {q}}$ is the complex eigenfunction,
 $\alpha =\alpha _{{r}}+\rm {i}\alpha _{{i}}$ is the complex streamwise wavenumber,
 $\omega =\omega _{{r}}+\rm {i}\omega _{{i}}$ is the complex angular frequency and c.c. is the complex conjugate. Substituting (4.9) into (4.8) enables stability analysis of the mean field in the cross-flow plane at different streamwise locations. The global stability characteristics can then be recovered based on the concept of absolute/convective instability and the global mode wavemaker (Huerre & Monkewitz Reference Huerre and Monkewitz1990).
However, using the local approach to predict the global mode has been reported to be less accurate than the direct global approach when the base flow is strongly non-parallel (Juniper et al. Reference Juniper, Tammisola and Lundell2011; Juniper & Pier Reference Juniper and Pier2015). In the current case, where a fully developed three-dimensional base flow is considered, the parallel flow assumption is likely to introduce uncertainty into the results. Therefore, in this work, we also make further treatment to approximate the non-parallelism of the three-dimensional base flow.
The parallel flow assumption is checked by visualizing the streamwise component of the leading SPOD mode on a horizontal plane, as shown in figure 10. Here, the coherent perturbations can be observed with clear wavepacket structures; however, they do not travel strictly in the streamwise direction but follow oblique paths in both the near and far wake. This is caused by the downwash flow from the slanted tail surface which gradually separates the wake structures as it propagates downstream, as can be seen in the mean flow structures shown in figure 3.
Two-dimensional slice of the streamwise component of three-dimensional SPOD mode showing the oblique downstream travelling wavepackets. The streamlines are drawn based on the vector field ( $\cos \theta, \sin \theta$) at each computational node.

We intend to account for the obliqueness of the coherent structure in the linear modelling. To do this, the  $x$-dependence of the eigenfunction
 $\boldsymbol {\hat {q}}$ has to be re-considered. Then, for a given location
 $(x_0,y_0,z_0)$, and a streamwise distance
 $\Delta {x}$ small enough, there exists a set of
 $(\Delta {y},\Delta {z})$ so that the eigenfunction fulfils
 \begin{equation} \hat{q}(x_0,y_0,z_0)=\hat{q}(x_0+\Delta{x},y_0+\Delta{y},z_0+\Delta{z}). \end{equation}
This set of  $(\Delta {y},\Delta {z})$ is related to the obliqueness of the travelling coherent structure, and (4.10) can be replaced by
 \begin{equation} \hat{q}(x_0,y_0,z_0)=\hat{q}(x_0+\Delta{x},y_0+\tan\theta\Delta{x},z_0+\tan\gamma\Delta{x}), \end{equation}
where  $\tan \theta$ and
 $\tan \gamma$ respectively represent the convection direction relative to the symmetric plane and the horizontal plane. By applying a first-order Taylor expansion to the right-hand side of (4.11), the left-hand side can be cancelled and the expression can be arranged into
 \begin{equation} \frac{\partial{\boldsymbol{\hat{q}}}}{\partial{x}}+\tan\boldsymbol{\theta}\frac{\partial{\boldsymbol{\hat{q}}}}{\partial{y}}+\tan\boldsymbol{\gamma}\frac{\partial{\boldsymbol{\hat{q}}}}{\partial{z}}=0. \end{equation}
Therefore, an  $x$-derivative applied to the state vector
 $\boldsymbol {\hat {q}}$ is used to account for the oblique travelling direction.
To determine  $\tan \theta$ and
 $\tan \gamma$, we replace
 $\boldsymbol {\hat {q}}$ with mean field quantities
 $\boldsymbol {\bar {q}}$ in (4.12), by assuming that the perturbation waves follow the mean flow convection. Note that, for each node in the computational domain, the four flow variables are used to construct the linear equation system for
 $\tan \theta$ and
 $\tan \gamma$ and the final results are obtained using the least-squares solution of the overdetermined linear equation system.
Finally, the convection direction calculated from the mean field is validated by comparison with the oblique path of the SPOD mode. In figure 10, streamlines based on the calculated local angle  $\theta$ are visualized, by decomposing
 $\tan \theta$ at each computational node into streamwise (
 $\cos \theta$) and transverse (
 $\sin \theta$) components using trigonometric functions. It can be observed that the vector field agrees well with the travelling direction of the SPOD wavepackets. Therefore, this
 $x$-derivative is assumed to be reasonable to account for the obliqueness of the coherent structure in the linear modelling. Note that the results of the stability analysis without the non-parallelism modelling are also computed and presented in Appendix B for comparison.
4.2. Spatio-temporal stability approach
For the linear stability analysis, the linear operator  $\boldsymbol {\mathcal {L}}$ is rearranged to construct the generalized eigenvalue problem. In this work, both the temporal and spatial stability formulation is needed. Therefore, either the temporal stability form
 \begin{equation} \boldsymbol{\mathcal{A}}(x,\alpha)\boldsymbol{\hat{q}}=\omega\boldsymbol{\mathcal{B}}(x)\boldsymbol{\hat{q}}, \end{equation}
or the spatial stability form
 \begin{equation} \boldsymbol{\mathcal{A}}(x,\omega)\boldsymbol{\hat{q}}=\alpha\boldsymbol{\mathcal{B}}(x)\boldsymbol{\hat{q}}, \end{equation}
is constructed.
In the temporal stability form (4.13), the streamwise wavenumber  $\alpha$ is fixed to a real value, and the eigenvalue problem is solved for a complex
 $\omega$, the real part of which is the angular frequency and the imaginary part is the temporal growth/decay rate. On the contrary, in the spatial stability form (4.14), a real angular frequency
 $\omega$ is imposed to search for the complex
 $\alpha$, where the real part corresponds to the streamwise wavenumber, while the imaginary part is the spatial amplification/damping rate. Note that, in the spatial stability equation, quadratic terms appear with respect to
 $\alpha$. This problem is solved using the companion matrix method (Bridges & Morris Reference Bridges and Morris1984), which increases the size of the eigenvalue problem compared with the temporal analysis. The complete expression of the operators
 $\boldsymbol {\mathcal {A}}$ and
 $\boldsymbol {\mathcal {B}}$ for both temporal and spatial analysis can be found in Appendix C.
To determine the global stability of the mean flow from a local analysis, a so-called spatio-temporal analysis using (4.13) must be performed to distinguish between convective and absolute instability (Huerre & Monkewitz Reference Huerre and Monkewitz1990). In this case, both  $\alpha$ and
 $\omega$ are complex valued. Conceptually, the flow is said to be stable if all perturbations decay in time throughout the entire domain after a localized impulse. Convectively unstable flow gives rise to perturbations that grow in time but convect away from the impulse location, so that the perturbations eventually decay to zero at each spatial location in the long-time limit. For an absolutely unstable flow, the perturbations grow both upstream and downstream of the impulse location, contaminating the whole spatial domain in the long-time limit.
Based on the previous definitions, the convective/absolute nature of a local velocity profile can be determined from the time-asymptotic behaviour of the perturbations that remain at the impulse location, that is, for perturbations with zero group velocity:  $\partial \omega /\partial \alpha =0$, which is the definition of a saddle point in the complex
 $\alpha -$plane. Therefore, valid saddle points on the complex
 $\alpha$-plane that satisfy the Briggs–Bers pinch-point criterion (Briggs Reference Briggs1964) must be identified. Therefore, the flow is locally absolutely unstable if the absolute growth rate, given by the imaginary part of
 $\omega$ at the most unstable valid saddle point, is positive. If the absolute growth rate is negative, the flow is convectively unstable or stable (Huerre & Monkewitz Reference Huerre and Monkewitz1990; Rees & Juniper Reference Rees and Juniper2010; Juniper et al. Reference Juniper, Hanifi and Theofilis2014; Rukes et al. Reference Rukes, Sieber, Paschereit and Oberleithner2016; Kaiser et al. Reference Kaiser, Poinsot and Oberleithner2018; Demange, Chazot & Pinna Reference Demange, Chazot and Pinna2020).
In a spatially developing flow, a region of absolute instability is a necessary (but not sufficient) condition for global instability (Monkewitz et al. Reference Monkewitz, Huerre and Chomaz1993; Chomaz Reference Chomaz2005). To further link the local absolute instability to global instability, the absolute growth rate needs to be tracked along the streamwise direction to determine the wavemaker, the location where the global mode is selected. This method has been extensively used for one-dimensional local stability analysis in comparison with bi-global stability analysis (Giannetti & Luchini Reference Giannetti and Luchini2007; Juniper et al. Reference Juniper, Tammisola and Lundell2011; Juniper & Pier Reference Juniper and Pier2015; Kaiser et al. Reference Kaiser, Poinsot and Oberleithner2018).
4.3. Solving the eigenvalue problem
To solve the eigenvalue problem numerically, cross-flow planes with the dimensions of  $0\leq y/H\leq 1.3$ and
 $0\leq z/H\leq 1.3$ are discretized using Chebyshev spectral collocation methods. This approach has been successively applied to linear stability analysis by Khorrami (Reference Khorrami1991), Parras & Fernandez-Feria (Reference Parras and Fernandez-Feria2007), Oberleithner et al. (Reference Oberleithner, Sieber, Nayeri, Paschereit, Petz, Hege, Noack and Wygnanski2011) and Demange et al. (Reference Demange, Chazot and Pinna2020). Detailed descriptions or practical guides to spectral collocation methods can be found in Khorrami, Malik & Ash (Reference Khorrami, Malik and Ash1989) and Trefethen (Reference Trefethen2000).
To reduce the numerical cost, we further exploit the symmetry of the mean field with respect to the vertical  $x$–
 $z$ plane. This allows us to use only half of the wake plane instead of the full plane, to compute only transversely symmetric or antisymmetric eigenmodes when appropriate boundary conditions are applied (Zampogna & Boujo Reference Zampogna and Boujo2023). As shown in § 3, the symmetric perturbations are dominant and potentially related to a global instability, so only symmetric eigenmodes are considered. The corresponding boundary conditions are given as
 $$\begin{gather} \frac{\partial{\boldsymbol{\hat{u}}}}{\partial{y}}=\frac{\partial{\boldsymbol{\hat{w}}}}{\partial{y}}=\frac{\partial{\boldsymbol{\hat{p}}}}{\partial{y}}=0,\boldsymbol{\hat{v}}=0, \quad {\rm on} \ y/W=0, \end{gather}$$
 $$\begin{gather}\frac{\partial{\boldsymbol{\hat{u}}}}{\partial{y}}=\frac{\partial{\boldsymbol{\hat{v}}}}{\partial{y}}=\frac{\partial{\boldsymbol{\hat{w}}}}{\partial{y}}=\frac{\partial{\boldsymbol{\hat{p}}}}{\partial{y}}=0, \quad {\rm on}\ y/W=1.3, \end{gather}$$
 $$\begin{gather}\boldsymbol{\hat{u}}=\boldsymbol{\hat{v}}=\boldsymbol{\hat{w}}=0,\frac{\partial{\boldsymbol{\hat{p}}}}{\partial{z}}=0, \quad {\rm on} \ z/W=0, \end{gather}$$
 $$\begin{gather}\boldsymbol{\hat{u}}=\boldsymbol{\hat{v}}=\boldsymbol{\hat{w}}=\boldsymbol{\hat{p}}=0, \quad {\rm on} \ z/W=1.3. \end{gather}$$
Here, (4.15a) determines eigenmodes to be transversely symmetric. At the wall, homogeneous Dirichlet boundary conditions are imposed for the velocity components. For pressure, by substituting the homogeneous Dirichlet conditions for velocity into (4.6), a compatibility condition can be obtained (Theofilis, Duck & Owen Reference Theofilis, Duck and Owen2004). Here, assuming  $\partial ^2{\boldsymbol {\hat {w}}}/\partial {z}^{2}=0$ gives a homogeneous Neumann condition for the pressure. For far-field boundaries, the upper boundary is set to a homogeneous Dirichlet condition, while the side boundary is set to a homogeneous Neumann condition which is necessary to predict far-wake eigenmodes.
The Krylov–Schur algorithm (Stewart Reference Stewart2002), which serves as an improvement on traditional Krylov subspace methods such as the Arnoldi and Lanczos algorithms, is used to obtain a subset of solutions to the eigenvalue problem. This requires an initial guess of the physical eigenvalue, which can be derived from the dispersion relation shown in § 3.2. To discard spurious eigenmodes caused by the discretization, two criteria are applied: first, all eigenmodes that do not diminish when approaching the upper boundary are discarded. Second, since spurious eigenvalues are very sensitive to discretization, a convergence study of eigenvalues computed using different grid resolutions is used as a criterion for filtering spurious eigenvalues.
The results of the convergence study based on temporal stability analysis are shown in figure 11. Two representative cross-flow planes, located in the near wake and far wake, respectively, are considered. Real streamwise wavenumbers of 10 and 5 are, respectively, imposed in the two eigenvalue problems, which are then discretized using two different grid resolutions and solved for the subset of the eigenvalue spectrum. Note that the real streamwise wavenumbers are chosen according to the wavelength distribution of the dominant SPOD mode shown in figure 7, so that the SPOD peak frequency can be set as the initial value of the Krylov–Schur iteration procedure. As shown in figure 11, both spectra feature continuous branches and a set of discrete modes. In general, continuous branches are made up of spurious eigenmodes caused by discretization and physical eigenmodes that are highly stable.
The spectrum of eigenvalues obtained with discretization points of 8100 ( $\square$) and 10 000 (
 $\circ$, blue), the physical eigenvalues are marked with
 $\ast$, red. (a) Results based on cross-flow plane at
 $X/W=0.1$ and imposing
 $\alpha =10$. (b) Results based on cross-flow plane at
 $X/W=3.5$ and imposing
 $\alpha =5$.

It can be observed that the locations of these eigenmodes in continuous branches vary significantly when the resolution of the grid is changed. On the contrary, the locations of the discrete modes remain almost stationary with different discretization settings; hence, the discrete modes are considered as physical eigenmodes that can potentially contribute to global instability. In particular, the near-wake cross-flow plane features one unstable mode and two stable modes, while the far-wake plane features two stable modes. Note that these physical eigenvalues do not necessarily correspond between the near-wake and far-wake cross-flow planes. When tracking along the streamwise direction, the physical eigenvalues may become highly stable and fall into the spurious region, and new physical eigenvalues may emerge due to the complexity of the base flow.
4.4. Absolute/convective stability analysis
4.4.1. Streamwise evolution of temporal growth rate
Before considering the absolute/convective nature of the instability, it is necessary to know which part of the flow is temporally unstable. To this end, the complex frequencies of the previously identified physical modes at  $x/H=0.1$ and
 $x/H=3.5$ are tracked when varying the real streamwise wavenumber. The exact maximum temporal growth rate of each mode is then determined based on a Newton–Raphson iterative method (Ypma Reference Ypma1995). Figure 12 shows the branches of the most unstable modes at the two streamwise locations, with the associated maxima marked by asterisks. These maxima are then tracked along the streamwise direction, with a spacing of
 $\Delta {x}/W=0.002$, by repeating the iteration procedure. As mentioned above, due to the complexity of the base flow, one physical eigenmode may occur only in a certain range of streamwise location. Therefore, several more cross-flow planes are used to compute the physical eigenvalues, and then the tracking process is repeated to account for the maximum temporal growth rates of all physical eigenmodes in the entire wake.
Frequency (a) and temporal growth rate (b) of the of the temporally most unstable modes at  $x/H=0.1$ (dashed line) and
 $x/H=3.5$ (solid line) as a function of real wavenumber. The maximum temporal growth rates of the two eigenmodes are marked by asterisks.

In figure 13, the maximum temporal growth rates of these physical eigenmodes are displayed as a function of streamwise location. Only the unstable regime ( $\omega _{{i}}>0$) is shown here. Three different unstable eigenvalue branches are identified in the entire wake, each dominating in different streamwise regions. Accordingly, the flow becomes temporally unstable very close to the tail of the train and remains unstable in the wake. Based on the spatial locations where these branches become unstable, we conceptually divide the wake into the near-, middle- and far-wake regimes and name these branches accordingly. It can be found in figure 13(b) that the near-wake eigenmode is temporally more unstable than all the downstream eigenmodes. According to the mean flow distribution shown in figure 13(a), this eigenmode branch is attributed to the transverse recirculation zone located right behind the tail of the train. The far-wake eigenmode can be observed across a wide streamwise distance and is located close to the extension of the streamwise vortex pair. This branch has the largest temporal growth rate at
 $x/W\sim 0.4$, and gradually stabilizes as it extends into the far wake; however, it remains still unstable. The middle-wake mode becomes unstable at
 $0.5< x/W<1.4$. At this location, with respect to the mean field, the flow from the slanted tail surface can be observed attached to the ground according to figure 13(a).
Maximum temporal growth rate as functions of streamwise location. (a) Mean flow distribution in the central plane; (b) maximum temporal growth rate of near-wake (------, red), middle-wake (------, green) and far-wake (------, blue) eigenmodes with real  $\alpha$ imposed.

4.4.2. Spatio-temporal stability analysis in the near wake
Spatio-temporal analysis is performed to compute the contour of  $\omega$ in the complex
 $\alpha$-plane, so as to find valid saddle points following the Briggs–Bers criterion. Since the branch in the near-wake region is temporally more unstable than the other branches (figure 13), we start with the near-wake branch.
Figure 14 shows the contour of the complex frequency in the complex  $\alpha$-plane, at the streamwise location of
 $x/W=0.08$. At this location, the near-wake eigenmode reaches its maximum temporal growth rate. In this figure two saddle points are found,
 $S_0$ and
 $S_1$. However, valid saddles must be pinched between an
 $\alpha ^+$ and an
 $\alpha ^-$ branch (Huerre & Monkewitz Reference Huerre and Monkewitz1990). A simple rule based on the Briggs–Bers pinch-point criterion (Briggs Reference Briggs1964) can be applied by checking the isocontours of the spatio-temporal growth rate (figure 14b): starting from the saddle point, the contours of the growing
 $\omega _{{i}}$ must reach, respectively, the
 $\alpha _{{i}}>0$ and
 $\alpha _{{i}}<0$ half-planes. Here, the validity of both
 $S_0$ and
 $S_1$ can be confirmed, with
 $S_0$ representing the shorter travelling wave at higher frequency, while
 $S_1$ represents the longer travelling wave at lower frequency. In the long-time limit, the nature of the instability is determined by
 $S_0$, which has a significantly higher absolute growth rate than
 $S_1$. Then the absolute frequency at this location can be determined as
 $\omega _0=3.2904+0.0685{\rm {i}}$, which shows that the flow is absolutely unstable at this position.
Contour of the complex angular frequency in the complex  $\alpha$-plane at
 $x/W=0.08$. Saddle points on the complex
 $\alpha$-plane are marked by a red circle. (a) The real component; (b) the imaginary component; the
 $\omega _{{i}}=0$ isocontour is highlighted in red.

Furthermore, to ensure that all regions with absolute instability have been taken into account, the absolute growth rate has been determined for all unstable branches at several streamwise locations. The near-wake branch was the only one to reveal absolute instability.
4.5. Determining the global mode wavemaker in the near wake
To determine the global mode, the saddle points are tracked in the streamwise direction to find the global wavemaker. This is done in the local analysis framework based on the frequency selection criterion. Several criteria have been evaluated in Pier (Reference Pier2002), showing that the criterion for a linear global mode introduced by Chomaz, Huerre & Redekopp (Reference Chomaz, Huerre and Redekopp1991) agrees best with nonlinear direct numerical simulations. This criterion is obtained from an analytical continuation of the absolute frequency curve into the complex  $x$-plane. The wavemaker region is then represented by the saddle point on the complex
 $x$-plane (Huerre & Monkewitz Reference Huerre and Monkewitz1990) defined as
 \begin{equation} \frac{\partial\omega_0}{\partial{x}}(x_{{s}})=0. \end{equation}
The global complex angular frequency is then given by the value of the absolute frequency at this saddle point
 \begin{equation} \omega_{{g}}=\omega_0(x_{{s}}). \end{equation}
For this purpose, the saddle point  $S_0$ found in figure 13 is tracked along the streamwise direction. The three-point Taylor series expansion algorithm (Rees Reference Rees2010) is used to approach
 $\partial \omega /\partial \alpha =0$ during the tracking process. Then the absolute frequency as a function of streamwise location is analytically continued in the complex
 $x$-plane using the Padé polynomial, which has been shown to be well behaved in the complex plane (Cooper & Crighton Reference Cooper and Crighton2000). The Padé polynomial takes the form of
 \begin{equation} f(x)=\frac{P(x)}{Q(x)}=\frac{a_0+a_1x+\cdots+a_nx^n}{1+b_1x+\cdots+b_mx^m}. \end{equation}
To determine the order of the polynomials used in the current work, the procedure described in Juniper et al. (Reference Juniper, Tammisola and Lundell2011) is followed. Polynomials of order 10 have been proven to be sufficient to give a converged approximation of the saddle point.
Figure 15 shows the main results of the spatio-temporal stability analysis. For reference, the mean field in the central plane is shown in figure 15(a). The following rows include the results of the procedures described above to determine the global instability using local analysis. In figure 15(b,c), the imaginary and real parts of the absolute complex angular frequency are shown as a function of streamwise location, respectively. A small region of absolute instability is detected, which is located in the recirculation region. The tenth-order Padé polynomials show acceptable agreement with the absolute frequency curve of the linear stability analysis. The extrapolated complex  $x$-plane is then visualized in figure 15(d). The saddle point appears to be very close to the real axis, with
 $x_{{s}}=0.0733+0.0010{\rm {i}}$, indicating a wavemaker located within the region of absolute instability. The complex global angular frequency associated with this saddle point is
 $\omega _{{g}}=3.2702+0.0797{\rm {i}}$.
(a) Streamlines and through-plane vorticity of the mean field in the near-wake region. (b) Streamwise evolution of the absolute growth rate. (c) Streamwise evolution of the absolute angular frequency. (d) Contours of  $\omega _{{0,i}}$ extruded in the complex
 $x$-plane, formed by the fitted Padé polynomial. The saddle point on the complex
 $x$-plane is marked by a red circle. (e) The imaginary component of local complex streamwise wavenumber of
 $\alpha ^+$ and
 $\alpha ^-$ branches calculated at the global frequency
 $\omega _g$. ( f) The same as (e) with the real component shown. The switching locations between
 $\alpha ^+$ and
 $\alpha ^-$ branches are marked by a red vertical line in each panel.

The theoretically predicted global mode frequency can be compared with the frequency of the most energetic SPOD mode, as presented in table 1. Meanwhile, the global frequency and wavemaker location predicted by the stability analysis without the non-parallelism approximation (see Appendix B) are also shown for comparison. In general, the global frequency predicted by the stability analysis without the non-parallelism approximation shows a larger deviation from the SPOD result, compared with that with the non-parallelism approximation. By including the spatial variation of the mean field into the stability analysis, the prediction on the global stability has been significantly improved. With the empirical value of  $\omega _{{SPOD}}=3.437$, we find that the theoretical prediction deviates by an error of less than
 $5\,\%$. This is in very good agreement, given the uncertainties introduced by the non-parallelism and eddy viscosity modelling. Moreover, we expect the global mode to be marginally unstable, representing a limit-cycle oscillation when stability analysis is performed on a temporally averaged mean flow (Noack et al. Reference Noack, Afanasiev, Morzyński, Tadmor and Thiele2003; Barkley Reference Barkley2006; Oberleithner et al. Reference Oberleithner, Sieber, Nayeri, Paschereit, Petz, Hege, Noack and Wygnanski2011; Rukes et al. Reference Rukes, Sieber, Paschereit and Oberleithner2016; Tammisola & Juniper Reference Tammisola and Juniper2016; Kaiser et al. Reference Kaiser, Poinsot and Oberleithner2018). However, as reported in Giannetti & Luchini (Reference Giannetti and Luchini2007), Juniper et al. (Reference Juniper, Tammisola and Lundell2011) and Juniper & Pier (Reference Juniper and Pier2015), it is a common feature of local analysis to overpredict the growth rate of the linear global mode. In our case, with a growth rate value of 0.0797, the relative error with respect to the real frequency (3.2702) is less than
 $3\,\%$, therefore, it is reasonable to say that the mode is marginally unstable. Overall, considering the fact that the flow is not truly parallel and the intrinsic assumption of linearized mean field analysis, it can be concluded that the theoretical mode identifies the dominant SPOD mode as a global mode at limit cycle with remarkable accuracy.
Global frequency and wavemaker location predicted by different approaches.

The global mode is formed by the switching between the  $\alpha ^+$ and
 $\alpha ^-$ branches at the global frequency. Therefore, to further truly localize the global mode wavemaker, a spatial stability analysis (4.14) imposing
 $\omega =\omega _{{g}}$ is conducted to compute the
 $\alpha ^+$ and
 $\alpha ^-$ branches (Juniper & Pier Reference Juniper and Pier2015). Since the saddle point
 $x_{{s}}$ on the complex
 $x$-plane is very close to the real axis, the location of maximum structural sensitivity should also be close to
 $x_{{s,r}}$. Therefore, in practice, it can be quite straightforward to find the branch pairs by computing the eigenvalue problem at
 $x/W=x_{{s,r}}$, and following
 $\alpha _{{i}}^+-\alpha _{{i}}^-\approx 0$ in the streamwise direction.
In figure 15(e,f), the imaginary and real components of the  $\alpha ^+$ and
 $\alpha ^-$ branches are presented, respectively. The switch between the two branches can be identified to take place at
 $x/W=0.0731$. The location of the global mode wavemaker is marked by a red vertical line in all panels of figure 15. This location is also within the recirculation region and is nearly identical to the location of the saddle point
 $x_{{s}}$. The direct global mode then follows the
 $\alpha ^-$ branch upstream of the wavemaker, and the
 $\alpha ^+$ branch downstream. On the contrary, the adjoint global mode follows the
 $\alpha ^+$ branch upstream of the wavemaker, and
 $\alpha ^-$ branch downstream (Juniper & Pier Reference Juniper and Pier2015). This result also indicates a spatially growing global mode within the recirculation region, with the growth rate gradually decaying to zero as it approaches the downstream boundary of this region.
In summary, we identify a global mode with a frequency very close to the dominant SPOD mode and a growth rate close to zero. This suggests that the dominant SPOD mode is a manifestation of a global mode at the limit cycle. The wavemaker of this mode is located in the recirculation zone very close to the tail tip. It acts as the origin for the entire coherent wavepacket that propagates far downstream, in a region where the flow is convectively unstable. The spatial shape and mechanisms of the global mode and comparison with the SPOD modes will be shown and discussed in § 5.
4.6. Structural sensitivity based on the adjoint method
To further analyse where and how intrinsic feedback causes global instability (Chomaz Reference Chomaz2005; Giannetti & Luchini Reference Giannetti and Luchini2007), we calculate the structural sensitivity using adjoint linear stability analysis. The structural sensitivity describes the sensitivity of the direct global mode to changes in the linearized Navier–Stokes operator, e.g. base flow modification (Marquet et al. Reference Marquet, Lombardi, Chomaz, Sipp and Jacquin2009). Therefore, this concept is critical for the development of efficient flow control strategies (Giannetti & Luchini Reference Giannetti and Luchini2007; Müller et al. Reference Müller, Lückoff, Paredes, Theofilis and Oberleithner2020).
In the global framework, structural sensitivity is proportional to the overlap between the direct and adjoint global modes (Chomaz Reference Chomaz2005). Following Giannetti & Luchini (Reference Giannetti and Luchini2007), the  $L^2$ norm of the sensitivity tensor is equivalent to the expression
 \begin{equation} \lambda(\boldsymbol{x})=\Vert\boldsymbol{\hat{m}}(\boldsymbol{x})\Vert\Vert\boldsymbol{\hat{m}^{\dagger}}(\boldsymbol{x})\Vert, \end{equation}
where  $\boldsymbol {\hat {m}}(\boldsymbol {x})$ and
 $\boldsymbol {\hat {m}^{\dagger} }(\boldsymbol {x})$ represent the direct and adjoint momentum vectors, respectively. In the previous section, the location of the wavemaker was identified by computing the intersection between the
 $\alpha ^+$ and
 $\alpha ^-$ branches (at
 $x/W=0.0731$). However, the exact location of the maximum structural sensitivity at this cross-flow plane is still unknown. This requires computation of the adjoint mode at this streamwise location. Therefore, the adjoint linear stability analysis is further pursued in this section.
Due to the inhomogeneous directions and hence differential dependencies in the linearized operator matrix, taking the Hermitian transpose of the direct operator as the adjoint operator, as has been done in Oberleithner, Rukes & Soria (Reference Oberleithner, Rukes and Soria2014); Müller et al. (Reference Müller, Lückoff, Paredes, Theofilis and Oberleithner2020), does not necessarily apply here. To find the adjoint of the system, the continuous approach is used. First, we define the inner product as
 \begin{equation} \left\langle\boldsymbol{\hat{q}}_1,\boldsymbol{\hat{q}}_2\right\rangle\equiv\int_{S}\boldsymbol{\hat{q}}_1^H\boldsymbol{\hat{q}}_2\,{{\rm d}}S\equiv\boldsymbol{\hat{q}}_1^H\boldsymbol{W}\boldsymbol{\hat{q}}_2. \end{equation}
The adjoint modes depend on this choice of norm, but when recombined with the direct modes to give the sensitivity measurement of the eigenvalue to changes in  $\boldsymbol {\mathcal {L}}$, the effect of the norm cancels out (Chandler et al. Reference Chandler, Juniper, Nichols and Schmid2012).
By definition, the adjoint operator  $\boldsymbol {\mathcal {L}^{\dagger} }$ should fulfil
 \begin{equation} \left\langle\boldsymbol{\hat{q}^{\dagger}},\boldsymbol{\mathcal{L}}\boldsymbol{\hat{q}}\right\rangle\equiv\left\langle\boldsymbol{\mathcal{L}^{\dagger}}\boldsymbol{\hat{q}^{\dagger}},\boldsymbol{\hat{q}}\right\rangle. \end{equation}
This definition is valid for any pair of vectors, but for convenience, they are expressed in terms of the direct state vector  $\boldsymbol {\hat {q}}$ and the adjoint state vector
 $\boldsymbol {\hat {q}^{\dagger} }$, as done in Marquet et al. (Reference Marquet, Lombardi, Chomaz, Sipp and Jacquin2009); Qadri, Mistry & Juniper (Reference Qadri, Mistry and Juniper2013). More specifically, we consider the spatial stability form, then the generalized eigenvalue problem is pre-multiplied by the adjoint eigenvector
 \begin{equation} \left\langle\boldsymbol{\hat{q}^{\dagger}},\boldsymbol{\mathcal{A}}\boldsymbol{\hat{q}}\right\rangle-\left\langle\boldsymbol{\hat{q}^{\dagger}},\alpha\boldsymbol{\mathcal{B}}\boldsymbol{\hat{q}}\right\rangle=0. \end{equation}
By successively integrating the equation by parts using Green's theorem, (4.22) is rearranged to
 \begin{equation} \left\langle\boldsymbol{\mathcal{A}^{\dagger}}\boldsymbol{\hat{q}^{\dagger}},\boldsymbol{\hat{q}}\right\rangle-\left\langle\alpha^{\dagger}\boldsymbol{\mathcal{B}^{\dagger}}\boldsymbol{\hat{q}^{\dagger}},\boldsymbol{\hat{q}}\right\rangle=0. \end{equation}
Note that the integration-by-parts process would leave boundary terms in the expression. Therefore, appropriate adjoint boundary conditions are applied to cancel out all boundary terms. Then the adjoint of the direct eigenvalue problem is obtained from (4.23) as
 \begin{equation} \boldsymbol{\mathcal{A}^{\dagger}}\boldsymbol{\hat{q}^{\dagger}}=\alpha^{\dagger}\boldsymbol{\mathcal{B}^{\dagger}}\boldsymbol{\hat{q}^{\dagger}}. \end{equation}
The detailed derivations as well as the validation of the adjoint operators and boundary conditions used in the current study are presented in Appendix D.
It can be shown that, for well-converged adjoint solutions, the adjoint eigenvalues, ordered by the same rule as the direct ones, are the complex conjugates of the direct ones (Schmid & Henningson Reference Schmid and Henningson2000), and the bi-orthogonality condition writes
 \begin{equation} \left(\left(\alpha_m^{\dagger}\right)^\ast{-}\alpha_n\right)\left[\left(\boldsymbol{\hat{q}^{\dagger}}_m\right)^H\boldsymbol{W}\boldsymbol{\mathcal{B}}\boldsymbol{\hat{q}}_n\right]=0. \end{equation}
The bi-orthogonality enables the characterization of the receptivity of the open-loop forcing, and the sensitivity to modification of the mean flow (Marquet et al. Reference Marquet, Lombardi, Chomaz, Sipp and Jacquin2009).
In figure 16, the distribution of the structural sensitivity at the streamwise location where  $\alpha ^+$ and
 $\alpha ^-$ branches intersect (
 $x/W=0.0731$) is shown. This field is obtained by first computing the adjoint mode on the considered cross-flow plane based on the methodology presented above and then calculating the
 $L^2$ norm of the sensitivity tensor following (4.19). In addition, mean flow streamlines are also included so that the structural sensitivity can be related to specific flow structures. Based on the results, both the upper and lower recirculation zones are highlighted. In particular, it can be observed that the position of the highest structural sensitivity, enclosed by the blue solid line in figure 16, is located slightly below the stagnation point of the recirculation region. The streamwise vortex pair generated from both sides of the train, on the other hand, seems to have no relevance to the sensitivity of the linear global mode. The highest structural sensitivity at this location, shown in figure 16, suggests that the interaction between the lower and upper shear layers, which drives the self-excitation of the instability, is the most sensitive to a steady external forcing and is therefore of significant importance in terms of controlling of the global mode. Note that, in this part, a deeper interpretation of different components of the structural sensitivity tensor, as has been done in Qadri et al. (Reference Qadri, Mistry and Juniper2013), is beyond the scope of this work.
Structural sensitivity indicating sensitivity to mean flow modifications; the values are normalized by the maximum value. Streamlines are drawn based on mean flow; the blue line indicates the normalized structural sensitivity = 0.90 isocontour.

5. Comparison between empirical and theoretical modes
In this section, the near-wake eigenmode which serves as the origin of the global mode, is tracked further downstream into the far wake to obtain the full picture of the linear global mode. The linear global mode is then compared with the leading SPOD mode to show the connections between them and to reveal additional physical driving mechanisms.
To reconstruct the shape of the global mode, the  $\alpha ^+$ branch at
 $\omega _{{g}}$ must be tracked in the downstream direction reaching into the far wake. However, as illustrated in § 4.3, the complexity of the base flow gives rise to the problem that the physical eigenvalue may become highly stable at one location and fall into a spurious region, and then be untraceable at another location. Therefore, we not only focus on the
 $\alpha ^+$ branch, but also include spatial branches that arise and become unstable during the tracking process.
The results of the branch tracking process are shown in figure 17. Accordingly, the near-wake branch becomes spatially stable when approaching  $x/W=0.3$, and cannot be tracked further downstream of
 $x/W=0.5$. However, at
 $x/W=0.4$, a new eigenmode, which corresponds to the middle-wake branch, becomes the most spatially unstable. The middle-wake branch develops to be slightly spatially unstable only within
 $0.75< x/W<1.05$, and remains spatially stable for most of the streamwise range of its occurrence. However, it is still the most unstable within the streamwise region
 $0.4< x/W<1.6$. Downstream of
 $x/W=1.6$, the far-wake branch becomes dominant. The spatial amplification rate of the far-wake eigenmode is observed to grow slightly upstream of
 $x/W=2.0$, which is attributed to the growing spatial sizes of the streamwise vortex pair and thereafter the far-wake coherent structures. Then, the far-wake eigenmode remains at a nearly constant spatial amplification rate with a marginally stable state after this location, and extends into the farthest streamwise location considered in this study.
Spatial amplification rates of the most unstable near-wake (------, red), middle-wake (------, green) and far-wake (------, blue) branches as functions of streamwise location, computed at the global complex frequency  $\omega _g$.

To analyse whether these branches actually represent the empirical mode observed in the SPOD, we compute the alignment between the leading SPOD mode and the linear global mode based on the  $L^2$ inner product. Since the wake flow is highly non-parallel, with several different spatial branches contributing to the linear global mode, we do not reconstruct the full three-dimensional global mode prior to the alignment measurement. Instead, the alignment between the leading SPOD mode and the three eigenmode branches are computed at all streamwise locations.
In figure 18(a), the alignment between the leading SPOD mode and the three eigenmode branches are plotted as a function of  $x/W$. It can be observed that the alignment curves generally follow similar trends to the spatial growth rates of the three branches shown in figure 17, with the alignment value always being the highest for the most unstable eigenmode branch. In particular, the alignment is, in general, quite high, with a value above 0.7, except for locations where the spatial branches switch. Therefore, the three eigenmode branches can be regarded as manifestations of the SPOD mode at different regions of the wake. This result further supports the modelling approach in this research for tracking the linear global mode in a highly complex three-dimensional base flow.
Comparison between the leading SPOD mode and the global linear stability mode from local analysis. (a) Alignment between the SPOD mode and the eigenmodes of the three branches (colours of lines correspond to figure 17) as functions of streamwise location. (b,d,f) The isosurface of the streamwise component of SPOD mode coloured respectively by the alignment with the near-wake, middle-wake and far-wake branches. (c,e,g) The streamwise component of the near-wake, middle-wake and far-wake SPOD modes and eigenmodes. Streamlines are drawn based on mean flow.

For better visualization, in figure 18(b,d,f), the three-dimensional SPOD mode is displayed based on the isosurface of the streamwise component, coloured by the alignment of the three eigenmode branches. In addition, figure 18(c,e,g) shows a direct comparisons between the cross-flow shapes of the SPOD mode and the linear global mode at different streamwise locations. In general, similar structures can be identified throughout the entire wake region. In the near-wake region, the vortex shedding related to the transverse recirculation zone is dominant in both the SPOD and the linear global mode, with slightly different ranges between the two modes. Further downstream in the middle-wake and far-wake regions, the coherent structures related to the streamwise vortex pair become dominant. The SPOD mode generally predicts a higher fluctuation amplitude near the ground and the central line compared with the linear global mode.
In conclusion, the fundamental mechanism of instability in the considered flow problem can be interpreted as follows: within the recirculation zone, the flow has a small region of absolute instability, which contributes to the global wavemaker located inside. The global frequency is well matched to the SPOD peak frequency and the linear global mode in this region has very high alignment with the SPOD mode. Further downstream, the flow becomes convectively unstable, amplifying the perturbations received by the global wavemaker, with the oscillation frequency synchronized to the global frequency. In this situation, the most spatially unstable branch becomes dominant and aligns the best with the SPOD mode.
6. Summary and conclusions
Understanding the important dynamics in complex technical flow is crucial in engineering practice. In this paper, three-dimensional coherent structures in the turbulent wake flow behind a generic high-speed train are investigated. A large eddy simulation has been performed to simulate and collect a database of the flow problem considered. For the purpose of this research, both the empirical identification approach based on SPOD and the theoretical approach using linear stability analysis are used.
The turbulent wake is found to be dominated by spanwise symmetric coherent structures, based on the comparison between the SPOD energy spectrum of symmetric and antisymmetric fluctuations. The most dominant SPOD mode is found to oscillate at the angular frequency of  $\omega =3.437$. This dominant mode has an increasing wavelength in the near wake and a nearly constant wavelength in the far wake. The quadratic nonlinear interaction of the velocity perturbation is further checked by computing the mode bispectrum to explain the broadband coherent dynamics. The fundamental mode is identified with strong self-interaction, which generates the first harmonic and subharmonic triads, meanwhile leading to significant deformation of the mean field. With the continuous evolution of this process, the flow finally appears to be low rank in a wide frequency range.
The global instability is analysed by employing a two-dimensional local spatio-temporal stability approach following the WKBJ approximation and combined with a non-parallelism treatment. Three spatial branches with positive temporal growth rate are found, with the near-wake branch being the most unstable. The absolute frequency of the near-wake branch is then found on the basis of a valid saddle point on the complex  $\alpha ^+$-plane and tracked along the streamwise direction. A confined region of absolute instability is identified in the near-wake region. The global frequency is then determined to be
 $\omega _{{g}}=3.2702+0.0797{\rm {i}}$ based on the frequency selection criterion, indicating a marginally stable global mode. This result is in excellent agreement with the empirical prediction in terms of angular frequency, and the theoretical expectation in terms of growth rate. The near-wake recirculation zone is found to be related to the global mode wavemaker, which drives the self-excitation of the instability. The adjoint method is further used to compute the structural sensitivity at the location where the
 $\alpha ^+$ and
 $\alpha ^-$ branches intersect. In the corresponding cross-flow plane, the highest sensitivity is found near the upper and lower shear layers of the recirculation bubble, near the tip of the train nose. Accordingly, the global mode is expected to be most sensitive to mean flow changes in this region.
The linear global mode shape is further computed at each streamwise location by imposing the global frequency. Three spatial branches are found to be dominant respectively in the near-, middle- and far-wake regions. The alignment between the linear global and leading SPOD modes is then performed to provide a quantitative comparison between mode shapes. Within the recirculation zone where the global wavemaker is located, the linear global mode has very high alignment with the SPOD mode. Further downstream, the flow becomes convectively unstable and the oscillations within these regions are synchronized with the global frequency by excitation from the wavemaker. Spatial branches with the highest spatial amplification rates become dominant and show highest alignment with the SPOD mode.
This work has two main conclusions, one methodological and one physical. Methodologically, a framework to track linear global mode in highly complex three-dimensional base flows is introduced, and this method is justified a posteriori by the very good agreement with the empirical modes. To the authors’ knowledge, this is the first research dealing with the linear global stability in such a complex flow problem. Physically, the dominant SPOD mode is identified as being caused by a linear global mode in the wake of the train. This mode exhibits transverse symmetry and may cause significant fluctuations on the train surface, which can cause operational safety problems. The sensitivity analysis further shows that this mode could be quite effectively suppressed by small changes of the base flow near the tail of the train, which is of significant importance in terms of developing efficient flow control strategies.
In this work, we have considered a simplified train model as the research object. For a more realistic train model with complex under-body structures and operating at higher Reynolds number, the formation of the spanwise vortex pair is significantly hindered. The global mode driven by the spanwise vortex pair is likely to be suppressed, and the entire wake flow will be convectively unstable. Thereafter, the symmetric global oscillation observed in our current research will develop into asymmetric perturbations with longer wavelength attributed to the Crow instability (Crow Reference Crow1970) of the streamwise vortex pair, as have been observed in Bell et al. (Reference Bell, Burton, Thompson, Herbst and Sheridan2016). The physical mechanisms of this dominant perturbation in the wake of a realistic train, as well as their influential factors, are expected to be further addressed in future works.
Supplementary movies
Supplementary movies are available at https://doi.org/10.1017/jfm.2024.950.
Funding
This work is supported by the National Science Foundation of China (grant no. 52202429), the Project of Scientific and Technological Research and Development of China Railway (P2021J037), the Hunan Provincial Natural Science Foundation (grant no. 2023JJ40747) and the China Scholarship Council (grant no. 202006370204). The authors acknowledge the computational resources provided by the High Performance Computing Centre of Central South University, China.
Declaration of interests
The authors report no conflict of interest.
Data availability
The data and code that support the findings of this study are available from the authors upon reasonable request.
Appendix A. Validation of the LES
In order to validate the LES results, a wind tunnel experiment is carried out in the high-speed test section of the closed-loop wind tunnel in the Key Laboratory of Traffic Safety on Track, Central South University. The experimental configuration is shown in figure 19. The dimensions of the test section are  $3400\,{\rm mm}\times 1000\,{\rm mm}\times 800\,{\rm mm}$. To eliminate the effect of the wind tunnel boundary layer, the train model is installed on the static wind tunnel floor that is mounted on the bottom surface of the test section. The experimental Reynolds number is
 $\textit {Re}=9.5\times 10^4$, consistent with the LES.
Wind tunnel experiment set-up. (a) Windward view. (b) Leeward view.

The flow velocity on the vertical symmetry plane  $y=0$ is measured using a 4-hole TFI cobra probe installed on a traverse system. The probe is able to measure flow fields within a range of
 $\pm 45^{\circ }$, and can resolve fluctuations up to 2000 Hz. At each measurement point, data are continuously collected for a duration of 20 s, capable of converging the time-averaged velocity and Reynolds stress distributions.
Since the ground condition differs between the wind tunnel experiment and the LES, the validation is carried out based on the comparison of flow fields on the upper side of the train tail. In figure 20, the profiles of the time-averaged streamwise velocity  $\bar {u}$ and streamwise Reynolds stress
 $\overline {u'u'}$ are shown. The vertical dashed lines mark the
 $x$ location of the measured profiles and correspond to
 $\bar {u}=0$ and
 $\overline {u'u'}=0$ in figures 20(a) and 20(b), respectively. For the time-averaged streamwise velocity profiles
 $\bar {u}$, the distance between two adjacent vertical lines corresponds to the range from 0 to
 $U_{\infty }$. For the streamwise Reynolds stress component
 $\overline {u'u'}$, the distance corresponds to a range from 0 to the global maxima among all considered data points, which occurs at
 $x/H=-0.4$.
Comparisons between the time-averaged flow quantities from LES modelling (------, black) and wind tunnel measurement ( $\ast$, red). (a) Streamwise velocity
 $\bar {u}$. (b) Streamwise Reynolds stress
 $\overline {u'u'}$. For details see text.

It can be seen from figure 20 that the time-averaged streamwise velocity and Reynolds stress profiles predicted by the large eddy simulation are generally in good agreement with the experimental results. Several discrepancies can be found at  $x/H=-0.2$, where the streamwise velocity and Reynolds stresses are overestimated by the LES. Considering the uncertainties introduced by the wind tunnel boundaries, the ground conditions and testing facilities, the discrepancies can be regarded as within reasonable range. In conclusion, the large eddy simulation in this paper predicts the important features and dynamics of the flow at acceptable accuracy.
Appendix B. Stability analysis without the non-parallelism approximation
To justify the non-parallelism approximation method proposed in this paper, we conduct a spatio-temporal analysis using the standard two-dimensional linearized Navier–Stokes equation for comparison.
In figure 21, similar to figure 14, the contour of the complex angular frequency in the complex  $\alpha$-plane, at the streamwise location of
 $x/W=0.08$ is presented. When the non-parallelism approximation is discarded, the location of the saddle point
 $S_0$ on the complex
 $\alpha$-plane moves closer to both the real and imaginary axes, denoting the longer travelling wave with lower spatial amplification rate compared with the one in figure 14. Meanwhile, the second saddle
 $S_1$ in figure 14 is shifted outside the considered range of the complex
 $\alpha$-plane when the non-parallelism approximation approach is not applied. The absolute frequency at this location can be then determined as
 $\omega _0=2.7114+0.3180{\rm {i}}$, which again indicates the absolutely unstable condition. Compared with the absolute frequency calculated in § 4.4.2, this value represents the perturbation oscillating with significantly longer time period and higher temporal growth rate.
Contour of the complex angular frequency in the complex  $\alpha$-plane at
 $x/W=0.08$. Saddle points on the complex
 $\alpha$-plane are marked by a red circle. (a) The real component. (b) The imaginary component; the
 $\omega _{{i}}=0$ isocontour is highlighted in red.

Then, the procedures described in § 4.5 are followed to account for the global instability, with the main results presented in figure 22. In figure 22(a,b), the imaginary and real parts of the absolute complex angular frequency are respectively shown as functions of the streamwise location. Different from the results shown in figure 15, the flow is predicted to be absolutely unstable within in a much larger streamwise range upstream of  $x/W=0.1$. In figure 22(c), the extrapolated complex
 $x$-plane based on the tenth-order Padé polynomials is visualized. The saddle point can be then located at
 $x_{{s}}=0.0342-0.0046{\rm {i}}$, with the associated global frequency
 $\omega _{{g}}=2.3721+0.6082{\rm {i}}$. Compared with the global frequency calculated in § 4.5, the current value shows larger deviations from both the empirical prediction in terms of angular frequency, and the theoretical expectation in terms of growth rate. This again suggests that, for a flow which is strongly non-parallel, utilizing a local approach is likely to give a poor prediction of the global instability. By including the approximation approach proposed in this paper, the accuracy of the prediction is much improved, which justifies the ability of the approach to model the non-parallelism of the flow.
(a) Streamwise evolution of the absolute growth rate. (b) Streamwise evolution of the absolute angular frequency. (c) Contours of  $\omega _{{0,i}}$ extruded in the complex
 $x$-plane, formed by the fitted Padé polynomial. The saddle point on the complex
 $x$-plane is marked by a red circle.

Appendix C. Direct LSA operator
The operator matrices  $\boldsymbol {\mathcal {A}}$ and
 $\boldsymbol {\mathcal {B}}$ used in the temporal stability analysis are shown as follows:
 \begin{gather} \boldsymbol{\mathcal{A}}=\begin{bmatrix} \boldsymbol{\mathcal{C}}+\boldsymbol{\bar{u}}_x-\boldsymbol{\nu}_{tx}(\boldsymbol{\mathcal{D}}_x+{\rm{i}}\alpha) & \boldsymbol{\bar{u}}_y-\boldsymbol{\nu}_{ty}(\boldsymbol{\mathcal{D}}_x+{\rm{i}}\alpha) & \boldsymbol{\bar{u}}_z-\boldsymbol{\nu}_{tz}(\boldsymbol{\mathcal{D}}_x+{\rm{i}}\alpha) & \boldsymbol{\mathcal{D}}_x+{\rm{i}}\alpha \\ \boldsymbol{\bar{v}}_x-\boldsymbol{\nu}_{tx}\boldsymbol{\mathcal{D}}_y & \boldsymbol{\mathcal{C}}+\boldsymbol{\bar{v}}_y-\boldsymbol{\nu}_{ty}\boldsymbol{\mathcal{D}}_y & \boldsymbol{\bar{v}}_z-\boldsymbol{\nu}_{tz}\boldsymbol{\mathcal{D}}_y & \boldsymbol{\mathcal{D}}_y \\ \boldsymbol{\bar{w}}_x-\boldsymbol{\nu}_{tx}\boldsymbol{\mathcal{D}}_z & \boldsymbol{\bar{w}}_y-\boldsymbol{\nu}_{ty}\boldsymbol{\mathcal{D}}_z & \boldsymbol{\mathcal{C}}+\boldsymbol{\bar{w}}_z-\boldsymbol{\nu}_{tz}\boldsymbol{\mathcal{D}}_z & \boldsymbol{\mathcal{D}}_z \\ \boldsymbol{\mathcal{D}}_x+{\rm{i}}\alpha & \boldsymbol{\mathcal{D}}_y & \boldsymbol{\mathcal{D}}_z & {0} \end{bmatrix}, \end{gather}
 \begin{gather} \boldsymbol{\mathcal{B}}=\begin{bmatrix} \rm{i} & {0} & {0} & {0} \\ {0} & \rm{i} & {0} & {0} \\ {0} & {0} & \rm{i} & {0} \\ {0} & {0} & {0} & {0} \end{bmatrix}, \end{gather}
where subscripts  $(.)_x$,
 $(.)_y$ and
 $(.)_z$ are related to flow quantities denoting their first derivatives with respect to the three directions,
 $\boldsymbol {\mathcal {D}}_x$,
 $\boldsymbol {\mathcal {D}}_y$ and
 $\boldsymbol {\mathcal {D}}_z$ are the first derivative matrices with respect to the three directions. Operator
 $\boldsymbol {\mathcal {C}}$ can be written as
 $$\begin{align}
\boldsymbol{\mathcal{C}}&=\boldsymbol{\bar{u}}(\boldsymbol{\mathcal{D}}_x+{\rm{i}}\alpha)+\boldsymbol{\bar{v}}\boldsymbol{\mathcal{D}}_y+\boldsymbol{\bar{w}}\boldsymbol{\mathcal{D}}_z-\left(\frac{1}{\textit{Re}}+\boldsymbol{\nu}_{t}\right)(\boldsymbol{\mathcal{D}}_{yy}+\boldsymbol{\mathcal{D}}_{zz}+\boldsymbol{\mathcal{D}}_{xx}+2{\rm{i}}\alpha\boldsymbol{\mathcal{D}}_{x}-\alpha^2)\nonumber\\
&\quad -\boldsymbol{\nu}_{tx}(\boldsymbol{\mathcal{D}}_x+{\rm{i}}\alpha)-\boldsymbol{\nu}_{ty}\boldsymbol{\mathcal{D}}_y-\boldsymbol{\nu}_{tz}\boldsymbol{\mathcal{D}}_z
, \end{align}$$
with  $\boldsymbol {\mathcal {D}}_{xx}$,
 $\boldsymbol {\mathcal {D}}_{yy}$ and
 $\boldsymbol {\mathcal {D}}_{zz}$ being the second derivative matrices with respect to the three directions.
In spatial stability analysis, operator matrices  $\boldsymbol {\mathcal {A}}$ and
 $\boldsymbol {\mathcal {B}}$ take the form
 \begin{gather} \boldsymbol{\mathcal{A}}=\begin{bmatrix} \boldsymbol{\mathcal{C}}+\boldsymbol{\bar{u}}_x-\boldsymbol{\nu}_{tx}\boldsymbol{\mathcal{D}}_x & \boldsymbol{\bar{u}}_y-\boldsymbol{\nu}_{ty}\boldsymbol{\mathcal{D}}_x & \boldsymbol{\bar{u}}_z-\boldsymbol{\nu}_{tz}\boldsymbol{\mathcal{D}}_x & \boldsymbol{\mathcal{D}}_x & 0 & 0 & 0 \\ \boldsymbol{\bar{v}}_x-\boldsymbol{\nu}_{tx}\boldsymbol{\mathcal{D}}_y & \boldsymbol{\mathcal{C}}+\boldsymbol{\bar{v}}_y-\boldsymbol{\nu}_{ty}\boldsymbol{\mathcal{D}}_y & \boldsymbol{\bar{v}}_z-\boldsymbol{\nu}_{tz}\boldsymbol{\mathcal{D}}_y & \boldsymbol{\mathcal{D}}_y & 0 & 0 & 0 \\ \boldsymbol{\bar{w}}_x-\boldsymbol{\nu}_{tx}\boldsymbol{\mathcal{D}}_z & \boldsymbol{\bar{w}}_y-\boldsymbol{\nu}_{ty}\boldsymbol{\mathcal{D}}_z & \boldsymbol{\mathcal{C}}+\boldsymbol{\bar{w}}_z-\boldsymbol{\nu}_{tz}\boldsymbol{\mathcal{D}}_z & \boldsymbol{\mathcal{D}}_z & 0 & 0 & 0 \\ \boldsymbol{\mathcal{D}}_x & \boldsymbol{\mathcal{D}}_y & \boldsymbol{\mathcal{D}}_z & 0 & 0 & 0 & 0 \\ 0 & 0 & 0 & 0 & 1 & 0 & 0 \\ 0 & 0 & 0 & 0 & 0 & 1 & 0 \\ 0 & 0 & 0 & 0 & 0 & 0 & 1 \\ \end{bmatrix}, \end{gather}
 \begin{gather} \boldsymbol{\mathcal{B}}=\begin{bmatrix} \boldsymbol{\mathcal{E}}+{\rm{i}}\boldsymbol{\nu}_{tx} & {\rm{i}}\boldsymbol{\nu}_{ty} & {\rm{i}}\boldsymbol{\nu}_{tz} & -{\rm{i}} & -1/\textit{Re}-\boldsymbol{\nu}_{t} & 0 & 0 \\ 0 & \boldsymbol{\mathcal{E}} & 0 & 0 & 0 & -1/\textit{Re}-\boldsymbol{\nu}_{t} & 0 \\ 0 & 0 & \boldsymbol{\mathcal{E}} & 0 & 0 & 0 & -1/\textit{Re}-\boldsymbol{\nu}_{t} \\ -{\rm{i}} & 0 & 0 & 0 & 0 & 0 & 0 \\ 1 & 0 & 0 & 0 & 0 & 0 & 0 \\ 0 & 1 & 0 & 0 & 0 & 0 & 0 \\ 0 & 0 & 1 & 0 & 0 & 0 & 0 \\ \end{bmatrix}, \end{gather}
with  $\boldsymbol {\mathcal {C}}$ and
 $\boldsymbol {\mathcal {E}}$ being
 $$\begin{gather} \boldsymbol{\mathcal{C}}={-}{\rm{i}}\omega+\boldsymbol{\bar{u}}\boldsymbol{\mathcal{D}}_x+\boldsymbol{\bar{v}}\boldsymbol{\mathcal{D}}_y+\boldsymbol{\bar{w}}\boldsymbol{\mathcal{D}}_z-\left(\frac{1}{\textit{Re}}+\boldsymbol{\nu}_{t}\right)(\boldsymbol{\mathcal{D}}_{yy}+\boldsymbol{\mathcal{D}}_{zz}+\boldsymbol{\mathcal{D}}_{xx})\nonumber\\ -\boldsymbol{\nu}_{tx}\boldsymbol{\mathcal{D}}_x-\boldsymbol{\nu}_{ty}\boldsymbol{\mathcal{D}}_y-\boldsymbol{\nu}_{tz}\boldsymbol{\mathcal{D}}_z \end{gather}$$
 $$\begin{gather}\boldsymbol{\mathcal{E}}={-}{\rm{i}}\boldsymbol{\bar{u}}+2{\rm{i}}\left(\frac{1}{\textit{Re}}+\boldsymbol{\nu}_{t}\right)\boldsymbol{\mathcal{D}}_x+{\rm{i}}\boldsymbol{\nu}_{tx}. \end{gather}$$
Appendix D. Adjoint LSA operator
The  $x-$momentum equation is shown as an example of the derivation procedure. By premultiplying the equation by the adjoint eigenvector (4.22), the left-hand side can be written as
 \begin{align} &\iint\left(\boldsymbol{\hat{u}^{\dagger}}\right)^H[-{\rm{i}}\omega+\boldsymbol{\bar{u}}(\boldsymbol{\mathcal{D}}_x+{\rm{i}}\alpha)+\boldsymbol{\bar{v}}\boldsymbol{\mathcal{D}}_y+\boldsymbol{\bar{w}}\boldsymbol{\mathcal{D}}_z-(1/\textit{Re}+\boldsymbol{\nu}_{t})(\boldsymbol{\mathcal{D}}_{yy}+\boldsymbol{\mathcal{D}}_{zz}+\boldsymbol{\mathcal{D}}_{xx}+2{\rm{i}}\alpha\boldsymbol{\mathcal{D}}_{x}-\alpha^2)\nonumber\\ & \quad -\boldsymbol{\nu}_{tx}(\boldsymbol{\mathcal{D}}_x+{\rm{i}}\alpha)-\boldsymbol{\nu}_{ty}\boldsymbol{\mathcal{D}}_y-\boldsymbol{\nu}_{tz}\boldsymbol{\mathcal{D}}_z+\boldsymbol{\bar{u}}_x-\boldsymbol{\nu}_{tx}\boldsymbol{\mathcal{D}}_x-{\rm{i}}\alpha\boldsymbol{\nu}_{tx}]\left(\boldsymbol{\hat{u}}\right)\,{{\rm d}}y\,{{\rm d}}z \nonumber\\ &\quad+ \iint\left(\boldsymbol{\hat{u}^{\dagger}}\right)^H\left(\boldsymbol{\bar{u}}_y-\boldsymbol{\nu}_{ty}\boldsymbol{\mathcal{D}}_x-{\rm{i}}\alpha\boldsymbol{\nu}_{ty}\right)\left(\boldsymbol{\hat{v}}\right)\,{{\rm d}}y\,{{\rm d}}z+\iint\left(\boldsymbol{\hat{u}^{\dagger}}\right)^H\left(\boldsymbol{\bar{u}}_z-\boldsymbol{\nu}_{tz}\boldsymbol{\mathcal{D}}_x-{\rm{i}}\alpha\boldsymbol{\nu}_{tz}\right)\left(\boldsymbol{\hat{w}}\right)\,{{\rm d}}y\,{{\rm d}}z \nonumber\\ & \quad +\iint\left(\boldsymbol{\hat{u}^{\dagger}}\right)^H\left(\boldsymbol{\mathcal{D}}_x+{\rm{i}}\alpha\right)\left(\boldsymbol{\hat{p}}\right)\,{{\rm d}}y\,{{\rm d}}z . \end{align}
We then present the integration-by-parts procedures for different types of terms in the equation for simplification. From a mathematical point of view, we can categorize terms in the equation based on whether they have a derivative matrix acting on the state vector. For terms that do not have a derivative matrix acting on the state vector, we have
 \begin{equation} \iint\left(\boldsymbol{\hat{u}^{\dagger}}\right)^H\left[{\rm{i}}\alpha\boldsymbol{\bar{u}}\right]\left(\boldsymbol{\hat{u}}\right)\,{{\rm d}}y\,{{\rm d}}z= \iint\left(-{\rm{i}}\alpha^\ast\boldsymbol{\bar{u}}\boldsymbol{\hat{u}^{\dagger}}\right)^H\left(\boldsymbol{\hat{u}}\right)\,{{\rm d}}y\,{{\rm d}}z. \end{equation}
If the first derivative matrix  $\boldsymbol {\mathcal {D}}_y$ acts on the state vector
 \begin{equation} \iint\left(\boldsymbol{\hat{u}^{\dagger}}\right)^H\left[\boldsymbol{\bar{v}}\boldsymbol{\mathcal{D}}_y\right]\left(\boldsymbol{\hat{u}}\right)\,{{\rm d}}y\,{{\rm d}}z={-}\iint\left(\boldsymbol{\mathcal{D}}_y\boldsymbol{\bar{v}}\boldsymbol{\hat{u}^{\dagger}}\right)^H\left(\boldsymbol{\hat{u}}\right)\,{{\rm d}}y\,{{\rm d}}z+\oint\left(\boldsymbol{\bar{v}}\boldsymbol{\hat{u}^{\dagger}}\right)^H\left(\boldsymbol{\hat{u}}\right)\,{{\rm d}}z. \end{equation}
This procedure will leave a boundary term which will have to be cancelled. Also, for  $\boldsymbol {\mathcal {D}}_z$,
 \begin{align} \iint\left(\boldsymbol{\hat{u}^{\dagger}}\right)^H\left[\boldsymbol{\bar{w}}\boldsymbol{\mathcal{D}}_z\right]\left(\boldsymbol{\hat{u}}\right)\,{{\rm d}}y\,{{\rm d}}z={-}\iint\left(\boldsymbol{\mathcal{D}}_z\boldsymbol{\bar{w}}\boldsymbol{\hat{u}^{\dagger}}\right)^H\left(\boldsymbol{\hat{u}}\right)\,{{\rm d}}y\,{{\rm d}}z-\oint\left(\boldsymbol{\bar{w}}\boldsymbol{\hat{u}^{\dagger}}\right)^H\left(\boldsymbol{\hat{u}}\right)\,{{\rm d}}y. \end{align}
For  $\boldsymbol {\mathcal {D}}_x$, the form
 $\boldsymbol {\mathcal {D}}_x=-\tan \boldsymbol {\theta }\boldsymbol {\mathcal {D}}_y-\tan \boldsymbol {\gamma }\boldsymbol {\mathcal {D}}_z$ has to be taken back for the integration-by-parts procedure. Here, for simplification, we refer to
 $\boldsymbol {a}=-\tan \boldsymbol {\theta }$ and
 $\boldsymbol {b}=-\tan \boldsymbol {\gamma }$. Then we have
 $$\begin{align}
&\iint\left(\boldsymbol{\hat{u}^{\dagger}}\right)^H\left[\boldsymbol{\bar{u}}\boldsymbol{\mathcal{D}}_x\right]\left(\boldsymbol{\hat{u}}\right)\,{{\rm
d}}y\,{{\rm d}}z=
\iint\left(\boldsymbol{\hat{u}^{\dagger}}\right)^H\left[\boldsymbol{\bar{u}}\boldsymbol{a}\boldsymbol{\mathcal{D}}_y+\boldsymbol{\bar{u}}\boldsymbol{b}\boldsymbol{\mathcal{D}}_z\right]\left(\boldsymbol{\hat{u}}\right)\,{{\rm
d}}y\,{{\rm d}}z\nonumber\\
&\quad ={-}\iint\left[\left(\boldsymbol{\mathcal{D}}_y\boldsymbol{a}\boldsymbol{\bar{u}}+\boldsymbol{\mathcal{D}}_z\boldsymbol{b}\boldsymbol{\bar{u}}\right)\boldsymbol{\hat{u}^{\dagger}}\right]^H\left(\boldsymbol{\hat{u}}\right)\,{{\rm
d}}y\,{{\rm
d}}z+\oint\left(\boldsymbol{a}\boldsymbol{\bar{u}}\boldsymbol{\hat{u}^{\dagger}}\right)^H\left(\boldsymbol{\hat{u}}\right)\,{{\rm
d}}z-\oint\left(\boldsymbol{b}\boldsymbol{\bar{u}}\boldsymbol{\hat{u}^{\dagger}}\right)^H\left(\boldsymbol{\hat{u}}\right)\,{{\rm
d}}y. \end{align}$$
Similarly, for all second derivative matrices
 \begin{align}
&\iint\left(\boldsymbol{\hat{u}^{\dagger}}\right)^H\left[\boldsymbol{\nu}_t\boldsymbol{\mathcal{D}}_{yy}\right]\left(\boldsymbol{\hat{u}}\right)\,{{\rm d}}y\,{{\rm d}}z= \iint\left(\boldsymbol{\mathcal{D}}_{yy}\boldsymbol{\nu}_t\boldsymbol{\hat{u}^{\dagger}}\right)^H\left(\boldsymbol{\hat{u}}\right)\,{{\rm d}}y\,{{\rm d}}z\nonumber\\
&\qquad +\oint\left[\left(\boldsymbol{\nu}_t\boldsymbol{\hat{u}^{\dagger}}\right)^H\left(\boldsymbol{\mathcal{D}}_y\boldsymbol{\hat{u}}\right)-\left(\boldsymbol{\mathcal{D}}_y\boldsymbol{\nu}_t\boldsymbol{\hat{u}^{\dagger}}\right)^H\left(\boldsymbol{\hat{u}}\right)\right]\,{{\rm d}}z,
\end{align}
 \begin{align}
&\iint\left(\boldsymbol{\hat{u}^{\dagger}}\right)^H\left[\boldsymbol{\nu}_t\boldsymbol{\mathcal{D}}_{zz}\right]\left(\boldsymbol{\hat{u}}\right)\,{{\rm d}}y\,{{\rm d}}z= \iint\left(\boldsymbol{\mathcal{D}}_{zz}\boldsymbol{\nu}_t\boldsymbol{\hat{u}^{\dagger}}\right)^H\left(\boldsymbol{\hat{u}}\right)\,{{\rm d}}y\,{{\rm d}}z\nonumber\\
&\qquad -\oint\left[\left(\boldsymbol{\nu}_t\boldsymbol{\hat{u}^{\dagger}}\right)^H\left(\boldsymbol{\mathcal{D}}_z\boldsymbol{\hat{u}}\right)-\left(\boldsymbol{\mathcal{D}}_z\boldsymbol{\nu}_t\boldsymbol{\hat{u}^{\dagger}}\right)^H\left(\boldsymbol{\hat{u}}\right)\right]\,{{\rm
d}}y,\end{align}
 \begin{align}
&\iint\left(\boldsymbol{\hat{u}^{\dagger}}\right)^H\left[\boldsymbol{\nu}_t\boldsymbol{\mathcal{D}}_{xx}\right]\left(\boldsymbol{\hat{u}}\right)\,{{\rm d}}y\,{{\rm d}}z=\iint\left(\boldsymbol{\hat{u}^{\dagger}}\right)^H\left[\boldsymbol{\nu}_t\boldsymbol{a}^2\boldsymbol{\mathcal{D}}_{yy}+2\boldsymbol{\nu}_t\boldsymbol{ab}\boldsymbol{\mathcal{D}}_{y}\boldsymbol{\mathcal{D}}_{z}+\boldsymbol{\nu}_t\boldsymbol{b}^2\boldsymbol{\mathcal{D}}_{zz}\right]\left(\boldsymbol{\hat{u}}\right)\,{{\rm d}}y\,{{\rm d}}z\nonumber\\
&\quad = \iint\left[\left(\boldsymbol{\mathcal{D}}_{yy}\boldsymbol{a}^2\boldsymbol{\nu}_t+2\boldsymbol{\mathcal{D}}_{y}\boldsymbol{\mathcal{D}}_{z}\boldsymbol{ab}\boldsymbol{\nu}_t+\boldsymbol{\mathcal{D}}_{zz}\boldsymbol{b}^2\boldsymbol{\nu}_t\right)\boldsymbol{\hat{u}^{\dagger}}\right]^H\left(\boldsymbol{\hat{u}}\right)\,{{\rm d}}y\,{{\rm d}}z\nonumber\\
&\qquad + \oint\left[\left(\boldsymbol{a}^2\boldsymbol{\nu}_t\boldsymbol{\hat{u}^{\dagger}}\right)^H\left(\boldsymbol{\mathcal{D}}_y\boldsymbol{\hat{u}}\right)-\left(\boldsymbol{\mathcal{D}}_y\boldsymbol{a}^2\boldsymbol{\nu}_t\boldsymbol{\hat{u}^{\dagger}}\right)^H\left(\boldsymbol{\hat{u}}\right)+2\left(\boldsymbol{ab}\boldsymbol{\nu}_t\boldsymbol{\hat{u}^{\dagger}}\right)^H\left(\boldsymbol{\mathcal{D}}_z\boldsymbol{\hat{u}}\right)\right]\,{{\rm d}}z\nonumber\\
&\qquad - \oint\left[\left(\boldsymbol{b}^2\boldsymbol{\nu}_t\boldsymbol{\hat{u}^{\dagger}}\right)^H\left(\boldsymbol{\mathcal{D}}_z\boldsymbol{\hat{u}}\right)-\left(\boldsymbol{\mathcal{D}}_z\boldsymbol{b}^2\boldsymbol{\nu}_t\boldsymbol{\hat{u}^{\dagger}}\right)^H\left(\boldsymbol{\hat{u}}\right)-2\left(\boldsymbol{\mathcal{D}}_y\boldsymbol{ab}\boldsymbol{\nu}_t\boldsymbol{\hat{u}^{\dagger}}\right)^H\left(\boldsymbol{\hat{u}}\right)\right]\,{{\rm d}}y.
\end{align}
By applying these procedures to all terms in (D1) and rearranging, the adjoint operators  $\boldsymbol {\mathcal {A}^{\dagger} }$ and
 $\boldsymbol {\mathcal {B}^{\dagger} }$ can be written as
 \begin{gather} \boldsymbol{\mathcal{A}^{\dagger}}=\begin{bmatrix} \boldsymbol{\mathcal{C}^{\dagger}}+\boldsymbol{\bar{u}}_x+(\boldsymbol{\mathcal{D}}_y\boldsymbol{a}+\boldsymbol{\mathcal{D}}_z\boldsymbol{b})\boldsymbol{\nu}_{tx} & \boldsymbol{\bar{v}}_x+\boldsymbol{\mathcal{D}}_y\boldsymbol{\nu}_{tx} & \boldsymbol{\bar{w}}_x+\boldsymbol{\mathcal{D}}_z\boldsymbol{\nu}_{tx} & -\boldsymbol{\mathcal{D}}_y\boldsymbol{a}-\boldsymbol{\mathcal{D}}_z\boldsymbol{b} & 0 & 0 & 0 \\ \boldsymbol{\bar{u}}_y+(\boldsymbol{\mathcal{D}}_y\boldsymbol{a}+\boldsymbol{\mathcal{D}}_z\boldsymbol{b})\boldsymbol{\nu}_{ty} & \boldsymbol{\mathcal{C}^{\dagger}}+\boldsymbol{\bar{v}}_y+\boldsymbol{\mathcal{D}}_y\boldsymbol{\nu}_{ty} & \boldsymbol{\bar{w}}_y+\boldsymbol{\mathcal{D}}_z\boldsymbol{\nu}_{ty} & -\boldsymbol{\mathcal{D}}_y & 0 & 0 & 0 \\ \boldsymbol{\bar{u}}_z+(\boldsymbol{\mathcal{D}}_y\boldsymbol{a}+\boldsymbol{\mathcal{D}}_z\boldsymbol{b})\boldsymbol{\nu}_{tz} & \boldsymbol{\bar{v}}_z+\boldsymbol{\mathcal{D}}_y\boldsymbol{\nu}_{tz} & \boldsymbol{\mathcal{C}^{\dagger}}+\boldsymbol{\bar{w}}_z+\boldsymbol{\mathcal{D}}_z\boldsymbol{\nu}_{tz} & -\boldsymbol{\mathcal{D}}_z & 0 & 0 & 0 \\ -\boldsymbol{\mathcal{D}}_y\boldsymbol{a}-\boldsymbol{\mathcal{D}}_z\boldsymbol{b} & -\boldsymbol{\mathcal{D}}_y & -\boldsymbol{\mathcal{D}}_z & 0 & 0 & 0 & 0 \\ 0 & 0 & 0 & 0 & 1 & 0 & 0 \\ 0 & 0 & 0 & 0 & 0 & 1 & 0 \\ 0 & 0 & 0 & 0 & 0 & 0 & 1 \\ \end{bmatrix}, \end{gather}
 \begin{gather} \boldsymbol{\mathcal{B}^{\dagger}}=\begin{bmatrix} \boldsymbol{\mathcal{E}^{\dagger}}-{\rm{i}}\boldsymbol{\nu}_{tx} & 0 & 0 & {\rm{i}} & -1/\textit{Re}-\boldsymbol{\nu}_{t} & 0 & 0 \\ -{\rm{i}}\boldsymbol{\nu}_{ty} & \boldsymbol{\mathcal{E}^{\dagger}} & 0 & 0 & 0 & -1/\textit{Re}-\boldsymbol{\nu}_{t} & 0 \\ -{\rm{i}}\boldsymbol{\nu}_{tz} & 0 & \boldsymbol{\mathcal{E}^{\dagger}} & 0 & 0 & 0 & -1/\textit{Re}-\boldsymbol{\nu}_{t} \\ {\rm{i}} & 0 & 0 & 0 & 0 & 0 & 0 \\ 1 & 0 & 0 & 0 & 0 & 0 & 0 \\ 0 & 1 & 0 & 0 & 0 & 0 & 0 \\ 0 & 0 & 1 & 0 & 0 & 0 & 0 \\ \end{bmatrix}, \end{gather}
with  $\boldsymbol {\mathcal {C}^{\dagger} }$ and
 $\boldsymbol {\mathcal {E}^{\dagger} }$ given the form
 \begin{gather}\begin{aligned}[b] \boldsymbol{\mathcal{C}^{\dagger}}&={\rm{i}}\omega^\ast{-}\boldsymbol{\mathcal{D}}_y\boldsymbol{a}\boldsymbol{\bar{u}}-\boldsymbol{\mathcal{D}}_z\boldsymbol{b}\boldsymbol{\bar{u}}-\boldsymbol{\mathcal{D}}_y\boldsymbol{\bar{v}}-\boldsymbol{\mathcal{D}}_z\boldsymbol{\bar{w}}-\boldsymbol{\mathcal{D}}_{yy}\left(\frac{1}{\textit{Re}}+\boldsymbol{\nu}_t\right)-\boldsymbol{\mathcal{D}}_{zz}\left(\frac{1}{\textit{Re}}+\boldsymbol{\nu}_t\right)\\ &\quad -\left(\boldsymbol{\mathcal{D}}_{yy}\boldsymbol{a}^2+2\boldsymbol{\mathcal{D}}_{y}\boldsymbol{\mathcal{D}}_{z}\boldsymbol{ab}+\boldsymbol{\mathcal{D}}_{zz}\boldsymbol{b}^2\right)\left(\frac{1}{\textit{Re}}+\boldsymbol{\nu}_t\right)+\boldsymbol{\mathcal{D}}_y\boldsymbol{a}\boldsymbol{\nu}_{tx}+\boldsymbol{\mathcal{D}}_z\boldsymbol{b}\boldsymbol{\nu}_{tx}\\ &\quad +\boldsymbol{\mathcal{D}}_y\boldsymbol{\nu}_{ty}+\boldsymbol{\mathcal{D}}_z\boldsymbol{\nu}_{tz} \end{aligned}\end{gather}
 \begin{gather} \boldsymbol{\mathcal{E}^{\dagger}}={\rm{i}}\boldsymbol{\bar{u}}+2{\rm{i}}(\boldsymbol{\mathcal{D}}_y\boldsymbol{a}+\boldsymbol{\mathcal{D}}_z\boldsymbol{b})\left(\frac{1}{\textit{Re}}+\boldsymbol{\nu}_t\right)-{\rm{i}}\boldsymbol{\nu}_{tx}. \end{gather}
The boundary terms should then be cancelled by applying appropriate adjoint boundary conditions. The expression for the boundary terms on side boundaries is
 \begin{align}
&\oint\left(\boldsymbol{a}\boldsymbol{\bar{u}}\boldsymbol{\hat{u}^{\dagger}}\right)^H\boldsymbol{\hat{u}}\,{{\rm
d}}z+\oint\left(\boldsymbol{\bar{v}}\boldsymbol{\hat{u}^{\dagger}}\right)^H\boldsymbol{\hat{u}}\,{{\rm
d}}z-\oint\left[\left(\left(\frac{1}{\textit{Re}}+\boldsymbol{\nu}_t\right)\boldsymbol{\hat{u}^{\dagger}}\right)^H\boldsymbol{\mathcal{D}}_y\boldsymbol{\hat{u}}-\left(\boldsymbol{\mathcal{D}}_y\left(\frac{1}{\textit{Re}}+\boldsymbol{\nu}_t\right)\boldsymbol{\hat{u}^{\dagger}}\right)^H\boldsymbol{\hat{u}}\right]\,{{\rm
d}}z\nonumber\\ &\quad -
\oint\left[\left(\boldsymbol{a}^2\left(\frac{1}{\textit{Re}}+\boldsymbol{\nu}_t\right)\boldsymbol{\hat{u}^{\dagger}}\right)^H\boldsymbol{\mathcal{D}}_y\boldsymbol{\hat{u}}-\left(\boldsymbol{\mathcal{D}}_y\boldsymbol{a}^2\left(\frac{1}{\textit{Re}}+\boldsymbol{\nu}_t\right)\boldsymbol{\hat{u}^{\dagger}}\right)^H\boldsymbol{\hat{u}}+2\left(\boldsymbol{ab}\left(\frac{1}{\textit{Re}}+\boldsymbol{\nu}_t\right)\boldsymbol{\hat{u}^{\dagger}}\right)^H\boldsymbol{\mathcal{D}}_z\boldsymbol{\hat{u}}\right]\,{{\rm
d}}z\nonumber\\ &\quad-2
{\rm{i}}\alpha^\ast\oint\left(\boldsymbol{a}\boldsymbol{\hat{u}^{\dagger}}\right)^H\boldsymbol{\hat{u}}\,{{\rm
d}}z-\oint\left(\boldsymbol{a}\boldsymbol{\nu}_{tx}\boldsymbol{\hat{u}^{\dagger}}\right)^H\boldsymbol{\hat{u}}\,{{\rm
d}}z-\oint\left(\boldsymbol{\nu}_{ty}\boldsymbol{\hat{u}^{\dagger}}\right)^H\boldsymbol{\hat{u}}\,{{\rm
d}}z-\oint\left(\boldsymbol{a}\boldsymbol{\nu}_{tx}\boldsymbol{\hat{u}^{\dagger}}\right)^H\boldsymbol{\hat{u}}\,{{\rm
d}}z\nonumber\\ &\quad -
\oint\left(\boldsymbol{a}\boldsymbol{\nu}_{ty}\boldsymbol{\hat{u}^{\dagger}}\right)^H\boldsymbol{\hat{v}}\,{{\rm
d}}z-\oint\left(\boldsymbol{a}\boldsymbol{\nu}_{tz}\boldsymbol{\hat{u}^{\dagger}}\right)^H\boldsymbol{\hat{w}}\,{{\rm
d}}z+\oint\left(\boldsymbol{a}\boldsymbol{\hat{u}^{\dagger}}\right)^H\boldsymbol{\hat{p}}\,{{\rm
d}}z , \end{align}
and on vertical boundaries is
 \begin{align}
&-\oint\left(\boldsymbol{b}\boldsymbol{\bar{u}}\boldsymbol{\hat{u}^{\dagger}}\right)^H\boldsymbol{\hat{u}}\,{{\rm
d}}y-\oint\left(\boldsymbol{\bar{w}}\boldsymbol{\hat{u}^{\dagger}}\right)^H\boldsymbol{\hat{u}}\,{{\rm
d}}y+\oint\left[\left(\left(\frac{1}{\textit{Re}}+\boldsymbol{\nu}_t\right)\boldsymbol{\hat{u}^{\dagger}}\right)^H\boldsymbol{\mathcal{D}}_z\boldsymbol{\hat{u}}-\left(\boldsymbol{\mathcal{D}}_z\left(\frac{1}{\textit{Re}}+\boldsymbol{\nu}_t\right)\boldsymbol{\hat{u}^{\dagger}}\right)^H\boldsymbol{\hat{u}}\right]\,{{\rm
d}}y\nonumber\\ &\quad +
\oint\left[\left(\boldsymbol{b}^2\left(\frac{1}{\textit{Re}}+\boldsymbol{\nu}_t\right)\boldsymbol{\hat{u}^{\dagger}}\right)^H\boldsymbol{\mathcal{D}}_z\boldsymbol{\hat{u}}-\left(\boldsymbol{\mathcal{D}}_z\boldsymbol{b}^2\left(\frac{1}{\textit{Re}}+\boldsymbol{\nu}_t\right)\boldsymbol{\hat{u}^{\dagger}}\right)^H\boldsymbol{\hat{u}}-2\left(\boldsymbol{\mathcal{D}}_y\boldsymbol{ab}\left(\frac{1}{\textit{Re}}+\boldsymbol{\nu}_t\right)\boldsymbol{\hat{u}^{\dagger}}\right)^H\boldsymbol{\hat{u}}\right]\,{{\rm
d}}y\nonumber\\ &\quad +2
{\rm{i}}\alpha^\ast\oint\left(\boldsymbol{b}\boldsymbol{\hat{u}^{\dagger}}\right)^H\boldsymbol{\hat{u}}\,{{\rm
d}}y+\oint\left(\boldsymbol{b}\boldsymbol{\nu}_{tx}\boldsymbol{\hat{u}^{\dagger}}\right)^H\boldsymbol{\hat{u}}\,{{\rm
d}}y+\oint\left(\boldsymbol{\nu}_{tz}\boldsymbol{\hat{u}^{\dagger}}\right)^H\boldsymbol{\hat{u}}\,{{\rm
d}}y+\oint\left(\boldsymbol{b}\boldsymbol{\nu}_{tx}\boldsymbol{\hat{u}^{\dagger}}\right)^H\boldsymbol{\hat{u}}\,{{\rm
d}}y\nonumber\\ &\quad +
\oint\left(\boldsymbol{b}\boldsymbol{\nu}_{ty}\boldsymbol{\hat{u}^{\dagger}}\right)^H\boldsymbol{\hat{v}}\,{{\rm
d}}y+\oint\left(\boldsymbol{b}\boldsymbol{\nu}_{tz}\boldsymbol{\hat{u}^{\dagger}}\right)^H\boldsymbol{\hat{w}}\,{{\rm
d}}y-\oint\left(\boldsymbol{b}\boldsymbol{\hat{u}^{\dagger}}\right)^H\boldsymbol{\hat{p}}\,{{\rm
d}}y. \end{align}
Although these expressions are given in huge forms, they can be much simplified since the adjoint mode only needs to be computed in the near-wake region. Therefore, we can consider all direct and adjoint perturbations on the far-field boundaries to be zero, then, only the boundary terms on  $y/W=0$ and
 $z/W=0$ should be further considered. On
 $y/W=0$ we have the following conditions and (D13) can be simplified into:
 $$\begin{gather} \boldsymbol{a}=\boldsymbol{\bar{v}}=\boldsymbol{\nu}_{ty}=\boldsymbol{\hat{u}}_y=0, \quad {\rm{on}} \ y/W=0 \end{gather}$$
 $$\begin{gather}\oint\left[\left(\frac{1}{\textit{Re}}+\boldsymbol{\nu}_t\right)\boldsymbol{\mathcal{D}}_y\boldsymbol{\hat{u}^{\dagger}}\right]^H\boldsymbol{\hat{u}}\,{{\rm d}}z , \end{gather}$$
and on  $z/W=0$ these conditions can be applied with (D14) can be simplified into
 $$\begin{gather} \boldsymbol{b}=\boldsymbol{\bar{w}}=\boldsymbol{\hat{u}}=0, \quad {\rm{on}} \ z/W=0, \end{gather}$$
 $$\begin{gather}\oint\left[\left(\frac{1}{\textit{Re}}+\boldsymbol{\nu}_t\right)\boldsymbol{\hat{u}^{\dagger}}\right]^H\boldsymbol{\mathcal{D}}_z\boldsymbol{\hat{u}}\,{{\rm d}}z. \end{gather}$$
Therefore, all adjoint boundary conditions appropriate to cancel the boundary terms are summarized as follows:
 $$\begin{gather} \frac{\partial{\boldsymbol{\hat{u}^{\dagger}}}}{\partial{y}}=\frac{\partial{\boldsymbol{\hat{w}^{\dagger}}}}{\partial{y}}=\frac{\partial{\boldsymbol{\hat{p}^{\dagger}}}}{\partial{y}}=0,\boldsymbol{\hat{v}^{\dagger}}=0, \quad {\rm{on}} \ y/W=0, \end{gather}$$
 $$\begin{gather}\boldsymbol{\hat{u}^{\dagger}}=\boldsymbol{\hat{v}^{\dagger}}=\boldsymbol{\hat{w}^{\dagger}}=\boldsymbol{\hat{p}^{\dagger}}=0, \quad {\rm{on}} \ y/W=1.3, \end{gather}$$
 $$\begin{gather}\boldsymbol{\hat{u}^{\dagger}}=\boldsymbol{\hat{v}^{\dagger}}=\boldsymbol{\hat{w}^{\dagger}}=0,\frac{\partial{\boldsymbol{\hat{p}^{\dagger}}}}{\partial{z}}=0, \quad {\rm{on}} \ z/W=0, \end{gather}$$
 $$\begin{gather}\boldsymbol{\hat{u}^{\dagger}}=\boldsymbol{\hat{v}^{\dagger}}=\boldsymbol{\hat{w}^{\dagger}}=\boldsymbol{\hat{p}^{\dagger}}=0, \quad {\rm{on}}\ z/W=1.3. \end{gather}$$
To validate the adjoint operators and boundary conditions, we take the conjugation of the complex streamwise wavenumber of the adjoint mode computed based on the adjoint method and compare it with the results from the direct approach, as shown in figure 15(e,f). The comparisons are shown in figure 23. Good agreement can be observed between the two approaches, with discrepancies being observed only downstream of 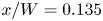 $x/W=0.135$. This is due to the fact that, downstream of this streamwise location, the adjoint eigenvalue is quite far from the real axis, which would lead to a convergence issue of the eigenvalue problem. At locations around the wavemaker regions, the two lines are almost identical, which confirms that the adjoint operators and boundary conditions presented in this paper can provide accurate prediction of the adjoint mode and, subsequently, the structural sensitivity.
Local complex streamwise wavenumber of the adjoint mode based on direct LNS equation (black solid line), and its complex conjugation based on adjoint LNS equation (red dashed line). (a) The real component. (b) The imaginary component.



