I. INTRODUCTION
Microelectromechanical systems (MEMS) have been used in a wide range of applications, from pressure sensors and accelerometers to microphones and digital displays. In 2006, STMicroelectronics and Nintendo revolutionized the entire MEMS industry through the launch of the Nintendo Wii gaming console that uses 3D MEMS accelerometers for motion control. Reference Ross1 Since then, MEMS devices have been routinely incorporated into consumer electronics from smart phones to tablet PCs. In 2010, the MEMS industry experienced a 25% growth with the top four MEMS suppliers (Texas Instruments, Hewlett-Packard, Robert Bosch, and STMicroelectronics) increasing MEMS sales by 37%. Reference Leroy2 Years of materials research have led to the current pro in MEMS technology. Search results return over 100,000 journal articles and books that have been written on piezoelectric thin films, one of the types of materials used in MEMS devices for microscale actuation.
The material used in this study, lead zirconate titanate [Pb(Zr x Ti1−x )O3, PZT] whose properties have been studied since the 1950s exhibits large piezoelectric coefficients and coupling factors in thin films Reference Trolier-McKinstry and Muralt3 and is the most widely used piezoelectric bulk ceramic with ferroelectric properties. Recently, a Pb(Mg1/3Nb2/3)O3–PbTiO3 [PMN-PT] thin film has demonstrated the largest reported thin film piezoelectric coefficient, e 31,f = −27 ± 3 C/m2 (Ref. Reference Baek, Park, Kim, Aksyuk, Das, Bu, Felker, Lettieri, Vaithyanathan, Bharadwaja, Bassiri-Gharb, Chen, Sun, Folkman, Jang, Kreft, Streiffer, Ramesh, Pan, Trolier-McKinstry, Schlom, Rzchowski, Blick and Eom4). Thin films of PZT are used to create large force, large displacement actuators such as actuators for RF switches Reference Polcawich, Pulskamp, Judy, Ranade, Trolier-McKinstry and Dubey5 and relays, Reference Proie, Polcawich, Pulskamp, Ivanov and Zaghloul6 mobility actuators to create mm-scale robotics, Reference Bronson, Pulskamp, Polcawich, Kroninger and Wetzel7 and inkjet print heads. Reference Takahashi and Suzuki8 The piezoelectric coefficient of PZT is inherently linked to its crystalline quality Reference Muralt, Maeder, Sagalowicz, Hiboux, Scalese, Naumovic, Agostino, Xanthopoulos, Mathieu, Patthey and Bullock9 with the highest magnitude piezoelectric coefficients observed at the morphotropic phase boundary (MPB), where the crystal structure changes abruptly between the tetragonal and rhombohedral symmetry. Reference Jaffe, Roth and Marzullo10 The MPB is located approximately at PbZr0.52Ti0.48O3, or PZT (52/48), and is the composition in which both the dielectric permittivity and piezoelectric coefficients reach a maximum. Reference Damjanovic11
In thin film form, the composition and the crystalline texture must be controlled to achieve the maximum piezoelectric coefficients. For PZT (52/48), the highest coefficients are reported for a {001} crystalline texture. Reference Trolier-McKinstry and Muralt3 The research reported in this article is focused on achieving highly {001}-textured PZT (52/48) through seed layer templates and process optimizations. Proper control of the crystalline texture allows an increase in the piezoelectric stress constant as demonstrated by Ledermann et al. Reference Ledermann, Muralt, Baborowski, Gentil, Mukati, Cantoni, Seifert and Setter12 who showed a nearly 60% increase in e 31,f for (100)-oriented PZT (52/48) compared with randomly oriented PZT (52/48). In recent years, there has been research on the optimization of PZT properties to suit the needs of specific device performance in the form of substrate optimizations, Reference Shelton, Kotula, Brennecka, Lam, Meyer, Maria, Gibbons and Ihlefeld13–Reference Trupina, Miclea, Amarande and Cioangher15 the novel use of PZT nanowires, Reference Bai, Xu, Gu, Ma, Qin and Wang16,Reference Tang, Lin and Sodano17 as well as studies on the electrical properties of PZT composites. Reference Benčan, Malič, Drnovšek, Tellier, Rojac, Pavlič, Kosec, Webber, Rödel and Damjanovi&ccaron18,Reference Wang, Cao, Yuan, Zhao, Li, Zhang and Agathopoulos19 Such improvements in piezoelectric properties result in substantial improvements in device performance including lower actuation voltages, higher force actuation, and lower power consumption. Through the use of a chemical-solution-derived PbTiO3 (PTO) seed layer that was based on the work of Muralt et al., Reference Muralt, Maeder, Sagalowicz, Hiboux, Scalese, Naumovic, Agostino, Xanthopoulos, Mathieu, Patthey and Bullock9 in combination with optimal processing conditions for the PZT solution chemistry, platinum (Pt) electrode texture, and rapid thermal annealing (RTA) conditions of the PZT thin films, PZT(52/48) thin films having a {001} texture in excess of 95% were achieved.
II. EXPERIMENT
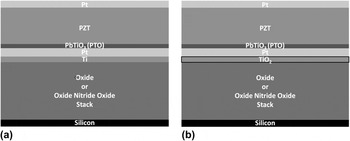
A 100-mm-diameter (100) silicon (Si) wafer was coated with 500 nm of thermally grown silicon dioxide (SiO2) thin film. Next, a bottom electrode was sputter-deposited onto the silicon dioxide using a Unaxis Clusterline 200 (CLC) deposition system. Initial test data involved a bottom electrode that consisted of a bi-layer of (200 Å) Ti/(850 Å) Pt (referred hereon as Ti/Pt), where both metal layers were sputter-deposited at 500 °C. Subsequent data involved improvements to this bottom electrode and are reported in Potrepka et al. Reference Potrepka, Fox, Sanchez and Polcawich20 (Fig. 1). The improved bottom electrode involved a 30-nm-thin layer of titanium (Ti) sputter-deposited at room temperature using the CLC deposition tool. After the Ti deposition, an oxygen anneal was performed at 750 °C in a Bruce Technologies tube furnace (North Billerica, MA), to convert Ti to TiO2. TiO2 acts as a seed layer for {111} Pt nucleation with a full width half maximum (FWHM) range of 1.7–2.3°. A 100-nm-thick Pt film was deposited at 500 °C using the CLC. It has been shown that highly {111}-textured Pt (referred hereon as TiO2/Pt) provides a template for {111} PZT-textured growth when PZT is applied onto Pt.
Wafer stack showing different layers. (a) Ti/Pt bottom electrode and (b) improved TiO2/Pt bottom electrode.

Chemical solution deposition (CSD) of the PbTiO3 seed layer, PTO hereon, and PZT (52/48) were used to deposit the piezoelectric thin films onto the metalized silicon substrates. CSD processing allows for stoichiometry control, reduced processing temperatures, and is relatively cost effective for development and mass production. The CSD solutions were prepared using a process modified from that originally described by Budd et al. Reference Budd, Dey and Payne21 and Zhou et al. Reference Zhou, Hong, Wolf and Trolier-McKinstry22
A 0.17 molar 30% lead (Pb)-excess PTO was prepared by mixing lead (III) acetate trihydrate from Puratronic (Wayne, PA) with 2-methoxyethanol (2-MOE) from Sigma Aldrich (St. Louis, MO). It was then refluxed for 20 min at 120 °C with flowing nitrogen (N2) in a Heidolph Laborata 4000 rotary evaporator (Schwaback, Germany). A vacuum distillation step was performed to remove impurities by lowering the pressure of the rotary evaporator to between 280 and 330 mbar, depending on humidity levels, until a white foam appears. Titanium (IV) isopropoxide (70 wt% in n-propanol) from Alfa Aesar (Ward Hill, MA) was mixed with 2-MOE and allowed to stir on a magnetic spinner while the Pb solution was refluxed and distilled. Once the Pb solution finished the vacuum distillation step, the Ti solution was combined with the Pb solution and was allowed to reflux for 210 min. A second vacuum distillation at 925 mbar was performed followed by a N2 purge. The solution was transferred to a storage container where 4 vol% formamide was slowly added to the solution to act as a drying control agent. The final solution was stirred overnight on a magnetic stirrer.
Preparing a 0.4 molar PZT solution required the same process as that used to make PTO. One difference was the amount of excess Pb in the PZT solution, which varied from 8 to 15 mol%. Additionally, the zirconium (IV) n-proproxide precursor from Alfa Aesar was added to the titanium (IV) isopropoxide and 2-MOE mixture. This mixture was allowed to stir while the Pb solution was refluxed and distilled. Both solutions were then combined in the glove box and the procedure described above was followed.
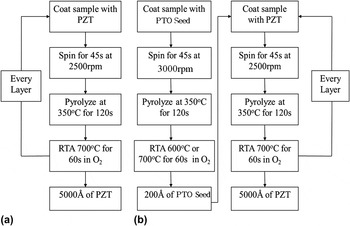
The PZT and PTO films were deposited via a CSD process using combinations of liquid dispensing the solution, wafer spinning, pyrolysis, and annealing (Fig. 2). To promote {001}-textured PZT growth, a single PTO seed layer, ∼170 Å, was deposited on the Pt-coated substrate. Using a 10 mL syringe filled with PTO solution, the solution is dispensed through a 0.1 μm filter onto the entire surface of a stationary {111}-textured Pt-coated substrate. The substrate was then spun with a Bidtec SP100 spin coater at a speed of 3000 rpm for 45 s. Next, a pyrolysis step was performed on a Wentworth Laboratories vacuum hot plate (Chicago, IL) at 350 °C for 2 min to remove a majority of the organic species creating a film with mid-range order. Reference Lakeman, Xu and Payne23 After pyrolysis, RTA of 700 °C with a ramp of 4 °C/s (Table VI) was performed to complete the crystallization step using an AG Associates Heatpulse 610 RTA (Santa Clara, CA). The same steps were repeated for the PZT (52/48) deposition except that a spin speed of 2500 rpm for 45 s was used to achieve a PZT thickness of ∼600 Å per layer.
The CSD process for (a) control samples without a PT seed layer and (b) test samples with the PT seed layer.

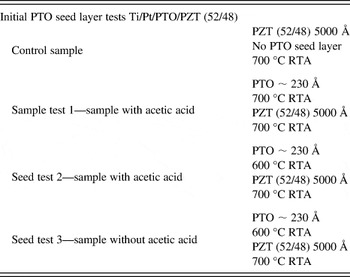
PTO test sample summary. Three main solutions and RTA conditions were tested, with and without acetic acid as well as an RTA final temperature of 600 °C or 700 °C.

III. RESULTS AND DISCUSSION
A. PTO seed layer on a Ti/Pt bottom electrode
The procedure to test the PTO required two different solutions, one with acetic acid and one without. Previous efforts reported improved properties in PTO solutions with an added 7 vol% acetic acid. Reference Trolier-McKinstry24 The acetic acid is added after the fabrication of the PTO solution, about 30 min before solution deposition; it assists in the reduction of lead loss during thermal treatments. Reference Chopra, Sharma, Goel and Mendiratta25
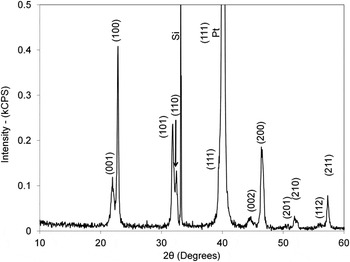
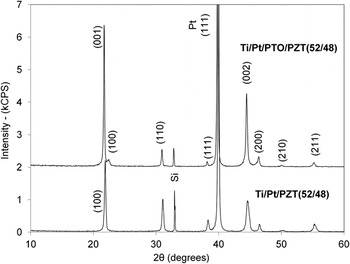
Following deposition of the PTO solution, the RTA conditions were examined (Table I) with temperatures ranging from 600 to 700 °C with dwell times of 60 s in an atmosphere of flowing O2 with a rate of 7 sccm. Following the PTO layer crystallization step, 5000 Å of PZT (52/48) was deposited using the same process described above (Fig. 2). The initial seed layer tests involved depositing PZT (52/48) thin films onto 25 cm square substrates. After deposition, 500 × 500 μm square capacitors were fabricated to measure the electrical properties as a function of the different PTO seed conditions as described in Ref. Reference Sanchez and Polcawich26 using a HP Multi-Frequency LCR Meter 4275A (Agilent, Santa Clara, CA) at 10 kHz with an excitation signal of 50 mV and a Radiant Technologies RT-66A measurement unit (Albuquerque, NM). The capacitors were poled with a poling voltage of 10 V on a ∼0.5-μm-thick film for 2–3 min prior to being measured. After examining the results, the two best PTO/PZT (52/48) conditions were chosen to fabricate cantilever arrays and thus determine the high field unipolar effective piezoelectric coefficient, e 31,eff, by measuring the quasistatic piezoelectric induced deformation of thin film cantilevers (Table III). Reference Polcawich, Pulskamp, Ghodssi and Lin27,Reference Oldham, Pulskamp, Polcawich and Dubey28 Initially, the different processing conditions were characterized by examining the crystallographic structure of the PZT thin films by using x-ray diffraction (XRD), collected on a Rigaku Ultima III Diffractometer (Tokyo, Japan) with Bragg-Brentano Optics. A mixed texture of {100} and random grain orientations were observed in a 2500 Å PTO thin film (Fig. 3) deposited on a Ti/Pt substrate. Although the 2500 Å thick PTO layer exhibits mix texture, the resulting PZT (with the 17-nm PTO seed layer) XRD data show significant improvement in {001} PZT (52/48) orientation (Fig. 4). Lotgering factor (f) calculations (Eq. 1) were performed using PZT peaks between 10 and 60° that demonstrated an improvement from f{100} = 59.24% texturing to 86.67% {100} texturing with the use of a PTO seed layer. Ideally, the preferred seed layer should consist of solely {001} PTO to achieve a pure {001} orientation in the PZT (52/48) film. Further optimization of the PTO seed is an area of improvement still under investigation.
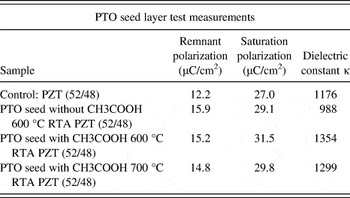
Summary of the ferroelectric and dielectric characterization on the eight 2.5 cm square test samples.

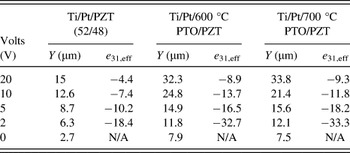
Cantilever displacement and the effective piezoelectric coefficient data (e 31,eff).

XRD data for 2500 Å PT thin film deposited onto a Si/SiO2/Ti/Pt substrate.

XRD of PZT (52/48) samples with and without the PT seed layer deposited onto Ti/Pt coated substrates.

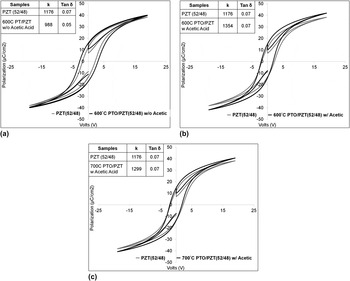
For the different growth conditions, very little change in the polarization–electric field hysteresis loops was observed (Fig. 5). Small subtle changes in the saturation polarization, remnant polarization, and coercive fields are attributed to sample variances and are within the assumed standard deviation for these measurements. In contrast, the dielectric properties for the different films (Table II) show more significant changes between the processing conditions. The two PTO films that were selected for additional testing were the 700 and 600 °C annealed samples with acetic acid mixed into the solution (Table I) due to their higher dielectric constants of 1299 and 1354, respectively.
Polarization–voltage hysteresis plot comparison of the control sample without PT to (a) 600 °C PT anneal without acetic acid, (b) 600 °C PT anneal with acetic acid, and (c) 700 °C PT anneal with acetic acid.

Comparison of PZT (52/48) with (001)/(100) Lotgering factors on Ti/Pt electrodes with 8% Pb-excess PZT (52/48)

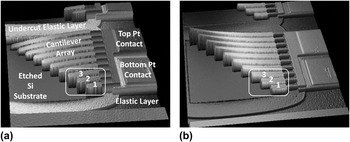
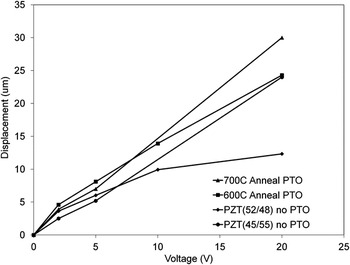
After selecting the PTO processing conditions, additional 100-mm wafers were processed with these seed layers to form cantilever arrays to measure the piezoelectric-induced displacement from the three smallest cantilevers (83, 107, and 132 μm lengths) in Fig. 6. In previous studies, higher piezoelectric coefficients have been noted in PZT (45/55) compared with PZT (52/48) when the films have {111} texture. Reference Trolier-McKinstry and Muralt3 Comparing cantilever displacement in samples with Ti/Pt/PZT (45/55) and Ti/Pt/PZT (52/48) without PTO demonstrates this once again. Adding the seed layer to the PZT(52/48) yields a near doubling of the displacement compared with the PZT (52/48) control sample without PTO (Fig. 7) and a 20% improvement over the PZT (45/55) control sample. The greatest improvement was observed in Ti/Pt/PTO (with acetic acid)/PZT (52/48) that was annealed at 700 °C. As a result, a 700 °C RTA was chosen for all subsequent experiments with the PTO seed layer. One additional note is that although the cantilevers were prepared with similar techniques and the cross-sections were very similar, the static deformations of the samples with the seed layers were dramatically different from the control sample (Fig. 7). The added texture component in the samples with the PTO seed alters the overall residual stress gradient resulting in a shift from a negative (in-wafer) curvature to a positive (out-of-wafer) curvature. This change is noted as it can have a dramatic influence on the functionality of certain MEMS devices.
3D images using optical profilometry of fabricated cantilever arrays. (a) PZT(45/55) on Ti/Pt electrode and (b) PZT(52/48) with PT seed on Ti/Pt electrode.

Cantilever static displacements as a function of voltage illustrating the effect of the PTO seed layer on PZT (52/48).

B. PTO seed layer tests using a Ti/Pt bottom electrode-PZT RTA conditions
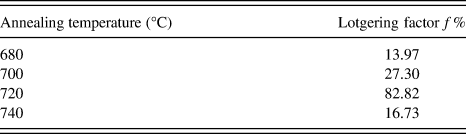
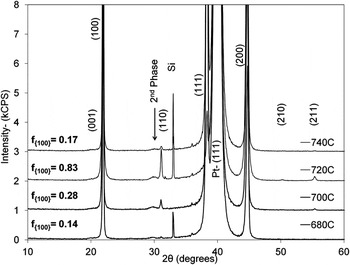
Changes in the RTA conditions have a major impact on Pb-loss, which significantly affects PZT orientation. Reference Kumar, Sayer, Pascual, Amm, Wu and Swanston29 A study was performed with 9 samples of Ti/Pt/PZT and the maximum RTA hold temperature was varied by 20 °C between 580 and 740 °C while using an RTA heating rate of 4 °C/s. At hold temperatures below 680 °C, the pyrochlore phase is constantly present. The Pb-deficient pyrochlore phase reduces the piezoelectric properties of PZT thin films, when present, by pinning ferroelectric domains and by reducing the effective active area of the piezoelectric element. Reference Ma, Meng, Sun, Lin, Shi, Wang and Chu30 The best orientations in the films were observed at 700 and 720 °C (Table IV) with an unlabeled secondary phase around 30° 2θ that may be due to Pb2(Ti,Zr)O3, PbZrO3, pyrochlore, or ZrO2 precipitation (Fig. 8). For these two temperatures of interest, 700 °C shows a diminished 110 and a larger 111 PZT peak, whereas at 720 °C, the reverse is observed.
Lotgering factors (f) of the varying thin films using 10% Pb-excess PZT (52/48).

 $f = {{P - {P_0}} \over {1 - {P_0}}}$
, where
 $P = {{\left[ {{I_{\left( {001} \right)}} + {I_{\left( {002} \right)}} + {I_{\left( {100} \right)}} + {I_{\left( {200} \right)}}} \right]} \over {\sum {{I_{\left( {hkl} \right)}}} }}$
, P
0 = XRD intensity values based on a standard, P = XRD intensity values based on actual sample, I
(001/100) = intensity of (001) and/or (100) peaks,
 $\sum {{I_{\left( {hkl} \right)}}}$
= sum of all PZT peaks.
XRD of Ti/Pt/PZT (52/48) with varying final RTA temperatures.

C. PTO seed layer tests using a TiO2/Pt bottom electrode
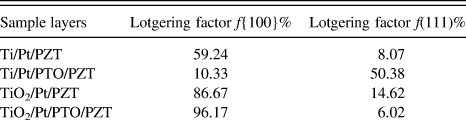
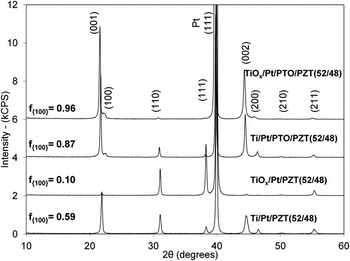
To further improve the PZT texture, the bottom electrode metallization was changed from Ti/Pt to TiO2/Pt [Fig. 1(b)]. The higher quality Pt results in significant improvements in the orientation of PZT deposited on the highly {111}-textured Pt, (Fig. 9). Furthermore, the Lotgering factors (f) of {100} orientations on samples using a PTO seed layer show significant improvements on the TiO2/Pt electrodes. Overall, the {100} Lotgering factor can be increased to at least 90% using the combination of highly textured Pt electrodes and a PTO seed layer (Table V).
XRD comparisons of 10% Pb-excess PZT (52/48) using the different bottom electrodes and with or without a PTO seed layer.

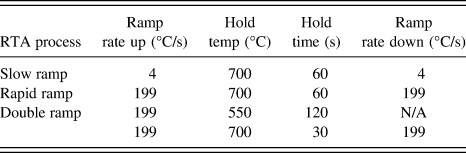
Different RTA processes studied.

D. RTA ramp rate with TiO2/Pt bottom electrode studies
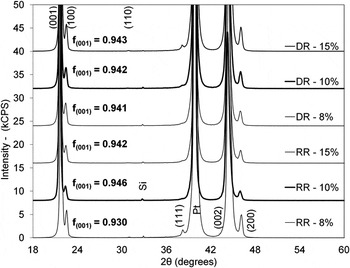
With improved PZT (52/48) piezoelectric performance observed for the PTO seeding in combination with the TiO2/Pt electrode, it was expected that additional improvements could be obtained through optimization of the PZT thermal treatment, and hence, a variety of RTA annealing parameters were studied. There are many reports available that perform slow RTA ramp rates of 4 °C/s and also fast ramp rates of over 100 °C/s or even furnace annealing of the PZT to acquire high orientation control. Reference Kumar, Sayer, Pascual, Amm, Wu and Swanston29,Reference Shao, Li, Ling, Wu, Wang and Ming31–Reference Hu, Peng and Krupanidhi33 Because such a wide range of anneal conditions has been reported to result in PZT with various crystallographic textures, three different anneal approaches were chosen for this study to determine whether a specific anneal method resulted in superior control of texture and properties. Since the Pb content within the crystallized PZT film is dependent on the anneal profile, the study of the effect of fast ramp rates included variations in Pb-excess contained within the PZT solutions used for film deposition. PZT films deposited from solutions with 8, 10, and 15% Pb-excess were analyzed under the following two RTA ramp processes referred to as “rapid ramp” (RR) and “double ramp” (DR). In the RR process, the sample temperatures were ramped up and down as fast as possible using an A.G. Associates Heatpulse 610 RTA. For these experiments, the temperature ramp (up and down) was ∼199 °C/s with a dwell at 700 °C for 60 s. Similarly, in the DR process, the temperature ramp (up and down) was ∼199 °C/s with a dwell 1 at 550 °C for 2 min followed by a ramp and dwell 2 at 700 °C for 30 s (Table VI). It has been reported that the anneal at 550 °C allows the PZT to crystallize at low temperature under conditions that result in reduced PbO evaporation from the sample surface but still provides the textured crystallization. The 700 °C segment of the two-step anneal process is reported to encourage grain growth and the removal of other growth defects. Reference Chu and Fox34,Reference Chu, Fox, Davenport, Miyaguchi and Suu35 In both RR and DR cases, the software control of the RTA was terminated once the samples cooled to 350 °C. XRD data were gathered to determine the best orientation in PZT films under the conditions described (Fig. 10).
XRD patterns of PZT (52/48) with PTO seed layer and the optimized bottom electrode. The effects of different ramp rates with 8, 10, and 15% Pb-excess are examined.

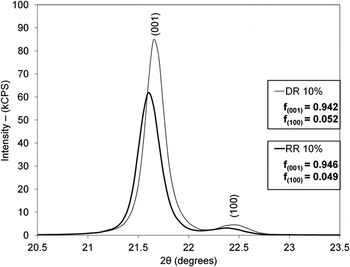
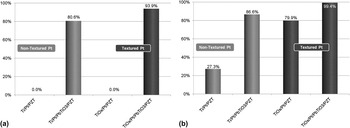
By performing the RR and DR anneals on samples with the optimized bottom electrode and PTO seed layer, it was determined that the 10% Pb-excess using an RR DR showed the highest {001} orientation and the greatest reductions in both the 110 and 111 PZT peak intensities. Lotgering factors of the RR and DR were f {001} = 94.6% and f {001} = 94.2%, respectively. The f {100} for RR and DR for 10% Pb-excess PZT (52/48) showed values of 4.9% and 5.2%, respectively (Fig. 11). Comparing the Lotgering factor for unseeded PZT deposited on Ti/Pt prepared at the beginning of this research to the seeded PZT films deposited on TiO2/Pt, which is the current state of the art, shows a substantial increase in {001} and {100} textures in the PZT thin films (Fig. 12).
Comparison of the 10% Pb-excess RR and 8% Pb-excess DR XRD peaks at (a) 001/100 and (b) 110/111 peaks.

Lotgering factor comparison of Ti/Pt and TiO2/Pt bottom electrodes with and without PTO seed layers and 10% Pb-excess PZT (52/48) in the (a) (001) orientation and (b) combined (001)/(100) orientations.

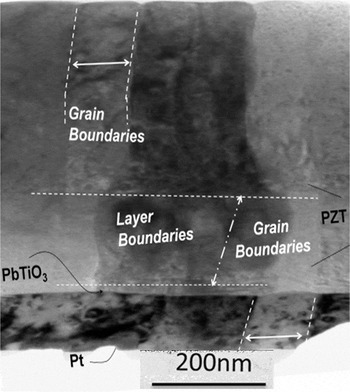
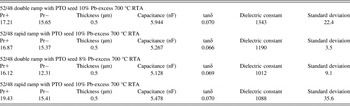
A cross-section transmission electron microscopy (TEM) measurement was performed on PZT (52/48) annealed under the RR conditions using a JEOL JEM-3010 UHR (Tokyo, Japan) at 300 kV (Fig. 13). Templating is observed from the bottom Pt electrode between the Pt–PTO and the PTO–PZT. It is evident that the TiO2/Pt/PTO layers have a great influence on PZT (52/48) orientation, allowing for columnar growth associated with {001}-textured film growth. It should be noted that the layer labeled as PTO is expected to contain a significant quantity of Zr due to intermixing with the overlying PZT layer. The microstructure allows the identification of the location and thickness of the original PTO layer. Similar to earlier experiments, electrical data were recorded on simple capacitors, fabricated as described above, using wafers coated with PZT processed with 10% Pb-excess and DR and RR annealing conditions on the TiO2/Pt bottom electrodes. From these 500 × 500 μm square capacitors, the dielectric constants were calculated for samples processed under both annealing conditions. As shown in Table VII, the 10% Pb-excess under the DR conditions showed a ∼13% higher dielectric constant compared with the RR conditions. The values in Table VII are average values taken on 6 different capacitors on 8 samples (4 samples under the DR conditions and 4 under the RR conditions) to demonstrate reproducibility.
TEM cross-section of TiO2/Pt/PTO/10% Pb-excess PZT annealed under RR conditions.

Dielectric constant determination in 10% and 8% Pb-excess PZT (52/48) with PTO seed layer.

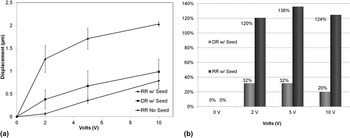
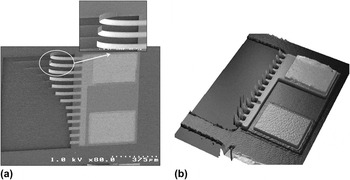
Initial cantilever displacement data show promising results in the efforts to achieve high displacement with lower actuation voltage devices. Comparing 10% Pb-excess PZT (52/48) under DR and RR conditions with and without the PTO seed layer, one can clearly see tremendous improvements in cantilever deflection (Fig. 14). Although the DR samples showed improved dielectric constant (Table VII), it was the RR with seed layer samples that showed the greatest deflection with 120% improvement over RR without the PTO seed layer at 2 V. Changes in mask design do not allow a direct comparison with previously discussed cantilever displacement data in Fig. 7. The new cantilever lengths measured in these experiments were 27-μm long and were deflected so far out-of-plane that taking optical profilometry measurements was difficult as not enough light was reflected back from the cantilever for an accurate measurement [Fig. 15(b)].
Cantilever deflection data. (a) Average displacements with RR with PTO exhibiting largest deflections, almost 90% improvement over DR with PTO. (b) Comparison of % increase of cantilever deflection between RR and DR with PTO when compared with RR without PTO at 0, 2, 5, and 10 V.

(a) SEM image demonstrating extreme out-of-plane deflection (b) Wyko optical profilometry image of severe vertical out-of-plane deformation limiting the ability to use the optical profile to measure cantilever tip deflection as a function of applied voltage.

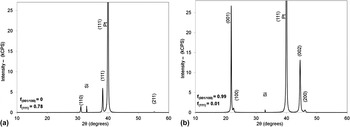
New PZT (52/48) samples were fabricated, one with the PTO seed layer leading to highly {001}-oriented PZT (52/48) films and the other without the PTO seed layer leading to highly {111}-oriented films (Fig. 16). Cantilever arrays were once again fabricated, and using a Polytec MSV laser Doppler vibrometer (LDV) system, the cantilever arrays were poled and unipolar actuation data were acquired. The LDV system allows for nondestructive dynamic displacement measurements to be taken.
XRD patterns of (a) (110)- and (111)-oriented films and (b) highly (001)- and (100)-oriented films.

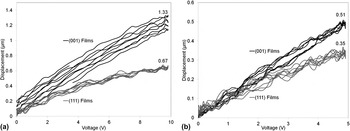
The LDV data at a frequency of 2 Hz show significant improvements in cantilever deflection using the {001}-oriented films. Comparing the two samples at 9.8 V with the bottom Pt electrode serving as the ground connection, a 50% increase in deflection is observed with a peak displacement of 1.33 μm in the {001}-oriented film and a 0.67-μm displacement in the {111}-oriented films [Fig. 17(a)]. Similarly, at 4.9 V, the {001} samples exhibit approximately 46% improvement over the {111} films [Fig. 17(b)].
LDV data (4 cycles) showing increase in piezoelectric induced deflection between (001)- and (111)-oriented films at (a) 9.8 V and (b) 4.9 V. All data recorded on cantilevers with a length of 50 μm consisting of SiO2/TiO2/Pt/PTO/PZT/Pt (∼500/33/100/17/500/100 nm).

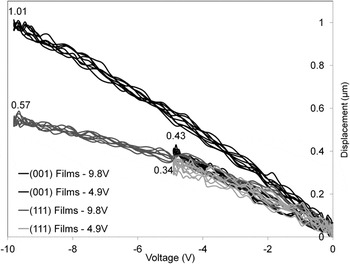
Actuating the films using negative voltages shows similar results (Fig. 18). A near doubling of the displacement is observed in films with {001}-oriented PZT (52/48) compared with the {111}-oriented films at −9.8 V. At half the voltage, 4.9 V, an improvement of only 26% was observed for the {001} films. The impact of obtaining {001}-oriented PZT (52/48) films is noted here for applications with requiring a large displacement and/or requiring a lowered voltage for operation.
Negative unipolar LDV data show similar improvements in displacement when using (001)-oriented films.

IV. SUMMARY AND CONCLUSIONS
The PTO seed layer has shown substantial improvements in {001} texturing in PZT (52/48) thin films. The quality of the bottom Pt allows for increases in the Lotgering factor film orientation of 13.3% compared with using the PTO seed layer on a Ti/Pt electrode alone.
The Pb-excess study provided valuable data on the effects of Pb-excess on PZT orientations. At 15% Pb-excess concentration, {111} orientation begins to resurface compared with solutions of 10% Pb-excess concentration. This shows that after annealing 10% Pb-excess, the PZT (52/48) is at or near stoichiometry. With the 10% Pb-excess, we are accounting for lead loss during thermal treatments but don't have an over abundance to allow random order phase PZT nucleation to dominate, which is consistent with research from Burmistrova et al. Reference Burmistrova, Sigov, Vasiliev, Vorotilov and Zhigalina36
The investigation of the annealing conditions of PZT (52/48) with the PTO seed layer provided insight on preferred conditions for proper orientation control. Due to the texture control provided by {111} Pt and PTO seed layer, it is believed that nucleation occurs at the bottom electrode interface. The PTO induces {001} nucleation and growth of the PZT film-layer such that the {001} planes are parallel with the plane of the substrate. The {001} texture propagates through subsequently deposited PZT layers. The improved Pt limits nucleation of {110} and {111} PZT thus allowing even greater {100} orientation in the film when combined with the PT seed layer. Using the best conditions identified as part of this study, an improvement of approximately 50% was observed in the piezoelectric induced deformation of thin film cantilevers for PZT films with a {001} orientation compared with {111} orientation.
ACKNOWLEDGMENTS
The authors would like to thank Mr. Joel Martin and Mr. Brian Power of the US Army Research Laboratory for their roles in the fabrication of the cantilever test structures. Additionally, the authors would like to thank Mr. Alden Grobicki (US Army Research Laboratory) for his assistance in the data collection of the laser Doppler vibrometer measurements.