I. INTRODUCTION
As one of the carbon-based nanomaterials with extraordinary properties, graphene has attracted tremendously more attention by researchers since its isolated characterization in 2004 by Novoselov.Reference Novoselov, Geim, Morozov, Jiang, Zhang, Dubonos, Grigorieva and Firsov1 Owing to its chemical bonding characteristics as a carbon allotrope similar to its conjugates such as carbon nanotubes, it has excellent mechanical, thermal,Reference Balandin2 and electrical properties.Reference Novoselov, Geim, Morozov, Jiang, Zhang, Dubonos, Grigorieva and Firsov1 For instance, it is branded as the strongest materialReference Ruiz, Xia, Meng and Keten3 with 1.06 TPa Young’s modulusReference Scarpa, Adhikari and Srikantha Phani4 and 130 ± 10 GPa tensile strength.Reference Baykasoglu and Mugan5
In addition to many other studies focusing on the chemical, physical, and electrical properties of graphene,Reference Chambers, Notarianni, Liu, Motta and Andersson6–Reference Rosenzweig, Sorial, Sahle-Demessie and McAvoy14 its hybrid applications in combination with other materials are also investigated extensively. Majority of those studies are related to graphene nanocomposites with polymeric matrix constituent. For instance, Kuilla et al.Reference Kuilla, Bhadra, Yao, Kim, Bose and Lee15 presented the improvements in the properties of the graphene composites with different types of polymers. With a different point of view, Cui et al.Reference Cui, Kundalwal and Kumar16 investigated the graphene–polymer composites for gas barrier applications. To enhance the mechanical behavior of glass fiber–polymer composites, Chen et al.Reference Chen, Zhao, Jin, Wang, Wang and Ge17 utilized graphene to reinforce glass fibers. As an additive material, graphene was also examined within the polymer electrolytes to demonstrate effects on the structural, thermal, and electrical characteristics of the electrolytes.Reference Diwan, Harms, Raetzke and Chandra18 Apart from all those studies, in recent years, with the purpose of modulating the behavior of metallic materials which have a wide range of industrial applications, graphene–metal composites have also entered into the interest zone of researchers.
Among those initial studies, Lin et al.Reference Lin, Richard Liu and Cheng19 observed the mechanical strength and fatigue life of graphene–iron composites concluding that graphene addition by using laser sintering increased the strength and fatigue life of iron. Similarly, Kim et al.Reference Kim, Lee, Yeom, Shin, Kim, Cui, Kysar, Hone, Jung, Jeon and Han20 investigated the mechanical properties of graphene–copper and graphene–nickel composites by reporting that graphene addition enhances the strength of copper and nickel. Furthermore, Zhang and ZhanReference Zhang and Zhan21 used a modified semipowder method to produce graphene–copper and graphene–nickel composites which present yield strength enhancements by 49.1% and 64.5% for copper and nickel, respectively. In the literature, it is also noticed that the majority of the experimental studies about the investigation of graphene–metal composites consider aluminum as the metal constituent owing to wide range of applications of aluminum. Different manufacturing techniques including powder metallurgy,Reference Wang, Li, Fan, Pan, Chen and Zhang22–Reference Yan, Dai, Zhang, Yang, Hong, Chen and Lin24 semipowder method with hot extrusion,Reference Rashad, Pan, Tang and Asif25 mechanical alloying,Reference Pérez-Bustamante, Bolaños-Morales, Bonilla-Martínez, Estrada-Guel and Martínez-Sánchez26 cryomilling with hot extrusion,Reference Li, Xiong, Wang, Yan, Yang, He, Chen, Wang, Zhang and Dai27 semisolid sintering with ball milling,Reference Bastwros, Kim, Zhu, Zhang, Wang, Tang and Wang28 and ball milling with hot isostatic pressing and extrusionReference Bartolucci, Paras, Rafiee, Rafiee, Lee, Kapoor and Koratkar29 have been utilized to produce the sample of graphene–aluminum composites. Despite the abundance of different manufacturing methods, roughly similar improvements realized on the mechanical properties are reported such as 62% increase in tensile strengthReference Wang, Li, Fan, Pan, Chen and Zhang22 and approximately 50% increase in yield strength.Reference Yan, Dai, Zhang, Yang, Hong, Chen and Lin24
Difficulties and high expense of performing nanoscale experiments with different materials and boundary conditions impel researchers to conduct numerical experiments through atomistic modeling of these nanostructures. In this regard, molecular dynamics (MD) simulations that are widely used to investigate the mechanical behavior of nanomaterials can be used to investigate the behavior of realistic atomistic systems. Thus, there are many MD-based studies focusing on the behavior of graphene.Reference Jiao, Wang, Wang, Zhang, Ye and Wang30–Reference Seifoori and Hajabdollahi37 However, the number of numerical studies about graphene–metal composites are very limited. In one of these limited studies, Kim et al.Reference Kim, Lee, Yeom, Shin, Kim, Cui, Kysar, Hone, Jung, Jeon and Han20 performed MD simulations of graphene–nickel composites to observe deformation mechanisms such as dislocations and slip steps at the metal–graphene interface. Moreover, Fereidoon et al.Reference Fereidoon, Aleaghaee and Taraghi38 examined a hybrid graphene–TiO2 structure by MD simulations to determine the mechanical properties of that nanocomposite. Along the same line, Bashirvand and MontazeriReference Bashirvand and Montazeri39 used MD simulations to investigate the mechanical behavior of graphene–copper composites.
Motivated from the fact that the number of studies concentrated on the coating of metals with graphene is very limited, this study presents the tensile behavior of a graphene-coated aluminum layer by providing detailed deformation mechanisms and the mechanical enhancement compared to the uncoated aluminum layer. With this purpose, first, the atomistic model of the graphene-coated aluminum specimen is prepared by using an armchair graphene sheet. The coated specimen, which is thermalized at 300 K, is subjected to tensile loading at different strain rates. Second, microstructural evolution of the coated specimen is monitored to explain the driving deformation mechanisms observed as a result of graphene coating. Furthermore, the study continues with an investigation about the effects of loading rate and temperature on the transformation characteristics of the coated specimen to an amorphous solid.
II. ATOMISTIC MODELING AND SIMULATION DETAILS
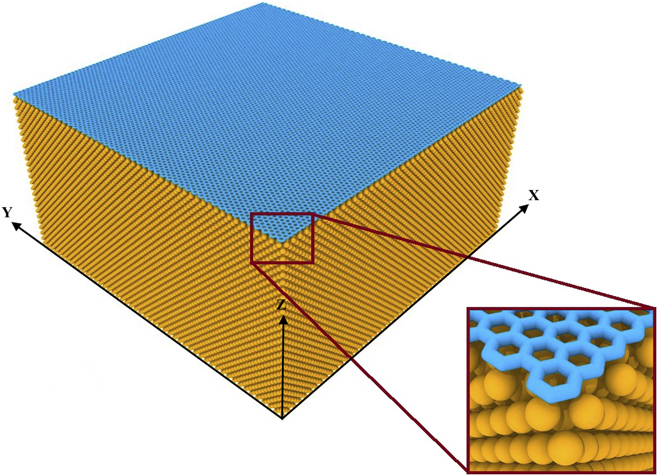
To investigate the mechanical properties of metallic plates coated by a graphene sheet in the atomistic detail, classical MD simulations are performed by utilizing a widely used open source code, namely LAMMPS, (i.e., Large-scale Atomic/Molecular Massively Parallel Simulator), which is developed by Sandia National Laboratories (Albuquerque, New Mexico).40 The atomistic model used for simulations is generated by placing a graphene sheet, which is selected as an armchair pristine graphene sheet with dimensions of 20 × 20 nm, on the free (010) surface of the aluminum block (shown in Fig. 1) with a thickness of 10 nm by allowing a distance of 0.224 nm which is considered as the bond length between aluminum and carbon atoms as referenced in the literature.Reference Shackelford, Alexander, James, Shackelford and Alexander41
Atomistic model of the graphene coated aluminum layer.

For the purpose of representing the atomic interactions between the metal atoms (i.e., aluminum), the embedded atom method is used by a potential file called “AlCu.eam.alloy”. In the file, the total energy of an atom m is calculated by
 $${E_m} = {F_a}\left( {\mathop \sum \limits_{n \ne m} {\rho _b}\left( {{r_{mn}}} \right)} \right) + {1 \over 2}\mathop \sum \limits_{n \ne m} {\varphi _{ab}}\left( {{r_{mn}}} \right)\quad ,$$
where F is the embedding energy, ρ is the atomic electron density, φ is the pair potential interaction, r is the distance between the atoms, and a and b are the element types of atoms m and n. For the interaction between Al atoms, both a and b are selected as Al atoms in the file. For the carbon–carbon interactions, adaptive intermolecular reactive empirical bond order potential, which has the graphene lattice parameter of 1.42 Å, is utilized.Reference Stuart, Tutein and Harrison42 For hybrid interactions between aluminum and carbon atoms, Morse potential is used with the parameters taken from the literature.Reference Peng, Liao, Shi, Tang and Gao43
The time step of the simulation is set as 1 fs while boundary conditions are applied to the system along the planar directions (i.e., X and Y directions). After minimizing the energy of the system based on given potentials, the structure is thermalized and relaxed at a temperature for 100 ps which is a sufficient time for the convergence of the energy. Thermalization of the atomistic model is performed at different temperatures (i.e., 0, 300, and 600 K) to observe the effect of temperature within the process of amorphization. The temperatures of the atomistic models are maintained by applying the Nosé–Hoover thermostat to simulate a canonical ensemble (NVT) in MD simulations. Tensile loading is applied along the Y direction as shown in Fig. 1 by applying different strain rates (i.e., 0.1 and 0.001 ps−1) up to the level of 50% strain. During the loading, virial stress values for each atom are calculated by
 $${\sigma _{mn}} = {{ - 1} \over V}\left( {m{v_m}{v_n} + \mathop \sum \nolimits {f_m}{d_n}} \right)\quad ,$$
where σ is the virial stress, V is the volume, m is the mass, f is the force vector, d is the position vector, and v is the velocity of the atoms m and n. From the calculated stress values, tensile stress–strain curves of the structures are obtained.
III. RESULTS AND DISCUSSION
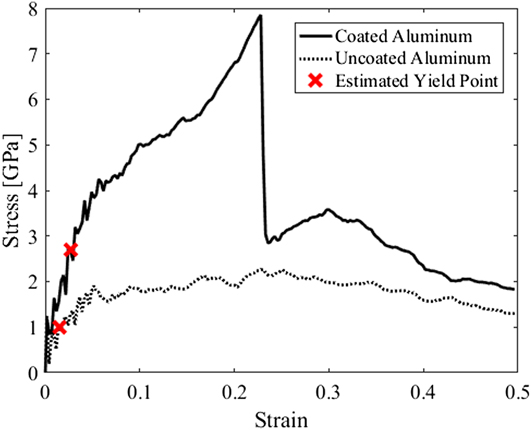
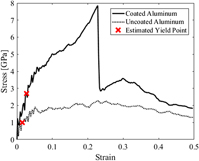
The comparison for the tensile behavior of the uncoated and coated aluminum specimens at a strain rate of 0.001 ps−1 is demonstrated in Fig. 2 by presenting the stress–strain curves along the loading direction (Y direction). As noticed, both Young’s modulus and yield strength is significantly enhanced by coating the aluminum nanoplate with a single graphene sheet. For instance, as a quantitative result of the calculations, it is determined that the Young’s modulus is increased by 88%. Furthermore, it is also observed that the toughness is significantly improved owing to increased yield strength and sequential softening–hardening regimes appeared within the stress–strain curves. In this regard, it should be noted that not only mechanical properties such as Young’s modulus, yield strength, and toughness are vitally enhanced but also deformation characteristics seem to be altered due to coating. For instance, while the post-yield behavior of uncoated aluminum presents a single softening regime, there are several softening regimes which are followed by a hardening regime for the coated aluminum plate, which can be attributed to the microstructural deformation mechanisms triggered by graphene coating.
Tensile stress–strain curves of the coated and uncoated aluminum at 300 K for the strain rate of 0.001 ps−1.

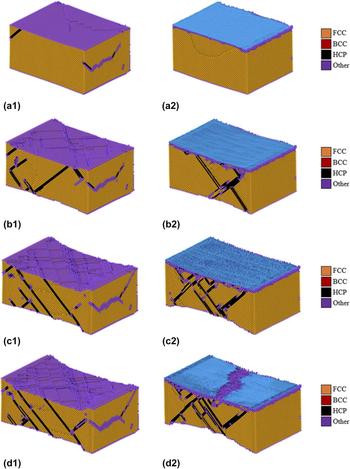
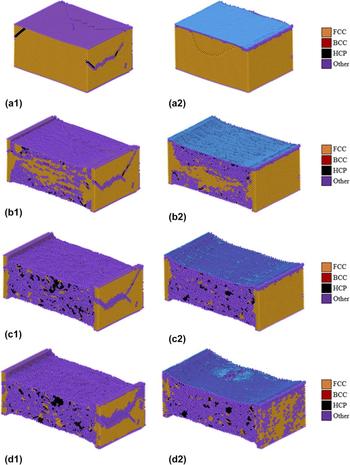
To interpret the mechanical behavior depicted in Fig. 2, adaptive common neighbor analysis (aCNA)Reference Stukowski44,Reference Stukowski45 is performed to examine the microstructural evolution of the atomistic specimens. Based on the local coordination numbers of the atoms, local structural configuration of the specimens can be identified by classifying the atoms in crystalline systems as hexagonal close-packed (HCP), body-centered cubic (BCC), face-centered cubic (FCC), and undefined (Other) configurations.Reference Sansoz46 In this regard, the sequence of snapshots taken from the tensile loading process of the specimens (i.e., coated and uncoated aluminum) for the strain rate of 0.001 ps−1 is shown in Fig. 3, which represents crystal configurations of FCC, BCC, HCP, and Other (i.e., undefined) in yellow, red, black, and purple colors, respectively. Here, it should be noted that aCNA is not used to the graphene sheet as can be seen in snapshots (i.e., blue color).
Distribution of stacking faults (1) uncoated and (2) coated aluminum (sliced view) at (a) 0%, (b) 10%, (c) 20%, and (d) 23% strain states for the strain rate of 0.001 ps−1 at 300 K

It can be easily noticed from Fig. 3(a1) that HCP stackings are formed in the uncoated aluminum after the thermalization process while there are only undefined formations at the free surfaces of the coated aluminum [see Fig. 3(a2)]. However, it is crucial to observe that the density of undefined stackings at free surfaces of the coated aluminum is higher than the uncoated aluminum, which can be attributed to the stiffness difference between aluminum and graphene layers. Much larger stiffness of the graphene layer causes a stress concentration, which triggers the formation of undefined stackings, on the coating surface within the thermalization process. In a different way, the graphene sheet acts as a stabilizer on the surface atoms of the aluminum by restraining their local displacements and decreasing the surface irregularities.
In the following stages of the deformation process [see Figs. 3(b) and 3(c)], the density of the HCP formation (i.e., slip-slide mechanisms) increases for both uncoated and coated specimens indicating hardening and softening behaviors as depicted in Fig. 2. Even though local fracture of the graphene sheet at 23% strain decreases the strength of the coated specimen, a hardening regime up to approximately 30% strain is observed after the first fracture point, which can be explained by higher density of undefined stacking formations at the coating surface as well as local load resistance of unfractured graphene pieces. Aside from the effect of graphene, different slip-slide mechanisms in aluminum cause different hardening and softening regimes. As can be seen in Fig. 3, in uncoated aluminum, the slip planes are generally parallel to each other which results in softening and shearing. However, in coated aluminum, the slip planes intersect with each other and as a result of that, locking of slip planes are observed in the structure. The locking of the slip planes prevents the softening behavior and increases the resistance of the structure against further loading (i.e., hardening).
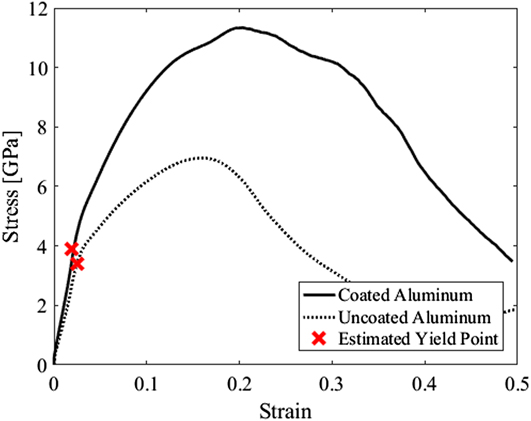
Furthermore, the tensile behavior of the coated specimen is examined under higher loading rate (i.e., strain rate of 0.1 ps−1) and compared with the uncoated aluminum. Stress–strain curves of the specimens for the strain rate of 0.1 ps−1 given in Fig. 4 demonstrate more noticeable elastic regions compared to the specimens, which are subjected to a lower loading rate (i.e., 0.001 ps−1). As can be seen from the strain–stress curves, Young’s modulus of the specimens under higher loading rate is nearly same, which indicates that the elastic behavior of aluminum is more dominant in the early stages of the loading. After the elastic region, contribution of the graphene to the hybrid system becomes noticeable with an approximately 60% increase in ultimate strength over uncoated aluminum.
Tensile stress–strain curves of the coated and uncoated aluminum at 300 K for the strain rate of 0.1 ps−1.

To examine the difference in the tensile behavior observed at a higher strain rate, aCNA is performed as before (see Fig. 5). Due to insufficient time for the structures to reach the equilibrium state, there is no remarkable change in the stacking faults until approximately 20% strain, which is the strain value of ultimate stress, for the coated specimen (see Fig. 4). At this point, the density of the undefined stackings increases rapidly up to nearly 70% of the total stacking formations. Density of the undefined stackings within the uncoated aluminum is low (i.e., approximately 65%) compared to the coated specimen due to existing undefined stackings formed by stiffness difference between aluminum and graphene layers within the thermalization period. Further loading process is concluded with the rupture of the graphene sheet as well as the increase in the density of the undefined stackings as can be seen in Figs. 5(c) and 5(d).
Distribution of stacking faults (1) uncoated and (2) coated aluminum (sliced view) at (a) 0%, (b) 20%, (c) 30%, and (d) 35% strain states for the strain rate of 0.1 ps−1 at 300 K

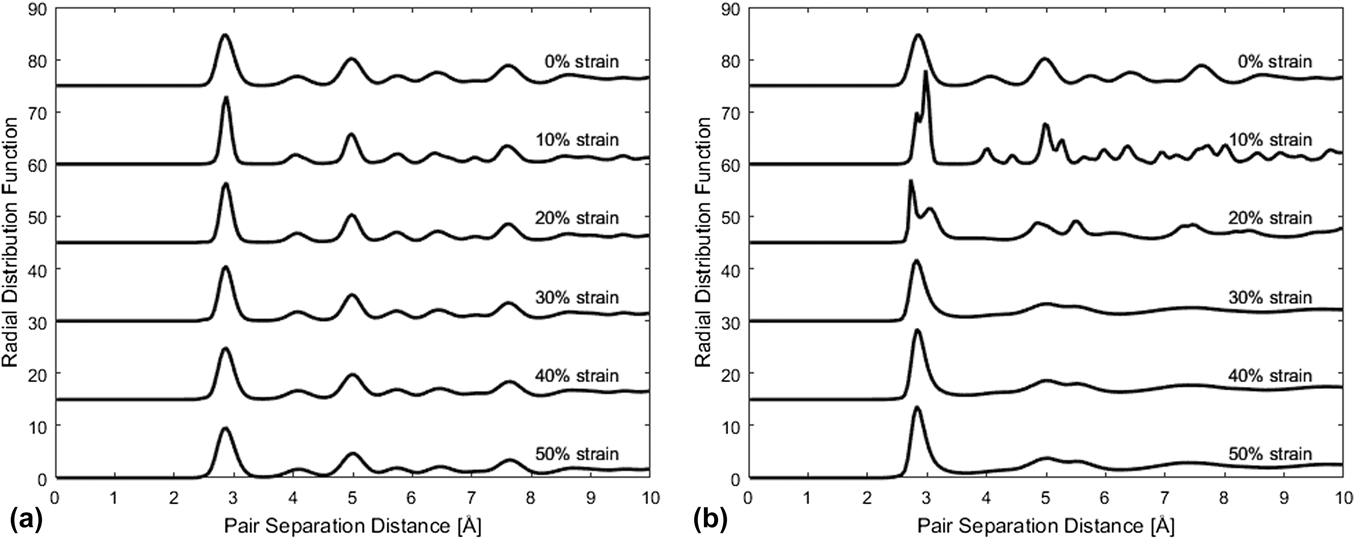
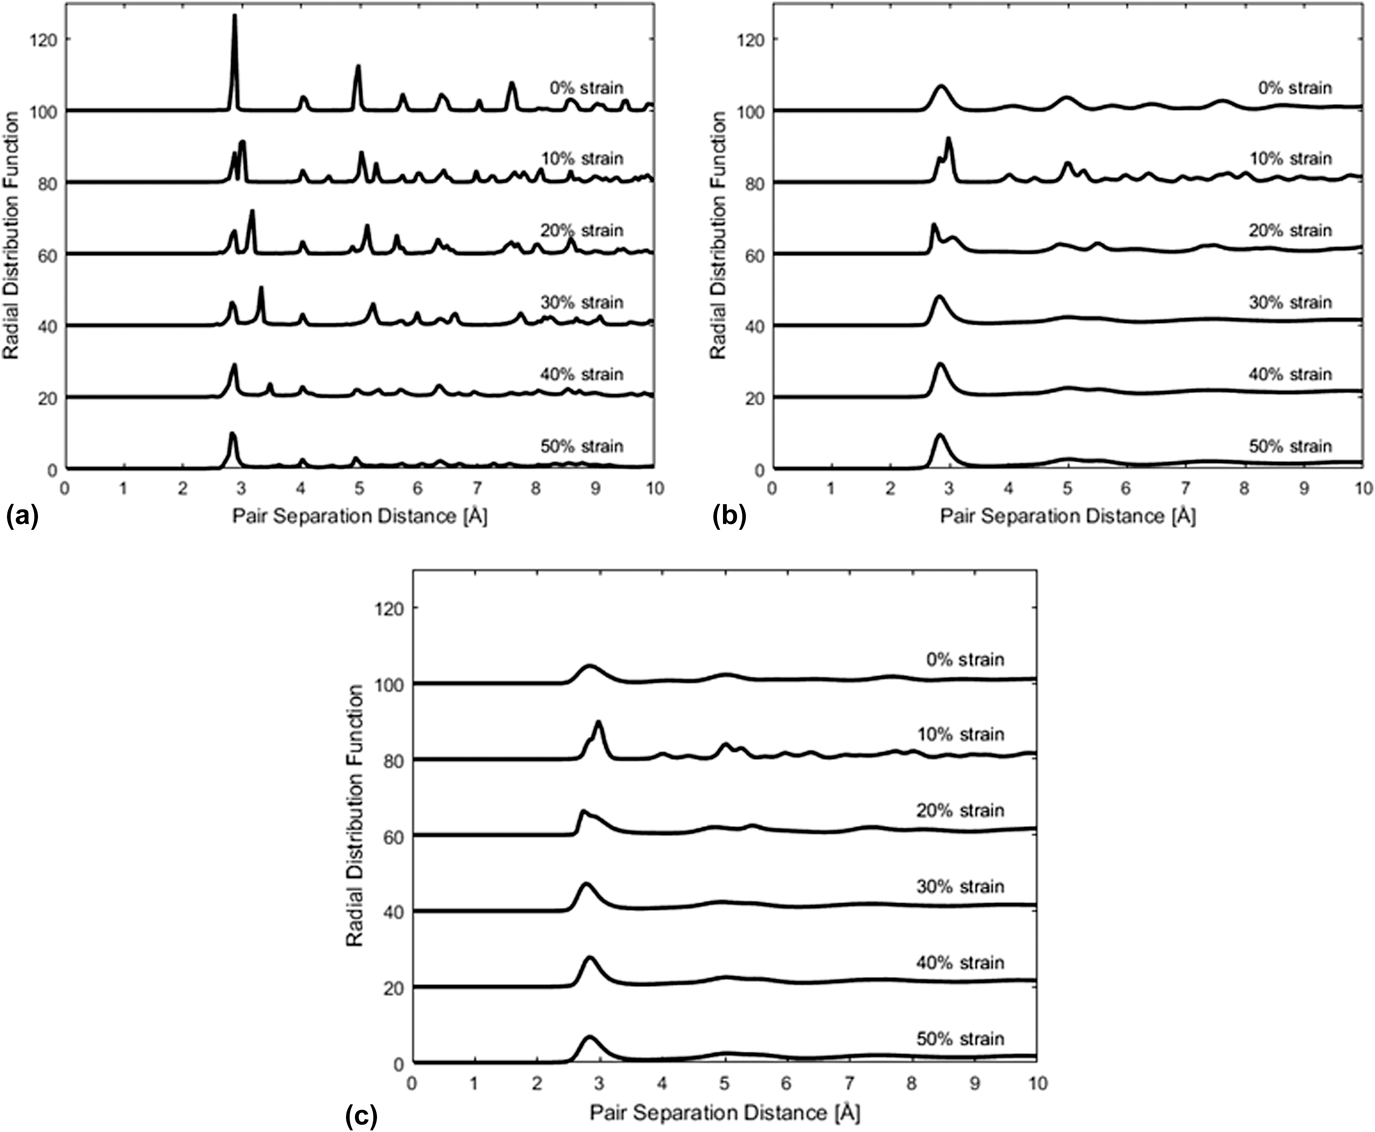
Due to the high density of the undefined stacking formations, it is crucial to examine them for understanding the mechanical behavior of the structure in detail. For this purpose, radial pair distribution function (RPDF) is calculated, which is a very common way to determine the amorphous transition.Reference Aryal, Rulis and Ching47–Reference Ikeda, Qi, Çagin, Samwer, Johnson and Goddard49 As can be seen in Fig. 6(a), the crystalline distribution of RPDF is preserved at the lower loading rate (i.e., 0.001 ps−1) while the peaks change slightly. However, for higher loading rate, initial crystalline distribution of RPDF cannot be maintained through the loading process [see Fig. 6(b)]. At 10% strain, a more complex RPDF profile is observed with increased number of peaks, which indicates a phase transition. As a characteristic sign of an amorphous phase, the transition process continues with the expansion and disappearance of the peaks at 20% strain. Following this, RPDF given for 30% strain typically illustrates an amorphous structure. Therefore, this RPDF refers that the coated aluminum transforms from the crystalline phase into an amorphous solid within the strain levels of 20 and 30% (i.e., 23%).
RPDF of coated aluminum for the strain rate of (a) 0.001 ps−1 and (b) 0.1 ps−1 at different strain values thermalized at 300 K

By comparison of the RPDFs of uncoated and coated aluminum layers, as mentioned before, the effect of the graphene on amorphization of the aluminum can also be examined. As a result of this comparison, a slight difference is found, which indicates an amorphization of the coated structure at early strain values than the uncoated aluminum (23 and 25% strain, respectively). However, this difference (i.e., early amorphization) can be significant if the number of graphene layers is increased.
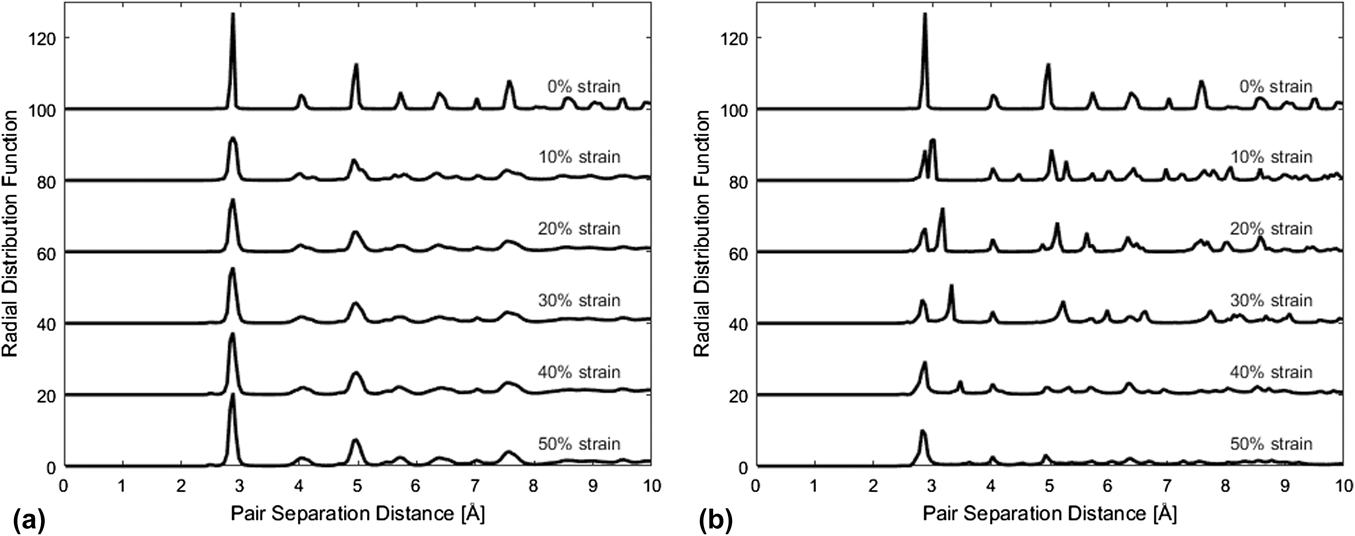
To investigate the effects of loading rate and temperature independently, same MD simulations are performed while the thermalization is applied at 0 K. In this regard, the effect of loading rate is investigated by loading the coated aluminum with strain rates of 0.001 and 0.1 ps−1 at 0 K. Thermalization at 0 K reduces the dynamic effects caused by the temperature oscillations and simulation represents static conditions. RPDFs of these simulations presented in Fig. 7 indicate that the crystalline characteristics are conserved at the lower loading rate (i.e., 0.001 ps−1) while the distribution changes with greatly reduced peaks at the higher rate (i.e., 0.1 ps−1).
RPDF of coated aluminum for the strain rate of (a) 0.001 ps−1 and (b) 0.1 ps−1 thermalized at 0 K

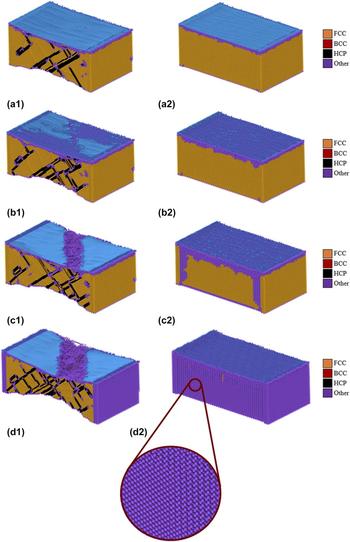
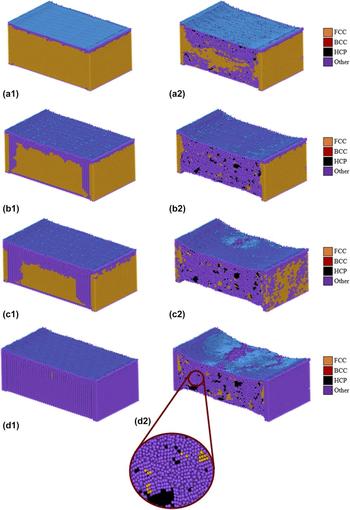
Even though the RPDF profile of the coated aluminum specimen changes significantly in the process of tensile loading at 0.1 ps−1 [see Fig. 7(b)], the structure does not transform to an amorphous solid. This situation can also be confirmed by the snapshots of the aCNA analysis provided in Fig. 8. From the snapshots of the lower loading rate (i.e., 0.001 ps−1), it can be seen that the density of undefined stacking formations is very low and HCP stacking (i.e., slip-slide mechanism) is the dominant formation of the structure. Moreover, it must be noted that a significant necking can be observed at the uncoated region of aluminum (i.e., bottom region) for the strain rate of 0.001 ps−1 while the necking in the specimen loaded at the higher rate (i.e., 0.1 ps−1) is not noticeable. Furthermore, according to the snapshots of the higher loading rate, the undefined stackings emerge from the coated face of aluminum as a consequence of the layerwise stiffness difference. At 40% strain [see Fig. 8(d2)], the whole coated structure transforms to undefined formation. However, the undefined structure is not an amorphous phase because of the fact that the regime of the crystalline formation is maintained which can be seen in the magnified view of the structure as shown in Fig. 8.
Distribution of stacking faults within the coated aluminum specimen (sliced view) at (a) 20%, (b) 25%, (c) 30%, and (d) 40% strain states for the strain rate of (1) 0.001 ps−1 and (2) 0.1 ps−1.

Effects of temperature are examined by comparing the results of the simulations thermalized at different temperatures (i.e., 0, 300, and 600 K) loaded at the same strain rate (i.e., 0.1 ps−1). RPDF profiles calculated for those simulations are given in Fig. 9. According to this, thermalization at 300 K provides sufficient energy to the system for the amorphization which is completed at 23% strain state. Furthermore, thermalization at 600 K not only causes amorphization but also stimulates the amorphous transition to initiate in the earlier deformation state with a lower density of undefined formations compared to thermalization at 300 K. For instance, complete amorphization of the coated structure thermalized at 600 K is observed at 21% strain, which differs from the amorphization state of the structure thermalized at 300 K (i.e., 23%).
RPDFs of the coated aluminum specimen thermalized at (a) 0 K, (b) 300 K, and (c) 600 K for the strain rate of 0.1 ps−1.

To support the examination of the differences in RPDF profiles due to temperature, snapshots of aCNA analysis are given in Fig. 10. It can be clearly seen from the figure that the undefined stacking formations are observed at the strain state of 20% for the 300 K thermalization case while nearly the same density of undefined formations exists at 35% strain state for the thermalization at 0 K. From the magnified view in Fig. 10, the amorphous phase, which is significantly different than the formation in magnified view shown in Fig. 8, can be easily distinguished.
Distribution of stacking faults within the coated aluminum specimen (sliced view) thermalized at (1) 0 K and (2) 300 K for the strain rate of 0.1 ps−1 at (a) 20%, (b) 30%, (c) 35%, and (d) 40% strain states.

IV. CONCLUSION
In this study, mechanical behavior of an aluminum layer coated with a monolayer armchair graphene sheet is investigated through MD simulations to demonstrate the mechanical enhancement and underlying deformation mechanisms. Based on the results of the simulations performed at the rate of 0.001 ps−1, the graphene coating increases the Young’s modulus of the aluminum layer by 88% while changing the tensile characteristics by the appearance of hardening–softening regimes and significantly increased toughness. It is shown that, for the loading rate of 0.001 ps−1, the aluminum layer is the dominant component of the hybrid structure for the overall mechanical response in the elastic region. However, the effect of the graphene component is mainly observed in the plastic region with a 60% increase in the ultimate tensile strength. Due to lack of studies about tensile properties of the graphene-coated aluminum, it is hard to compare the simulation results with an experimental data. However, the investigations on the tensile properties of aluminum–graphene composites can be used for comparison. For instance, Wang et al.Reference Wang, Li, Fan, Pan, Chen and Zhang22 reinforced aluminum with graphene nanosheets and fabricated an aluminum–graphene composite by flake powder metallurgy. According to the tensile experiment, they observed 62% improvement in tensile strength compared to aluminum. In another study, Li and XiongReference Li and Xiong50 investigated the effect of graphene content on tensile properties of the aluminum–graphene composite fabricated by ball milling and hot pressing. As a result, up to 56.19% increase in ultimate tensile strength over aluminum is reported in the study. Furthermore, a few studies concerning tensile properties of aluminum–graphene composites presented 30Reference Gao, Yue, Guo, Zhang, Lin, Yao and Wang23 and 36.8%Reference Li, Gao, Liang, Gu, You, Shu, Wang and Sun51 increased ultimate tensile strength compared to aluminum.
In addition, according to the aCNA results of the simulations, the density of the undefined formations increases greatly when the loading rate is increased. Because of the abundancy of the undefined stackings at the higher loading rate, it is crucial to examine the stacking formations by calculating the RPDFs. Evaluating the RPDF profiles shows that the coated structure thermalized at 300 K transforms to an amorphous phase in the process of tensile loading at 0.1 ps−1, which is completed at slightly earlier strain values than the uncoated structure. Moreover, for the purpose of investigating the effects of loading rate and temperature on the amorphization independently, the same MD simulations are performed with different temperatures (i.e., 0, 300, and 600 K). According to the results, an increase in the loading rate stimulates the formation of the undefined stackings. Furthermore, it is also demonstrated that the coated structure does not transform to an amorphous solid although it completely turns into an undefined formation. However, the difference between thermalization at 0, 300, and 600 K indicates that the increase in the density of undefined stacking formations and amorphization of the coated structure is observed to be earlier as the temperature increases.
This study offers some important insights about the effect of graphene coating on the mechanical behavior of aluminum. These insights can provide significant benefits for the future experimental studies, coating, and industrial applications where the aluminum is highly used. By simulating this coated nanostructure, we would like to encourage the researchers for further investigation about coating of nanostructures with graphenes.
ACKNOWLEDGMENT
We would like to thank Prof. Ata Mugan for his kind and precious support.