





Introduction
Voter turnout continues to decline in European elections, posing a challenge to the responsiveness and legitimacy of democratic processes (Beetham Reference Beetham1991; Lijphart Reference Lijphart1997; Idea 2026). While a marginal decrease in participation may not constitute an immediate threat, Europe is now witnessing a persistent and widespread trend in which an increasing share of citizens abstains from voting. This development is particularly concerning, as those with a lower propensity to vote are typically the first to disengage. Since voter abstention is not a random phenomenon, the consequence is a gradual erosion of representativeness within democratic systems (Tingsten Reference Tingsten1937; Bhatti, Dahlgaard, Hansen et al. Reference Bhatti, Dahlgaard, Hansen and Hansen2019a). In order to maintain well-functioning political systems with equal participation, it is essential to prevent the declining voter turnout.
How can voter turnout be increased? Scholars have long recognized the issue of declining voter turnout and have studied the effects of several different personal mobilization tactics, both in the United States and in Europe (Arceneaux and Nickerson Reference Arceneaux and Nickerson2009; Michelson and Nickerson Reference Michelson, Nickerson, Druckman, Greene, Kuklinski and Lupia A2011; Matland and Murray Reference Matland and Murray2012; Green, McGrath and Aronow Reference Green, McGrath and Aronow2013; Bhatti, Dahlgaard, Hedegaard et al. Reference Bhatti, Dahlgaard, Hedegaard and Hansen2017a, Reference Bhatti, Dahlgaard, Hedegaard and Hansen2017b, Reference Bhatti, Dahlgaard, Hedegaard and Hansen2018a; Bergh, Christensen and Matland Reference Bergh, Christensen and Matland2019; Green and Gerber Reference Green and Gerber2023; Townsley Reference Townsley2025). Personal interventions, encouraging voters to vote, have demonstrated measurable effects on voter participation; however, these interventions are challenging to implement on a large scale due to the substantial resources required. As an alternative, impersonal tactics like direct mail have been implemented and have shown that a simple nudge in the form of reminding voters to cast their ballot is sufficient to increase electoral participation (Dale and Strauss Reference Dale and Strauss2009). The most recent development within impersonal voter mobilization tactics is the use of digital outreach, which has attracted growing attention, particularly as technological developments offer new opportunities for political engagement. Get-Out-The-Vote (GOTV) experiments, on the threshold of a new digital era, have increasingly explored the potential of sending digital mobilization messages like short text message (SMS) as a time-and resource-efficient way to mobilize voters (Dale and Strauss Reference Dale and Strauss2009; Malhotra, Michelson, Rogers et al. Reference Malhotra, Michelson, Rogers and Valenzuela2011; Bergh, Christensen and Matland Reference Bergh, Christensen and Matland2016, Reference Bergh, Christensen and Matland2019; Bergh and Christensen Reference Bergh and Christensen2022; Hirvonen, Lassander, Sääksvuori et al. Reference Hirvonen, Lassander, Sääksvuori and Tukiainen2025; Lindgren, Nyman and Oskarsson Reference Lindgren, Nyman and Oskarsson2025). These digital mobilization interventions have been applied in some European countries and the United States over the last decade, and the time is now ripe to synthesize the insights gained from these studies. Nevertheless, the existing experiments have typically targeted specific voter groups or small samples of voters. In both cases, this limits the ability to assess heterogeneous effects of digital messaging across broader populations and identify previously unexplored, fine-grained patterns of treatment heterogeneity. This paper thus addresses the questions: Can digital messages increase the voter turnout and thus contribute to preventing Europe’s declining voter turnout? Moreover, do digital interventions exhibit heterogeneous effects across voter groups in ways that may reduce turnout inequality and strengthen democratic inclusion?
To fill these gaps, this paper provides two contributions. The first contribution is to examine the effect of direct digital messaging on turnout in Europe. The United States has often been treated as the standard for assessing GOTV experiments, even though it is an idiosyncratic case due to voter registration, partisanship, and a partisan media system, which sets it apart from European contexts. To provide evidence that can be generalized to European countries, we summarize our current understanding through a meta-analysis and assess whether digital messaging can improve declining voter turnout in Europe. By examining studies from the past decade in Europe, we evaluate the effect size of digital messages on increasing voter turnout. Moreover, we consider the effectiveness of digital messaging in engaging marginalized groups and fostering participatory equality. The meta-analysis shows that the estimated intention-to-treat (ITT) effect of digital messages is approximately 0.45 percentage points on turnout for all voters, 0.75 percentage points for young voters, and 1.5 percentage points for immigrants. This suggests that digital mobilization messages have heterogeneous effects, which hold the potential to reduce inequalities in voter turnout.
Our second contribution is to present results from a new experiment that is the first of its kind to include a country’s entire population of eligible voters and thus allows us to go deeper than ever before and investigate heterogeneous effects even in small subpopulations that go beyond broader applied categories like young voters and immigrants. Our data grant us the statistical power necessary to estimate the effect of digital messages on voters of all ages and to divide the population of immigrants into Western and non-Western immigrants. The experiment was rolled out in Denmark for the European Parliament elections in 2024. The experiment consists of a digital letter, along with a SMS and email, sent directly to registered voters in the week leading up to the election. The pooled ITT effect is 0.52 percentage points, with an effect of up to 0.60 percentage points reported among low-to medium-propensity voters. While our findings reinforce the results from the meta-analysis, showing that immigrant voters are more likely to be mobilized by digital messages compared to all voters, the experiment reveals that it is only first-generation voters who are mobilized, while digital messages have no effect on second-generation immigrants. Furthermore, the experiment documents that very young and very old voters appear to be less responsive to such interventions, which contrasts with the findings from the meta-analysis, where young voters were more easily mobilized than the general electorate. A main finding that appears from the experiment, which is not revealed in the meta-analysis, is that the effect of digital messages appears to be weakening. It has become more common to receive digital messages from public authorities today than five or ten years ago, potentially crowding out the effect of digital GOTV interventions. We will return to this finding in the discussion. The next section covers previous research and gives an overview of the literature on digital messaging. The second section describes the analytic procedure for our meta-analysis and presents the results. In the third section, we present the case of the GOTV experiment and the results. The article concludes by discussing our findings.
Previous research – theoretical contributions
The considerable number of studies in the GOTV literature that utilize randomized controlled field experiments allows for meaningful comparisons of the effectiveness of various mobilization tactics (Green, McGrath and Aronow Reference Green, McGrath and Aronow2013). Green and Gerber (Reference Green and Gerber2023) sought to summarize these findings by conducting a meta-analysis of various mobilization strategies in the United States, including canvassing, phone calls, direct mail, and SMS, which Mann and Haenschen (Reference Mann and Haenschen2024) subsequently re-analyzed. These studies demonstrate that personal mobilization strategies, such as door-to-door canvassing and phone calls, are generally more effective than impersonal methods like emails and direct mail in increasing voter turnout. Although the estimated effects of direct digital campaigning are generally smaller, such approaches offer substantial advantages in terms of cost-efficiency, scalability, and reduced labor demands. When evaluated by cost per additional vote, SMS messages in particular have proven to be highly effective (Bergh, Christensen and Matland Reference Bergh, Christensen and Matland2019). While existing research has summarized the effects of various mobilization tactics in the United States, there remains a gap in understanding the average effects of mobilization tactics in a European context. We will provide an overview of the impact of digital messaging in Europe, which allows us to compare the effectiveness of digital messages across different contexts. Mann and Haenschen (Reference Mann and Haenschen2024) find that the mean ITT effect for digital messages is 0.58 percentage points in low-salient elections and 0.22 percentage points in high-salient elections. We would expect to observe the same pattern – a lower effect of digital messages in high-salient elections compared to low-salient ones. Given substantial electoral differences between the American and European contexts, we expect to find a smaller effect size in Europe, primarily due to the higher baseline participation rates in European elections. While there are many institutional and electoral differences between the United States and European countries, previous research suggests that differences in effectiveness of GOTV interventions can largely be attributed to baseline voter participation (Bergh and Christensen Reference Bergh and Christensen2022). This expectation is also supported by the correlation between effect size and baseline turnout, to which we return in the meta-analysis.
The United States has been a frontrunner in introducing digital messaging as a mobilization tool. Dale and Strauss (Reference Dale and Strauss2009) initially tested the effect of sending an SMS reminder to registered voters who had signed up for a reminder SMS. They found that SMS reminders yielded a significant ITT effect of 3.0 percentage points. Dale and Strauss (Reference Dale and Strauss2009) focused on warm SMS, where the sender has a prior relationship with the recipient, in contrast to cold SMS, where no prior relationship exists (Mann and Haenschen Reference Mann and Haenschen2024). Malhotra, Michelson, Rogers et al. (Reference Malhotra, Michelson, Rogers and Valenzuela2011) were the first to examine the effects of cold SMS during various elections in California and found modest yet statistically significant impacts – specifically, a 0.7 percentage point increase in local elections and a 0.9 percentage point increase in statewide elections. Thus, when estimating the average ITT effect size of digital messages, it is crucial to differentiate between types of SMS. The type of message is closely linked to the sender of the messages. Some experiments collaborate with advocacy organizations, such as political parties, and rely on samples of voters who have pre-registered as supporters of a specific party. These organizations provide researchers with lists of voters who have signed up to receive information and who can be used as the study population (Foos Reference Foos2015). Other studies collaborate with official authorities and send messages to voters who have not opted in to receive information. Cheng-Matsuno, Kennedy, Marshall et al. (Reference Cheng-Matsuno, Kennedy, Marshall and van der Linden2023) find that the effect of digital messages on voter turnout varies depending on the sender, with the greatest impact observed for messages sent by official authorities. For our meta-analysis, we will exclusively include studies that utilize cold messages without any party endorsement or party affiliation – an approach that has been the most widely applied type of SMS mobilization in Europe – to ensure consistency in evaluating their effectiveness. By focusing on cold messages sent from official authorities, we ensure that all voters have an equal probability of receiving the message, and that no prior contact or partisan targeting has taken place, which could introduce selection bias and limit the generalizability of the conclusions.
Besides the type and sender of the SMS, electoral salience is recognized as a crucial predictor of mobilization effectiveness. Understanding the electoral salience context is essential before comparing effect sizes (Mann and Haenschen Reference Mann and Haenschen2024). Salience measures public interest in each election; in high-salience elections, voters are more motivated to participate, while in low-salience elections, only a small group of highly engaged voters tends to take part. Researchers have shown that mobilization effects are generally less effective in high-salience contexts compared to low-salience ones (Malhotra, Michelson, Rogers et al. Reference Malhotra, Michelson, Rogers and Valenzuela2011; Gerber, Huber, Fang, et al. Reference Gerber, Huber, Fang and Gooch2017; Bhatti, Dahlgaard, Hansen et al. Reference Bhatti, Dahlgaard, Hansen and Hansen2019b; Bergh and Christensen Reference Bergh and Christensen2022; Green and Gerber Reference Green and Gerber2023). The expected mechanism is that, in high-salience elections, the share of voters who always vote (‘always takers’) is higher than in low-salience elections. As a result, it is more difficult to mobilize voters in high-salience elections, because many voters will go to the polling station and vote regardless of whether they receive a reminder message (Arceneaux and Nickerson Reference Arceneaux and Nickerson2009). In our meta-analysis, we will include effect sizes from both high-salience and low-salience elections in Europe, but we will present them separately to highlight their distinct impacts.
When estimating the effect of digital messaging, it is important to consider the electoral context. Simply including electoral salience is not sufficient for reliable comparisons. For instance, while nationwide elections are characterized as high-salience elections across contexts, voter participation can vary significantly. For example, the participation rate in municipal elections in Nordic countries, which are considered low-salience, is often higher than the participation rate for nationwide elections in the United States, which are classified as high-salience. Therefore, it is crucial to understand the electoral context before comparing effect sizes. Bhatti, Dahlgaard, Hansen et al. (Reference Bhatti, Dahlgaard, Hansen and Hansen2019b) find substantially smaller effects of door-to-door canvassing to increase turnout in Western Europe than in the United States, pointing out how mobilization tools work differently in an American electoral context compared to a European one. Differences between effect sizes in mobilization strategies in the United States and Europe have often been attributed to the high participation rate in Europe. A high participation rate makes it difficult to mobilize voters simply because the pool of potential people to mobilize is smaller. In addition to differences in participation rates between Europe and the United States, an important institutional distinction is that voters in the United States must be registered before they can vote. This requirement reflects a key feature of the American electoral context and sets it apart from most European systems. In this meta-analysis, we only include European countries to ensure the uniformity of the electoral context. Countries aside from the United States that have applied cold, digital messaging are only the Nordic countries – Denmark, Norway, Sweden, and Finland (Bhatti, Dahlgaard, Hedegaard et al. Reference Bhatti, Dahlgaard, Hedegaard and Hansen2014b; Bhatti, Dahlgaard, Hansen et al. Reference Bergh, Christensen and Matland2019; Hirvonen, Lassander, Sääksvuori et al. Reference Hirvonen, Lassander, Sääksvuori and Tukiainen2025; Lindgren, Nyman and Oskarsson Reference Lindgren, Nyman and Oskarsson2025). Thus, our sample will solely rely on the Nordic countries.
However, Bergh, Christensen and Matland (Reference Bergh, Christensen and Matland2019) showed that even among Norwegian citizens over 30 whose parents were born in Norway, with a baseline turnout of 73 percentage, digital messages generate a 0.96 percentage point increase in turnout. This indicates that digital messaging might be a potential tool to increase voter turnout in Europe even though there is a high turnout rate. Digital messaging has, like traditional canvassing, heterogeneous effects, making the digital messaging intervention even more effective for specific groups. An important aspect of digital messaging is its potential to enhance voter turnout among marginalized voters. Increasing voter turnout more for marginalized voters than for the majority increases equality in turnout. In evaluating which voters are most influenced by digital messages, a Norwegian study indicates an ITT effect of 4.58 percentage points among young Norwegian citizens whose parents were born in Norway. Foreign nationals who have recently established Norwegian residency show an ITT effect of 2.93 percentage points, and among immigrants who have lived in Norway for 7 years or more, the treatment effect was 2.7 percentage points (Bergh, Christensen and Matland Reference Bergh, Christensen and Matland2019). In other words, the effect of digital messaging was higher for young voters and immigrants, both groups with a low propensity to vote. In addition to digital mobilization messages, prior research shows that experiences of exclusion can also mobilize immigrant voters (Spierings and Vermeulen Reference Spierings and Vermeulen2024; Spies, Mayer and Goerres Reference Spies, Mayer and Goerres2020). Ongoing national migration policies and political discourse may increase political engagement during elections, such that receiving a digital message reminding voters to vote can help enable turnout. Thus, the effectiveness of digital messaging targeted at immigrants may be conditioned by the surrounding political debate.
There is a discussion in the literature regarding whether digital messages will increase or decrease equality in voting. Dale and Strauss (Reference Dale and Strauss2009) argue that text messages will be most relevant for individuals with prior voting experience. These individuals have already shown both the capacity for rational cost-benefit evaluation and a consistent willingness to vote. Enos, Fowler and Vavreck (Reference Enos, Fowler and Vavreck2014) investigate how different mobilization interventions influence the participation gap by analyzing the kind of voters who are mobilized. They examine 24 studies and find that GOTV interventions are more effective at mobilizing high-propensity voters, while low-propensity voters are the least likely to change their voting behavior. Mobilizing voters with prior voting experience may exacerbate the disparity between high-propensity and low-propensity voters. This highlights the importance of understanding not just the overall effect of digital campaigning but also the heterogeneous effects of mobilization tools. If mobilization efforts primarily engage high-propensity voters, the gap between high-and low-propensity voters will widen, leading to an even greater under-representation of those with low voting propensity. However, studies in Nordic countries have shown that digital messaging can effectively reach and mobilize low-propensity voters. Concerning the heterogeneous effects of SMS, we distinguish between three voter groups: youth (voters between 18 and 29 years old), immigrants (first and second generation), and all voters. The all-voters group acts as a comparison group for the two low-propensity voter groups.
Besides the part of the literature focusing on the effectiveness of different modes of contact, another branch of literature examines the effectiveness of various types of messages (Bhatti, Dahlgaard, Hedegaard et al. Reference Bhatti, Dahlgaard, Hedegaard and Hansen2017a). Drawing from political psychology and prospect theory, Bhatti, Dahlgaard, Hedegaard et al. (Reference Bhatti, Dahlgaard, Hedegaard and Hansen2017a) tested a series of distinct messages and found no significant differences in effectiveness across message content. The messages were framed in terms of loss and gain, highlighting the benefits, pivotality, and duty of voting. While there was no significant variation in the effect of SMS content, the meta-analysis does not differentiate between types of SMS content. Evidence that message content plays a limited role suggests that the primary mechanism in mobilizing voters is the simple act of receiving a message. Digital messages appear to increase voter turnout primarily by functioning as a reminder rather than as persuasive appeals. This suggests that the crucial mechanism is prompting voters to act on pre-existing intentions, rather than convincing them to spend time casting a ballot.
Based on the theoretical distinctions in the literature, we will calculate the mean estimate of receiving cold messages in a European context. We distinguish between high-and low-salient elections and focus on three groups of voters to investigate heterogeneous effects.
Analytic procedure: meta-analysis
To identify studies, we have used the article by Mann and Haenschen (Reference Mann and Haenschen2024) as our starting point, which incorporates European studies on digital messaging as a robustness check to determine if it alters their results. Additionally, we have searched Google Scholar and Web of Science, and to include potential work-in-progress results in the meta-analysis, we reached out to European colleagues. To estimate the average effects of digital messaging, we employed a weighted measure based on the standard errors of the studies. Thus, studies with more precise estimates carry more weight in the analysis than those with more error-prone estimates. We use the ITT estimate from the studies to facilitate direct comparison.
As suggested by Mann and Haenschen (Reference Mann and Haenschen2024), we distinguish between low-salient elections, which include municipal elections and elections for the European Parliament, while categorizing nationwide elections as high-salient elections. To identify whether there is a significant difference between digital mobilization messages in high-and low-salient elections, we include a chi-square test at the bottom of the meta-analysis.
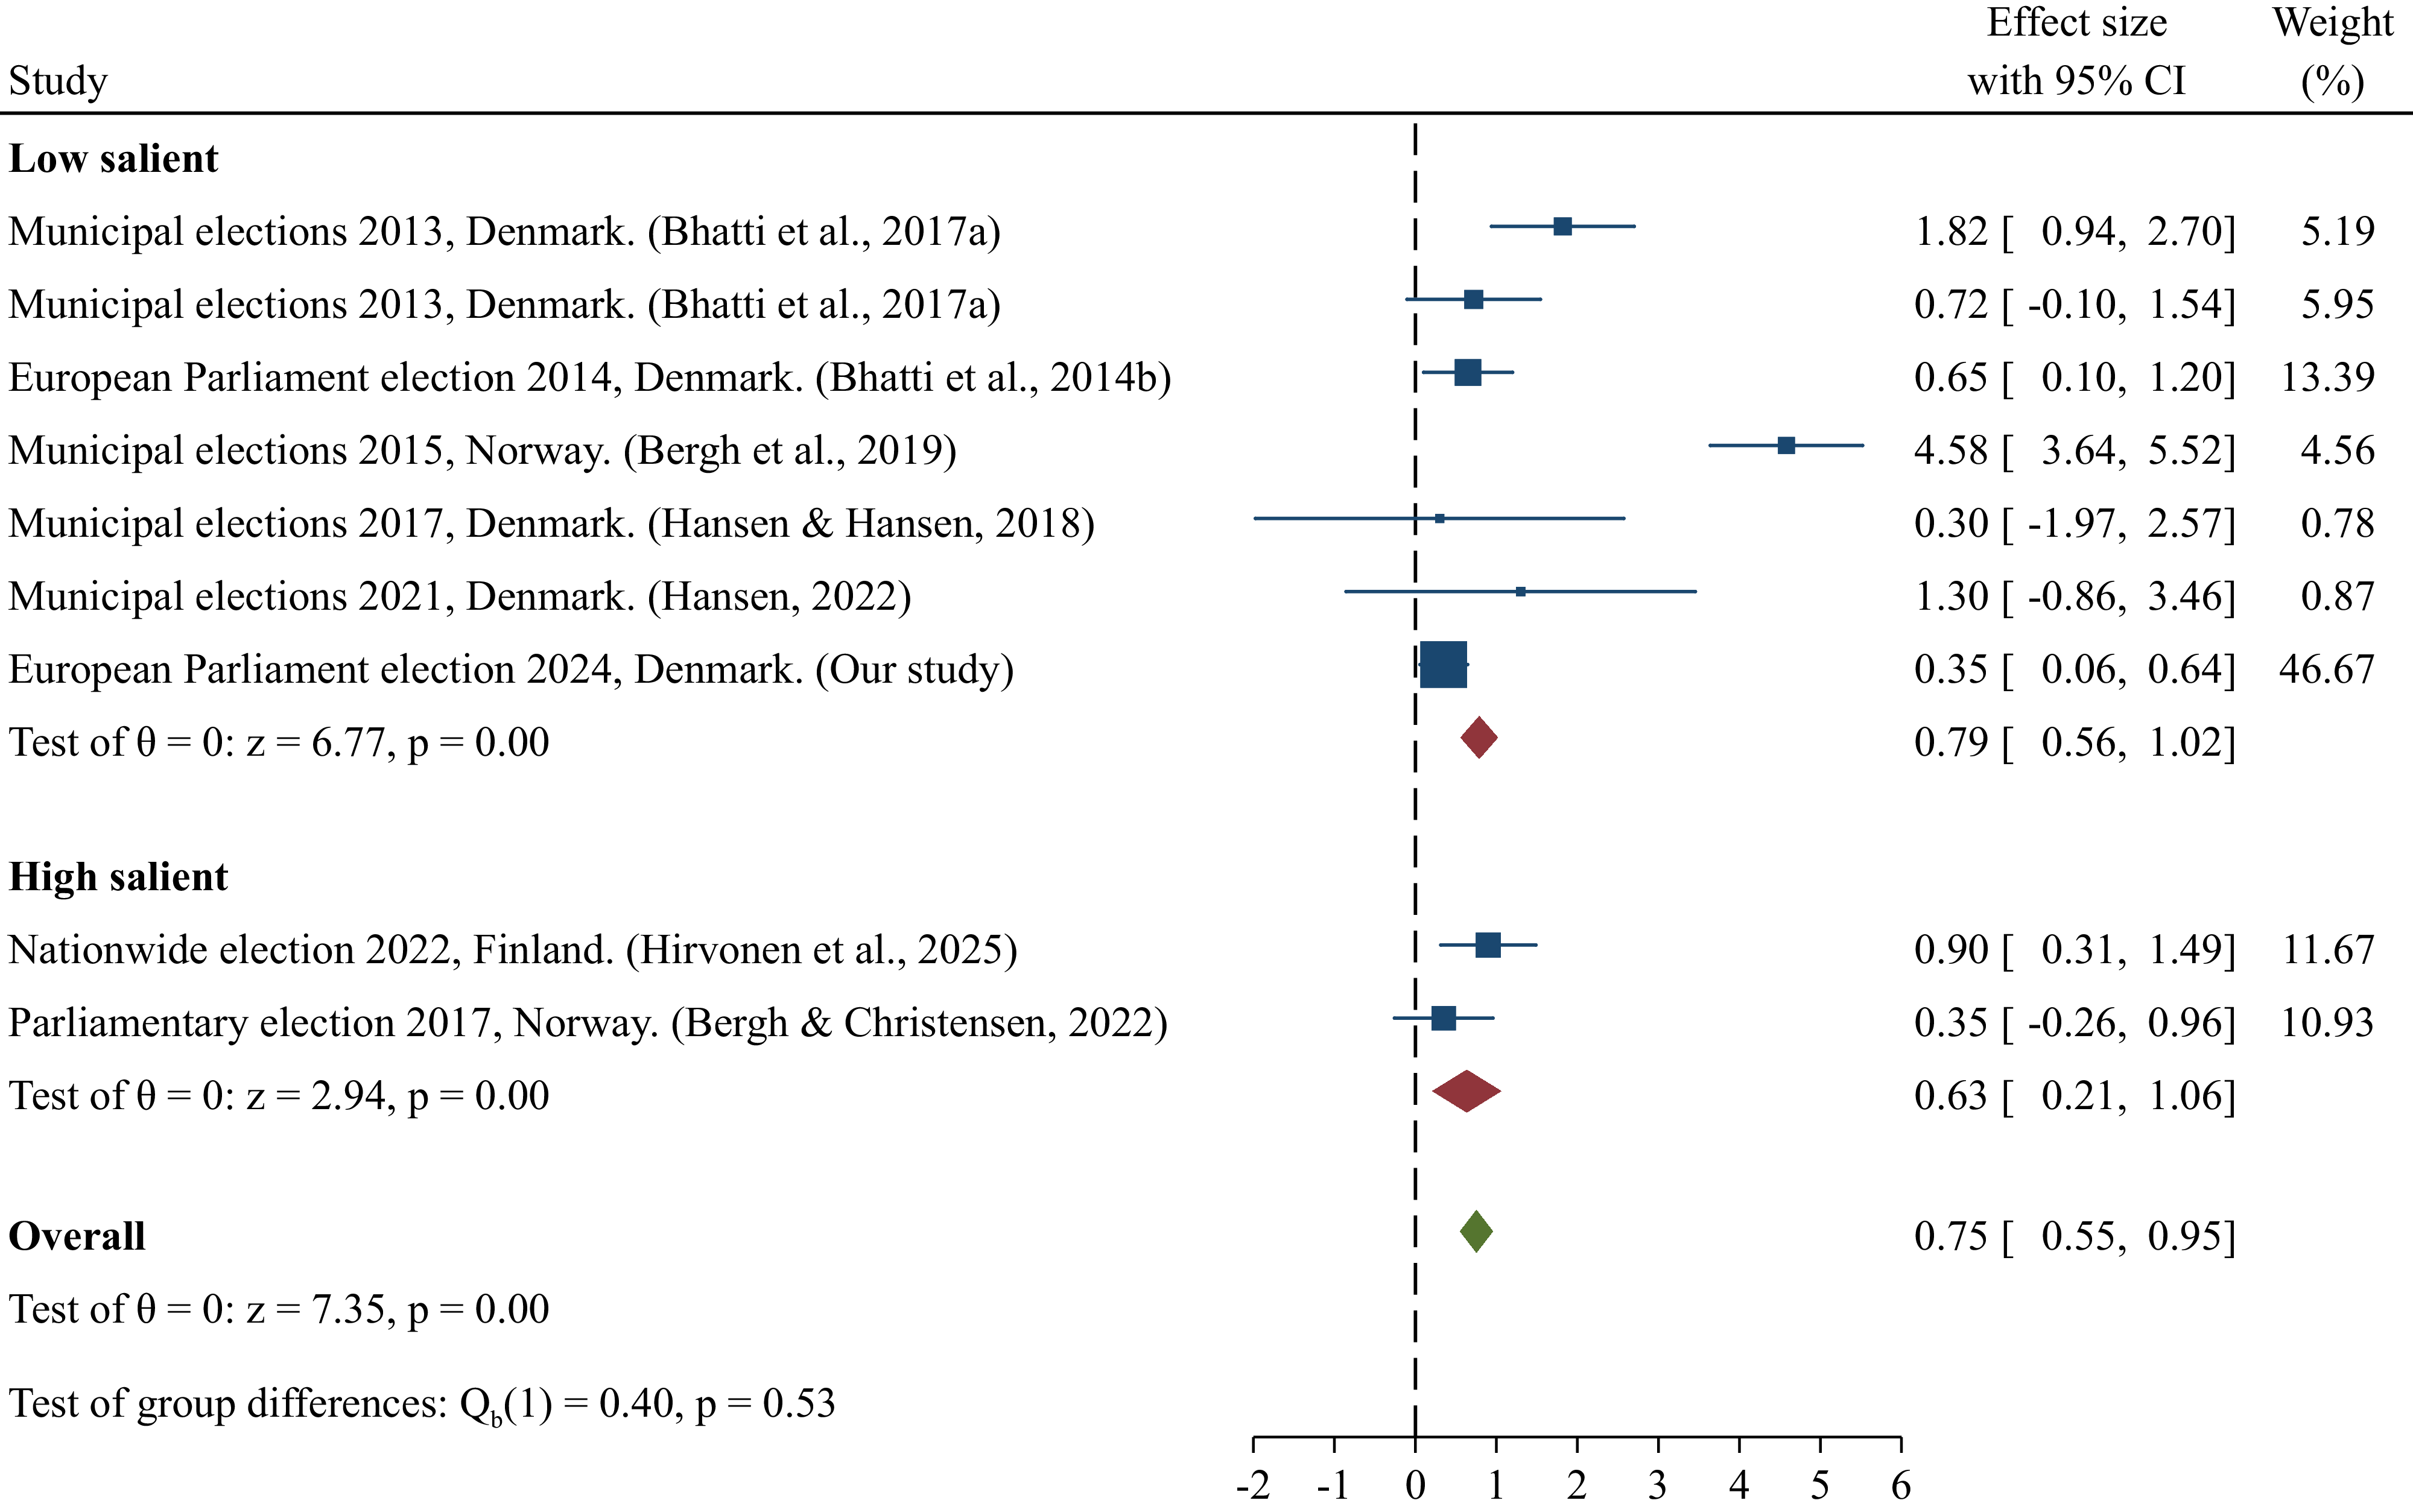
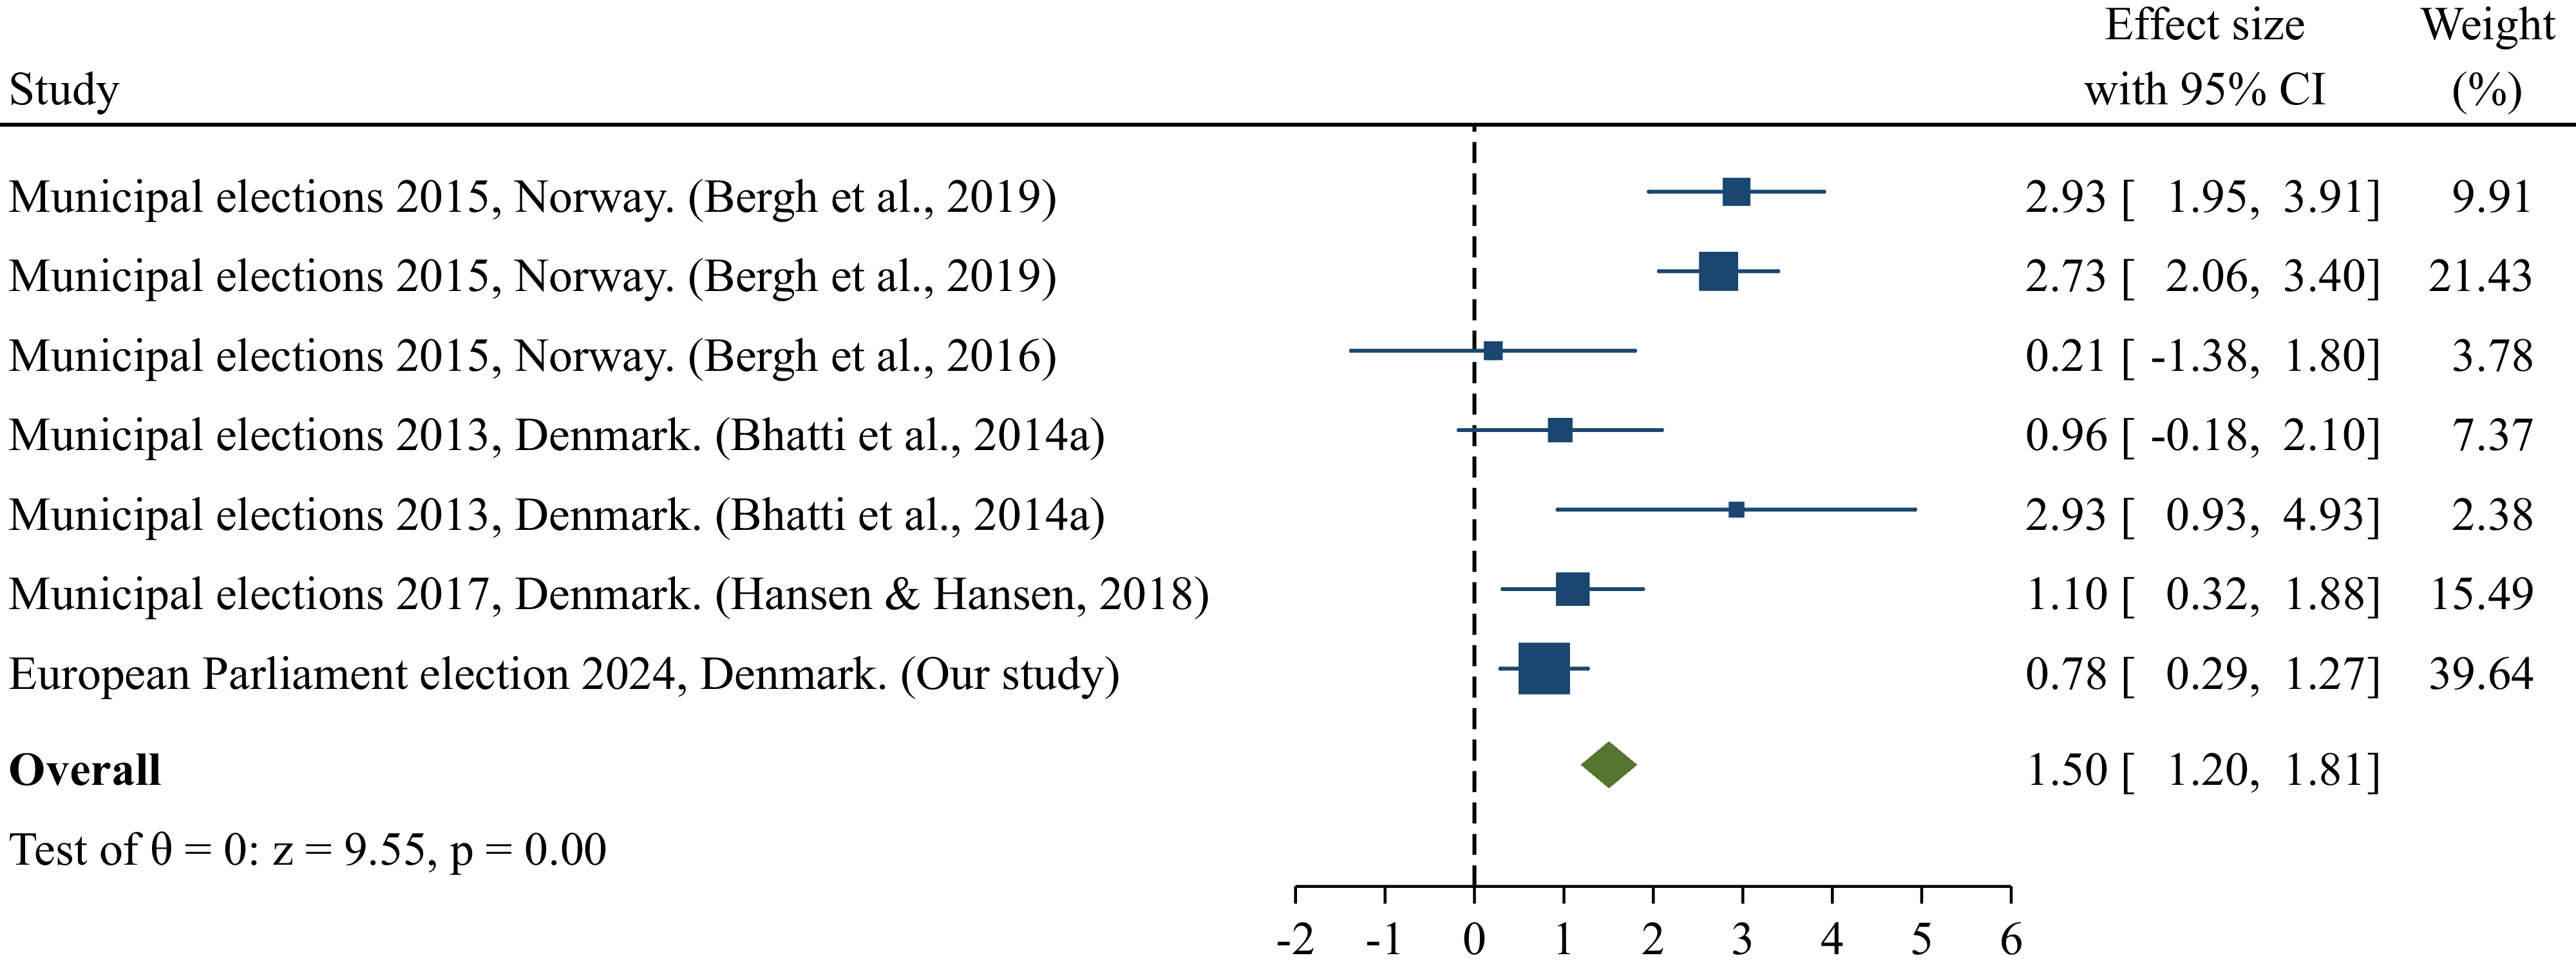
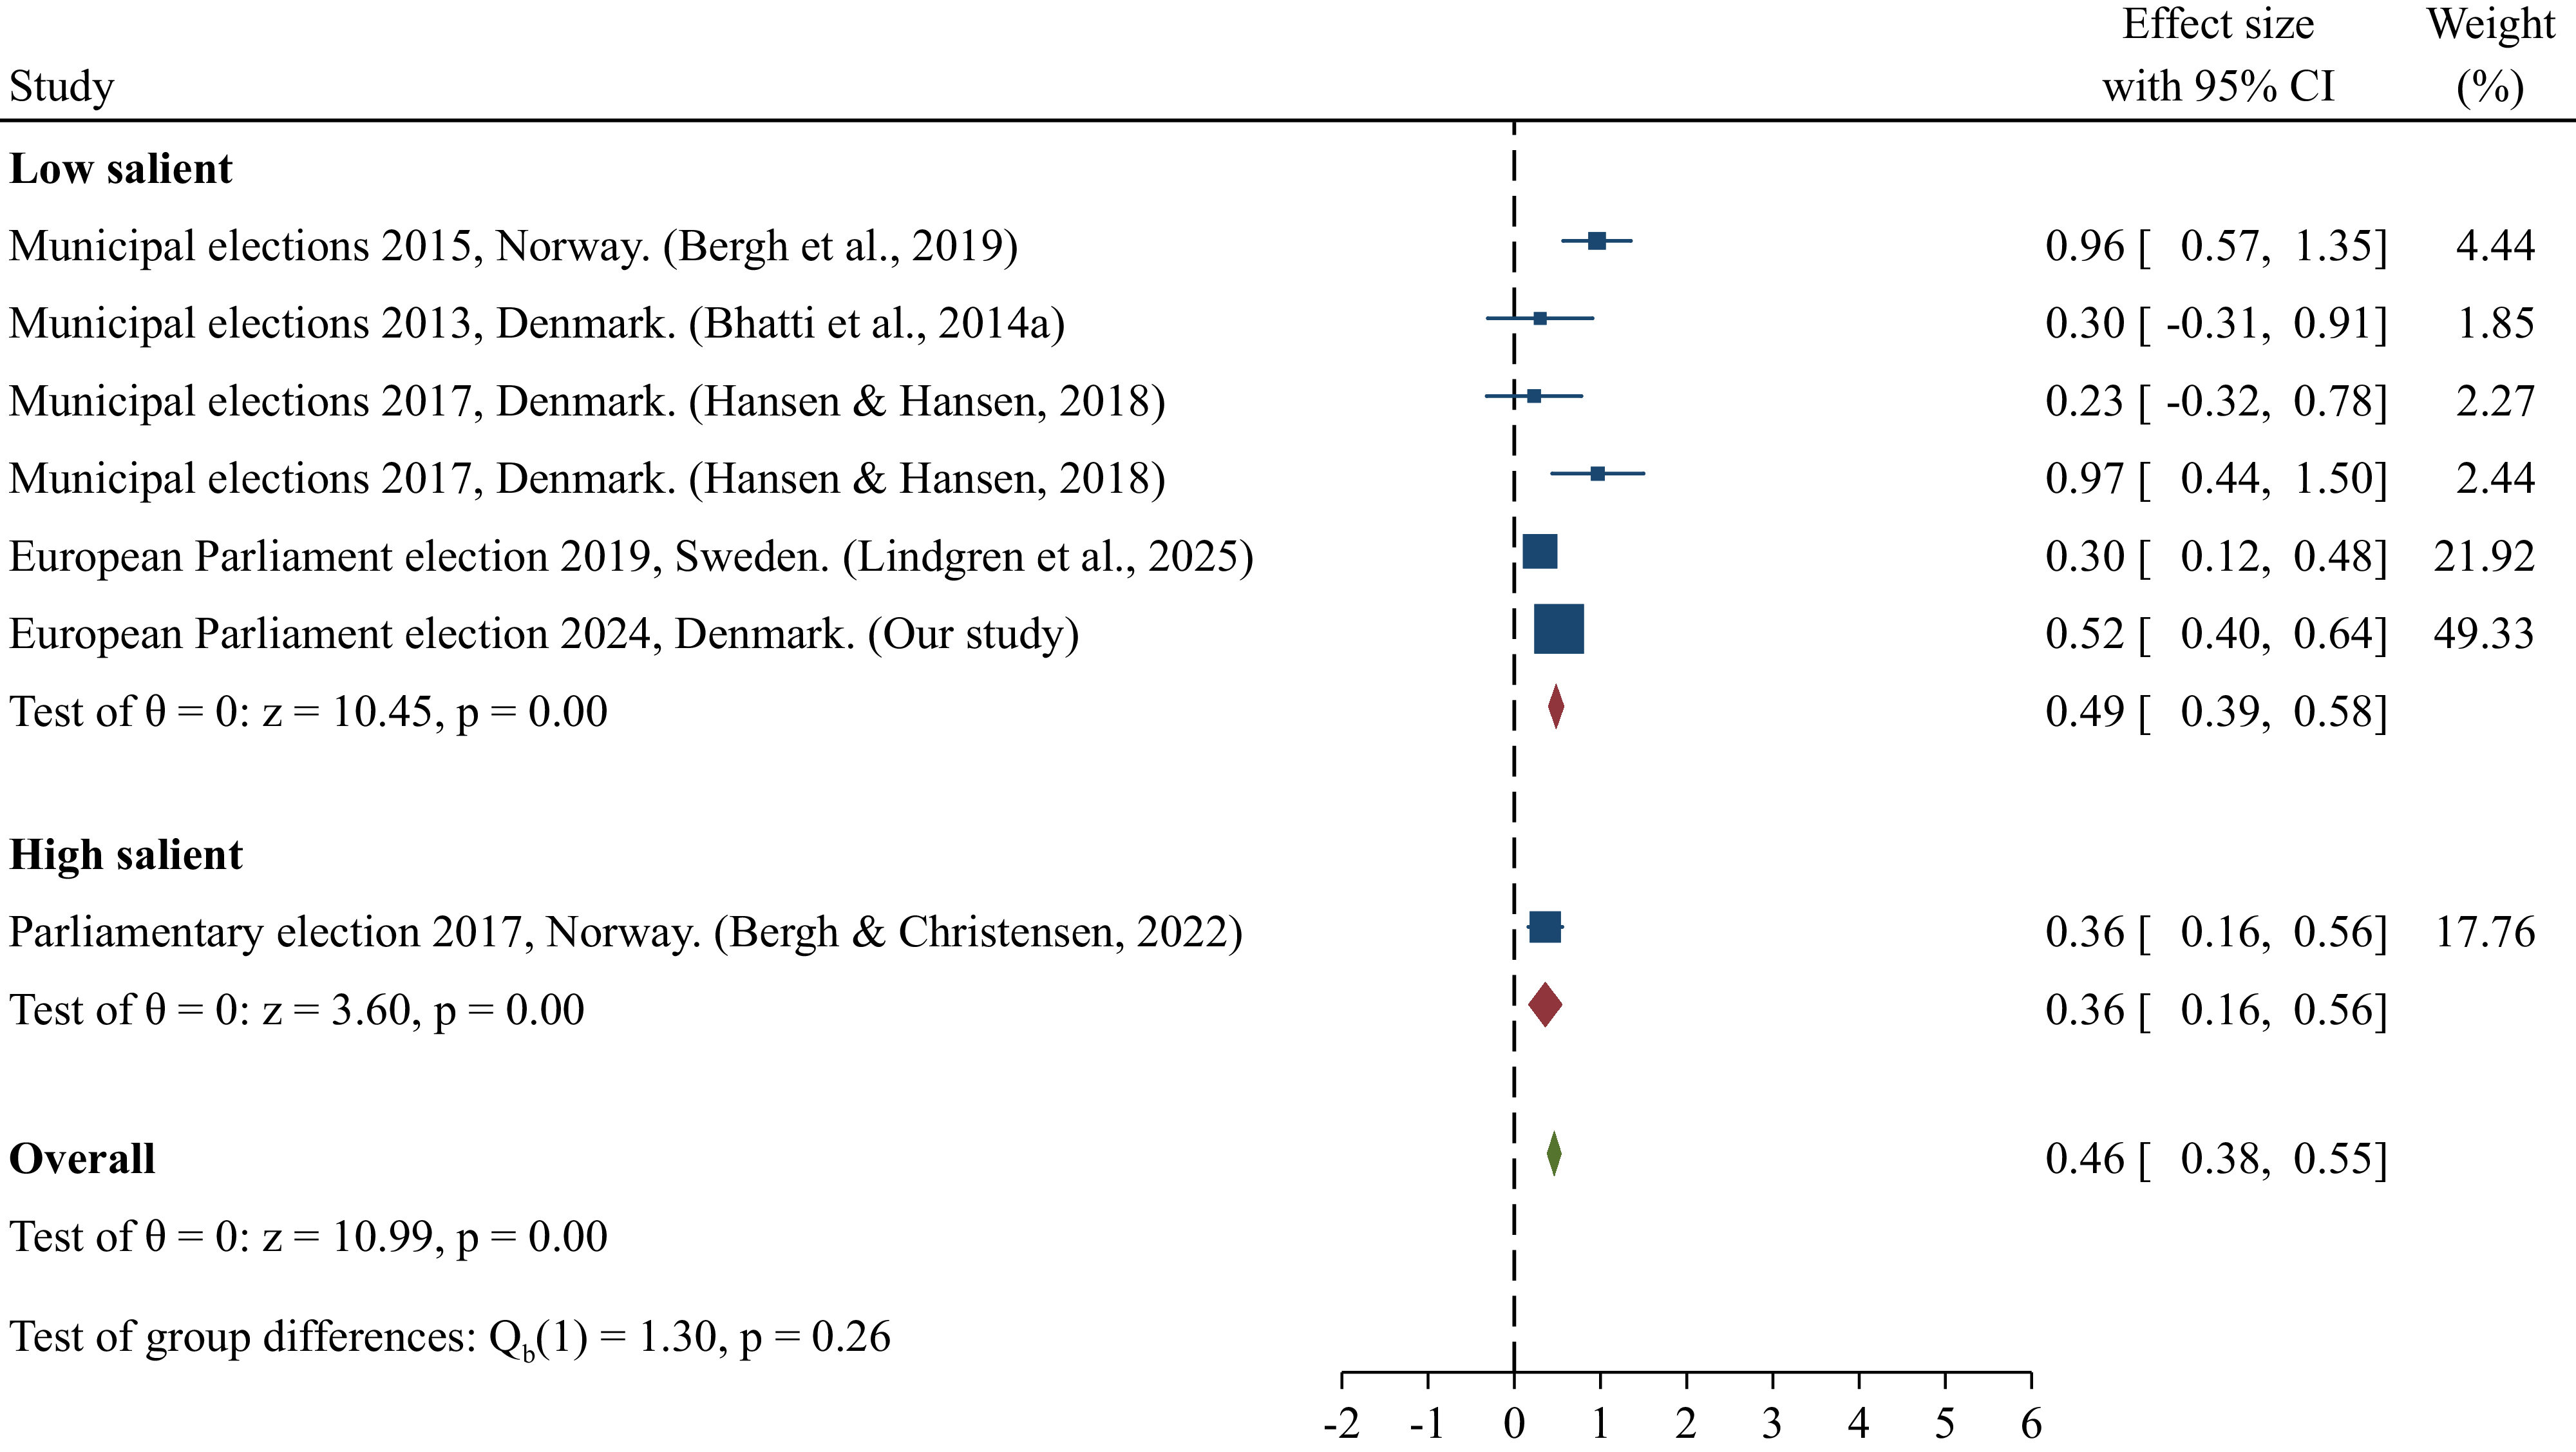
Each Figure 1, 2 and 3 depicts the mean estimated treatment effect (θ) and tests whether the calculated mean estimate is significantly different from zero. The mean estimated effect is visualized as a red diamond at the bottom of each plot, and the width of the diamond represents the 95 percentage confidence interval for the mean estimated effect. Each meta-analytic estimate is shown with a blue square and plotted with a 95 percentage confidence interval. The size of each square represents the weight of the individual experiment in the meta-analysis. We have included the results of the GOTV experiment for the European Parliament election in 2024 in Denmark in the meta-analysis, labeled as ‘our study’, which is the study we will present later in this paper. See online supporting information for meta-analysis estimates without our own results (Figures S1–S3). Finally, we have divided all the studies into three different groups corresponding to different voter groups: young, immigrants, and all voters.
Meta-analytic estimates of digital messages to young voters by electoral salience.
Note: Young voters are operationalized as 18–29-year-old voters. Bhatti, Dahlgaard, Hedegaard (Reference Bhatti, Dahlgaard, Hedegaard and Hansen2017a) have looked at 2nd and 3rd time local elections voters, where the mean age was 25.7 (effect size = 1.82) and at 1st, 2nd, and 3rd times voters with a mean age at 22.7 (effect size = 0.72). Bergh, Christensen and Matland (Reference Bergh, Christensen and Matland2019) only include Norwegian citizens below the age of 30 and whose parents were born in Norway (effect size = 4.58), and Hansen (Reference Hansen2022) excludes first-time voters, applying voters between 19 and 29 years old (effect size = 1.30). Hirvonen et al. (Reference Hirvonen, Lassander, Sääksvuori and Tukiainen2025) report an Average Treatment Effect (ATE) estimate. For additional information about the studies, see Table S1 in the online supporting information.

Figure 1. Long description
The table presents meta-analytic estimates of digital messages to young voters by electoral salience. It includes two main sections: Low salient and High salient, each listing different studies with their respective effect sizes and weights. The Low salient section has eight studies, while the High salient section has two studies. Each study is listed with its effect size, 95% confidence interval, and weight percentage. The table also includes overall tests of effect size and group differences. The studies are from various elections in Denmark, Norway, and Finland, conducted between 2013 and 2025. The effect sizes range from -0.10 to 4.58, and the weights range from 0.56% to 46.67%.
Meta-analytic estimates of digital messages to immigrants.
Note: All studies conducted for immigrants are low-salience elections. The first study by Bergh, Christensen and Matland (Reference Bergh, Christensen and Matland2019) estimates the effect for first-time voters with foreign nationals (effect size = 2.93), the second estimate is for first-generation immigrants (effect size = 2.73), and Bergh, Christensen and Matland (Reference Bergh, Christensen and Matland2016) estimate the effect for second-generation immigrants (effect size = 0.21). The two studies by Bhatti, Dahlgaard, Hedegaard et al. (Reference Bhatti, Dahlgaard, Hedegaard and Hansen2014a) present one estimate for the first-generation (effect size = 0.96) and a second estimate for the second-generation (effect size = 2.93). Hansen and Hansen (Reference Hansen and Hansen2018) present one joint estimate for both first and second generation (effect size = 1.10). For additional information about the studies, see Table S1 in the online supporting information.

Meta-analytic estimates of digital messages to all voters by salience.
Note: All voters are operationalized as voters above 30 years. Bergh, Christensen and Matland (Reference Bergh, Christensen and Matland2019) only include Norwegian citizens aged 30 years or more and whose parents were born in Norway (effect size = 0.96), while all ages are included in Bhatti, Dahlgaard, Hedegaard et al. (Reference Bhatti, Dahlgaard, Hedegaard and Hansen2014a) (effect size = 0.3) and Bergh and Christensen (Reference Bergh and Christensen2022) (effect size = 0.36). Hansen and Hansen (Reference Hansen and Hansen2018) include, first, voters above 40 years (effect size = 0.23), and second, all Danish citizens whose parents were born in Denmark (effect size = 0.97). Lindgren, Nyman and Oskarsson (Reference Lindgren, Nyman and Oskarsson2025) estimate for all voters aged 18–75. For additional information about the studies, see Table S1 in the online supporting information.

In the meta-analysis for digital experiments, the estimated mean ITT of young voters is 0.79 percentage points (CI: 0.56, 1.02, n = 7) in low-salience elections and 0.63 (CI: 0.21, 1.06, n = 2) in high-salience elections. The overall estimate for the effectiveness of digital messaging in mobilizing young voters across different types of elections is 0.75 percentage points (CI: 0.55, 0.95, n = 9). The estimated mean ITT for immigrants (both first-and second-generation) is 1.50 percentage points (CI: 1.20, 1.81, n = 7) in low-salience elections, which is the only type of election where digital messages have been applied as a mobilization tactic for immigrants. The two low-propensity voter groups show a higher estimated mean ITT compared to high-propensity voters, represented by the all-voter group. The estimated mean ITT for all voters is 0.49 percentage points (CI: 0.39, 0.58, n = 6) in low-salience elections and 0.36 (CI: 0.16, 0.56, n = 1) in high-salience elections. The overall estimate for the effectiveness of digital messaging in mobilizing all voters across different types of elections is 0.46 percentage points (CI: 0.38, 0.55, n = 7). The meta-estimated effects indicate that digital messaging has a different impact on low-propensity voters compared to high-propensity voters. Specifically, digital messaging increases turnout by approximately 0.45 percentage points for all voters, 0.75 percentage points for young voters, and 1.5 percentage points for immigrants.
In all meta-analyses, the mean treatment effects are statistically different from zero and highlight the effect of digital mobilization interventions. Moreover, the meta-analysis provides a comparison (chi-square test) between high-and low-salient elections for young and all voters in the test of group differences. The meta-analysis reveals no significant differences between high-and low-salient elections for either young voters or all voters (p = 0.53 for young voters and p = 0.43 for all voters). However, we observe the same pattern as in Mann and Haenschen’s meta-analysis (Reference Mann and Haenschen2024), with a greater effect in low-salient elections compared to high-salient elections. Furthermore, we test whether the effect size of digital messages depends on baseline turnout. Figure S4 in the online supporting information presents the correlation between the intervention effect size and baseline turnout in the control group for all three subgroups. The results show that the effect size of the intervention decreases as baseline turnout increases. This pattern is evident for both immigrants and young voters. For all voters, however, the effect size remains relatively consistent across varying levels of baseline turnout. Baseline turnout therefore matters for the effectiveness of digital messages and highlights the importance of taking baseline turnout into account when evaluating digital GOTV interventions.
Having established a robust foundation regarding the effects of digital messaging on voter turnout, we proceed to present our own experiment in order to investigate heterogeneous effects, including those within smaller subpopulations. First, we introduce the experimental context before moving on to the results.
A population GOTV experiment: a random control trial
European Parliament elections in Denmark, as well as in many other member states of the European Union, are characterized by low participation rates due to their status as low-salience elections (European Parliament 2025). In the previous European Parliament elections in Denmark in 2019,Footnote 1 2014, and 2009, the election was held concurrently with a high-salience first-order election or national referendums. This led many voters to exercise their voting rights in the European election while they were already at the ballot box. In 2024, this was not the case. On 9 June 2024, the European Parliament election was the only election held at that time. Decision-makers and researchers pointed out that if nothing was done to boost the turnout, the election might very well experience a huge plummet in electoral participation. Thus, the parliament decided to commission a large digital GOTV experiment for the authors. The treatment and messages were decided and designed by the parliament with the advice of the authors. The digital treatments were each tailored to a specific age group for maximal impact. The treatments for the youngest applied more humor and a more casual style of writing (see the online supporting information for treatments). All messages had similar politically neutral messages encouraging eligible voters to vote. The sender was the Danish Parliament. As an official institutional actor, the Danish Parliament carries high legitimacy, and the sender of the treatment may therefore be perceived as more neutral than partisan organizations or non-governmental organizations, potentially increasing the likelihood that voters followed the recommendation.
In Denmark, there is automatic registration to vote, and thus it is possible for researchers to get access to the entire list of registered voters. Before the election, we randomized this list of registered voters into treatment and control groups. In Denmark, there is a very efficient system of digital mail where all public institutions can send mail directly to individuals. Less than 5% of the population is not in the system and still receives, e.g., government letters in hard copy. This group is mostly elderly, and, for example, in the group under 55 years old, there is only 1% that do not receive digital mail. Along with digital mail, there is also an SMS and email notification, which most recipients of digital mail receive instantly when the digital mail is sent.
Compared to the many previous GOTV experiments in Denmark, e.g., those that only used SMS to contact the voters,Footnote 2 the reach is much more precise, as the digital mail system is directly linked to the Personal Security System that covers all people living in the country. It is only the voters who had digital mail that were part of the experiment; non-digital mail receivers were removed from the population before the randomization into treatment and control groups. This also goes for voters registered with non-disclosure of name and address, declared incapable of managing their own affairs, or registered without a name or an address. Table 1 shows the exclusion of voters before randomization into treatment and control and the loss of voters in the experiment due to other reasons. After randomization, we excluded voters who were also assigned to receive a physical GOTV message as part of another experiment, to ensure the estimation solely reflected the effect of digital mobilization. We also excluded voters without information about their voter turnout. Finally, to maintain a clean control group, we excluded voting districts in municipalities where similar mobilization messages were sent by the municipality itself to encourage voting. This was done to avoid downstream effects that could arise if we included municipalities that had also sent out digital information.
Overview of the digital mail experiment

Table 1. Long description
The table shows the exclusion of voters before randomization into treatment and control groups and the loss of voters in the experiment due to other reasons. It has 10 rows and 2 columns. The columns are labeled ‘Voters’ and ‘Voters’. The rows are labeled with different categories of voters and reasons for their exclusion. Row 1: Voters entitled to vote on election day 9th of June 2024, 4,301,255. Row 2: Included in the main population, but lack eligibility, e.g., due to death, -1,543. Row 3: Main population, 4,302,798. Row 4: Excluded due to non-disclosure of name and address, 81,967. Row 5: Excluded due to being declared incapable of managing their own affairs, 2,267. Row 6: Excluded due to being registered without name or address, 1,645. Row 7: Excluded because exempted from receiving digital mails, 246,926. Row 8: Excluded as three municipalities would not provide official voter lists, 151,069. Row 9: Voters included in the randomization, 3,818,924. Row 10: Excluded as voters were randomly assigned to receive physical GOTV-message, 28,102. Row 11: Excluded as Information in Statistic Denmark population could not be linked, 39. Row 12: Excluded as individual turnout information does not exist, 139,525. Row 13: Excluded as voted absentee, 197,999. Row 14: Excluded as municipality distributed similar GOTV-messages, 145,977. Row 15: Excluded researchers assigned to all conditions, 2. Row 16: Excluded voters living with a first-time voter (mainly parents or older siblings), 155,416. Row 17: Voters analyzed in the pooled digital mail experiment, 3,151,864.
Note: *some municipalities were not able to provide voter lists for all districts within their municipality. +all voters in this group received the treatment but were excluded from the experiment. The online supporting information provides a balance check of pretreatment variables, showing that the experimental groups are identical across treatment and control groups (Tables S4 and S5). See Hansen (Reference Hansen2025) for more information on the experiment.
The treatment group received a digital letter along with the SMS and email notification in the week leading up to the election (i.e., Wednesday, Thursday, or Friday). The election was held on Sunday, June 9, 2024. The control group did not receive anything prior to the election. The mobilization message was a cold mobilization message, as no prior commitment had been made with the voters.
The overall turnout for the treatment group was 57.61%, whereas the control group had a slightly lower turnout of 57.09%. Although the turnout rates for the two groups appear similar, the overall pooled effect of the experiment is 0.52 percentage points on turnout (Table 2), which is statistically significant at the 0.001 level. This indicates that the experiment successfully mobilized approximately 15,000 additional voters in this election.Footnote 3 As the random assignment to the treatment and control was slightly different for the youngest age group, 50/50 and 75/25 for the others, inverse probability weights (IPWs) are applied and subsequently the size is weighted to the original size within the experiment. The effect of this procedure is below the number of decimals in the Table, but it is nevertheless the correct way of handling pooling experiments of different assignment probabilities (Gerber and Green Reference Gerber and Green2012).
Overall effect of digital mail experiments

Table 2. Long description
A table comparing voter turnout percentages between treatment and control groups. The table has four rows and three columns. Column headers are Overall pooled effect, Voters %, and Voters N. Row 1: Overall pooled effect, ITT-effect on turnout (%-points), 0.52*** (0.06), 3,151,864. Row 2: Turnout treatment, 57.61, 2,349,407. Row 3: Turnout control, 57.09, 802,457.
Note: ***p < 0.001. **p < 0.01. *p < 0.05 (one-sided tests). Standard errors in parentheses, clustered at household. This is the overall pooled effect of all treatment groups. See the online supporting information Table S2, where the results are reported restricting the sample to single-eligible voter households in order to address whether spillover within households might contaminate the results, a potential SUTVA violation (Gerber and Green Reference Gerber and Green2012). In the restricted sample, the effect persists.
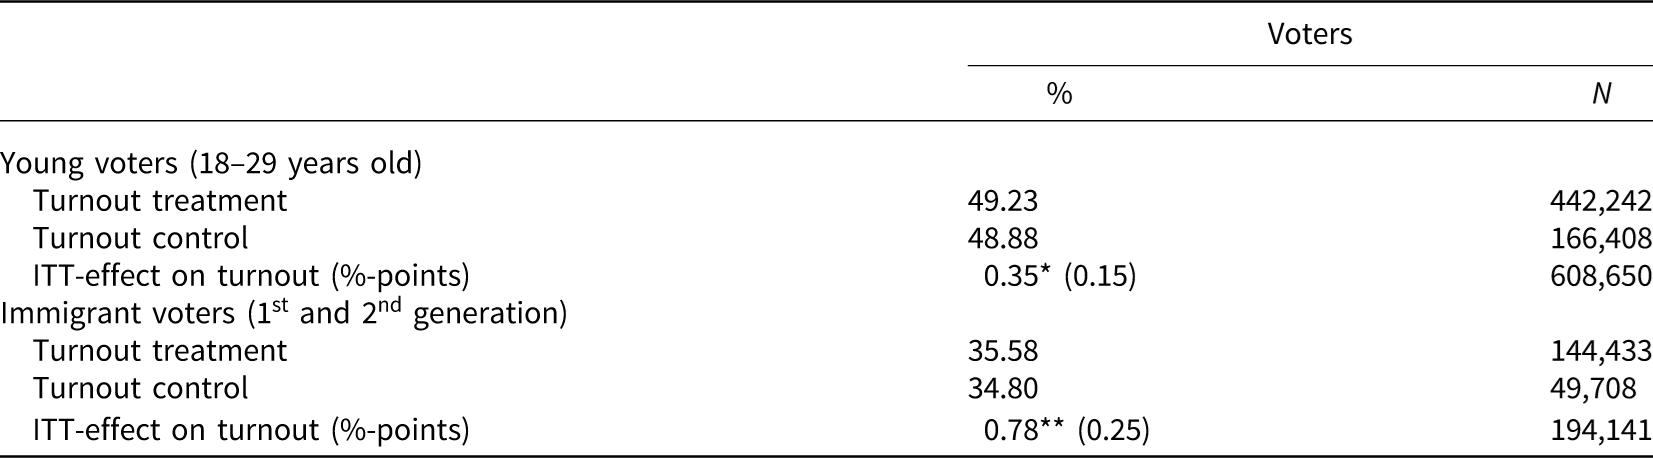
To investigate heterogeneous effects of the digital mobilization message, we estimate the effect among young voters (18–30 years old) and voters with immigrant background (first-and second-generation) to correspond with the meta-analysis. The results are presented in Table 3.
Overall effects for young and immigrant voters

Table 3. Long description
A table comparing voter turnout among young and immigrant voters. The table has 6 rows and 3 columns. Column headers are Turnout treatment, Turnout control, and ITT-effect on turnout. Row labels are Young voters (18-29 years old) and Immigrant voters (1st and 2nd generation). Row 1: Young voters (18-29 years old): Turnout treatment, 49.23 percent, 442,242; Turnout control, 48.88 percent, 166,408; ITT-effect on turnout, 0.35 (0.15) percentage points, 608,650. Row 2: Immigrant voters (1st and 2nd generation): Turnout treatment, 35.58 percent, 144,433; Turnout control, 34.80 percent, 49,708; ITT-effect on turnout, 0.78 (0.25) percentage points, 194,141.
Note: ***p < 0.001. **p < 0.01. *p < 0.05 (one-sided tests). Standard error in parentheses, clustered at household. Normalized inverse probability weights applied; see Table 2. Immigrants are all 1st and 2nd generations regardless of country of origin. The ITT-effect for only non-western 1st and 2nd immigrants is 0.90 (0.27, N = 151,602). The combined group of young and immigrants is analyzed in the online supporting information Table S3.
Overall, the turnout for both young voters (approximately 49%) and immigrants (34–35%) is considerably lower compared to the general voter population. Table 3 indicates that both young voters and immigrants in the treatment group had statistically significantly higher voter turnout compared to the control group, demonstrating a significant effect of the intervention. The overall ITT effect for young voters is 0.35 percentage points, while for immigrants it is 0.78 percentage points.
For young voters, the effect size of the mobilization intervention is smaller in magnitude compared to the overall voter population, while the effect size is larger for immigrants. This indicates a heterogeneous effect in how different segments of voters respond to the intervention. The largest effect is observed among immigrants, aligning with general findings in the meta-analysis. Contrary to the meta-analysis results, the effect of the mobilization messages is less pronounced for young voters compared to the overall voter population.
In general, the effect sizes are somewhat smaller than those observed in previous studies. It is possible that the digital mail system has lost some of its initial novel appeal for voters, as more public institutions now use this channel more frequently. Consequently, there is a risk that voters receive a large volume of official information from authorities, which may cause them to overlook some messages, including our treatment. Concerns about whether the treatment was noticed by the target voters may contribute to the lower expected effect size compared to previous interventions, where communication from public authorities was less frequent. The fact that the digital environment is changing at a rapid pace calls for ongoing evaluations of digital mobilization interventions to assess whether the intervention still has its initial effect.
The effect of digital mobilization messages has the potential to affect more voters than those who receive them. In GOTV literature, spillover effects are often highlighted as a potential strength of mobilization interventions (Nickerson Reference Nickerson2008; Lindgren, Nyman and Oskarsson Reference Lindgren, Nyman and Oskarsson2025). The underlying mechanism is that when one family member is targeted by a campaign, the resulting increase in that individual’s likelihood of voting may also prompt other household members to be reminded of the election and to vote as well. Digital messages may therefore generate contagion effects, which can lead to an underestimation of their overall effectiveness. In our experiment, randomization occurs at an individual level. As a result, some voters assigned to the control group may reside in households with voters who received the treatment and are thus indirectly exposed to the intervention. Because these indirectly treated individuals remain part of the control group, the estimated treatment effects may be biased downward. Accordingly, the reported effect sizes should be interpreted as lower-bound estimates of the true effect of digital mobilization messages. As a robustness check, we restrict the analyses to single-eligible voter households in the supporting information (Table S2) and the effect persists.
Instead of detailing subgroups in the heterogeneous analyses, Figure 4 displays the effect size across the range of turnout propensities. Voters’ propensity to vote depends on the following characteristics: gender, current education level, completed education, age in days, age squared, ethnicity, income, any welfare benefits, household size, marital status, municipality, church membership, parents’ income in the election, and their turnout. Figure 4 reveals that the effect is strongest among voters with medium turnout propensity, while those with very low or very high propensity are less impacted by the treatment. Interestingly, this finding suggests that the treatment has narrowed the turnout gap between high-and medium-propensity voters. The rug plot at the bottom of Figure 4 indicates the number of voters within each percentile across the propensity score distribution. The rug plot shows that there are very few voters who can be characterized as low-propensity voters. Conversely, most voters, based on sociodemographic information, are classified as medium-or high-propensity voters (the distribution of voters by turnout propensity is also illustrated in a density plot in Figure S5 in the online supporting information). This makes it particularly relevant to mobilize voters who have a medium propensity to vote.
Treatment effect over propensity score to vote.
Note: For a propensity score of 0, the estimated probability of voting is close to 0, while a score of 1 corresponds to a probability of 1. The propensity score is calculated based on a logistic regression analysis with turnout in the European election as the dependent variable with standard error clustered at household. The following independent variables are included: gender, current education level, completed education, age in days, age squared, ethnicity, income, any welfare benefits, household size, marital status, municipality, church membership, parents’ income in the election, and their turnout. Missing values are assigned to a distinct value, and all variables except age are categorical. The control group is used for the calculation of the propensity score. It has 802,455 individuals, with a pseudo-R 2 of 11.4%. The lower part of the figure includes a distribution plot, showing how the target group is distributed across the propensity score. Each line represents one percent of the group. See also the online supporting information for distribution propensity score across turnout and observation (Figures S5 and S6). Normalized inverse probability weights applied; see Table 2. Total n = 3,151,864.

One of the advantages of including the entire population in the experiment is the ability to calculate heterogeneous effects of the experiment within very small subsamples. To investigate the effect of the digital messages on voter turnout, we further examine age and immigrant status in greater detail than was possible in the meta-analysis above. Figure 5 shows the treatment effect of the message across ages 18 to 90+. This more detailed view of the relationship between age and the experimental effect reveals several noteworthy patterns. First, among the youngest participants, those aged 18 and 19, the effect of receiving a digital message is lower compared to older voters and statistically insignificant. Since individuals in this age group often live with their parents, it is plausible that parental influence crowds out any impact of the treatment. Simply the fact that the youngest voters tend to live with their parents has a positive effect on their turnout, as living together increases the likelihood of voting (Dahlgaard, Bhatti, Hansen et al. Reference Dahlgaard, Bhatti, Hansen and Hansen2022). Furthermore, in this group they are also all first-time voters, and the hype associated with their first opportunity to vote likely crowds out the potential effect of the treatment (Bhatti, Hansen and Wass Reference Bhatti, Hansen and Wass2012a, Reference Bhatti and Hansen2012b). In addition, it has been shown that parents increase their own turnout when their children become eligible to vote (Dahlgaard Reference Dahlgaard2018). Thus, for first–time voters, the likelihood of being encouraged to vote, and of being surrounded by other voters with whom they can go to the polling station, is relatively high (Bhatti, Fieldhouse and Hansen Reference Bhatti, Fieldhouse and Hansen2018b). The impact of a digital mobilization message is therefore likely to be limited.
Treatment effect on turnout over age on election day (years).
Note: The marginal predicted probabilities are based on a logistic regression analysis with turnout in the European election as the dependent variable with standard error clustered at household. The independent variables are treatment and age in years, age squared. The group 90+ includes everyone over 90 years old, the two oldest being 107 years old. Normalized inverse probability weights were applied; see Table 2. Total n = 3,151,864.

Secondly, among the oldest parts of the population, we also see no effect. It is possible that digital messaging is a difficult mode to reach this part of the population, but it is nevertheless interesting that the effect shows a statistically significant positive impact up to the mid-80s. Finally, Figure 5 reveals that the effect is statistically significant and positive from ages 20 to 87. Together, this suggests that regardless of age, we see an increase in turnout caused by the treatment among most people, with notable exceptions among the very young and very old. This also suggests that the meta-analysis focus on the 18-to 30-year-old group might not be a relevant age interval for differentiating treatment.
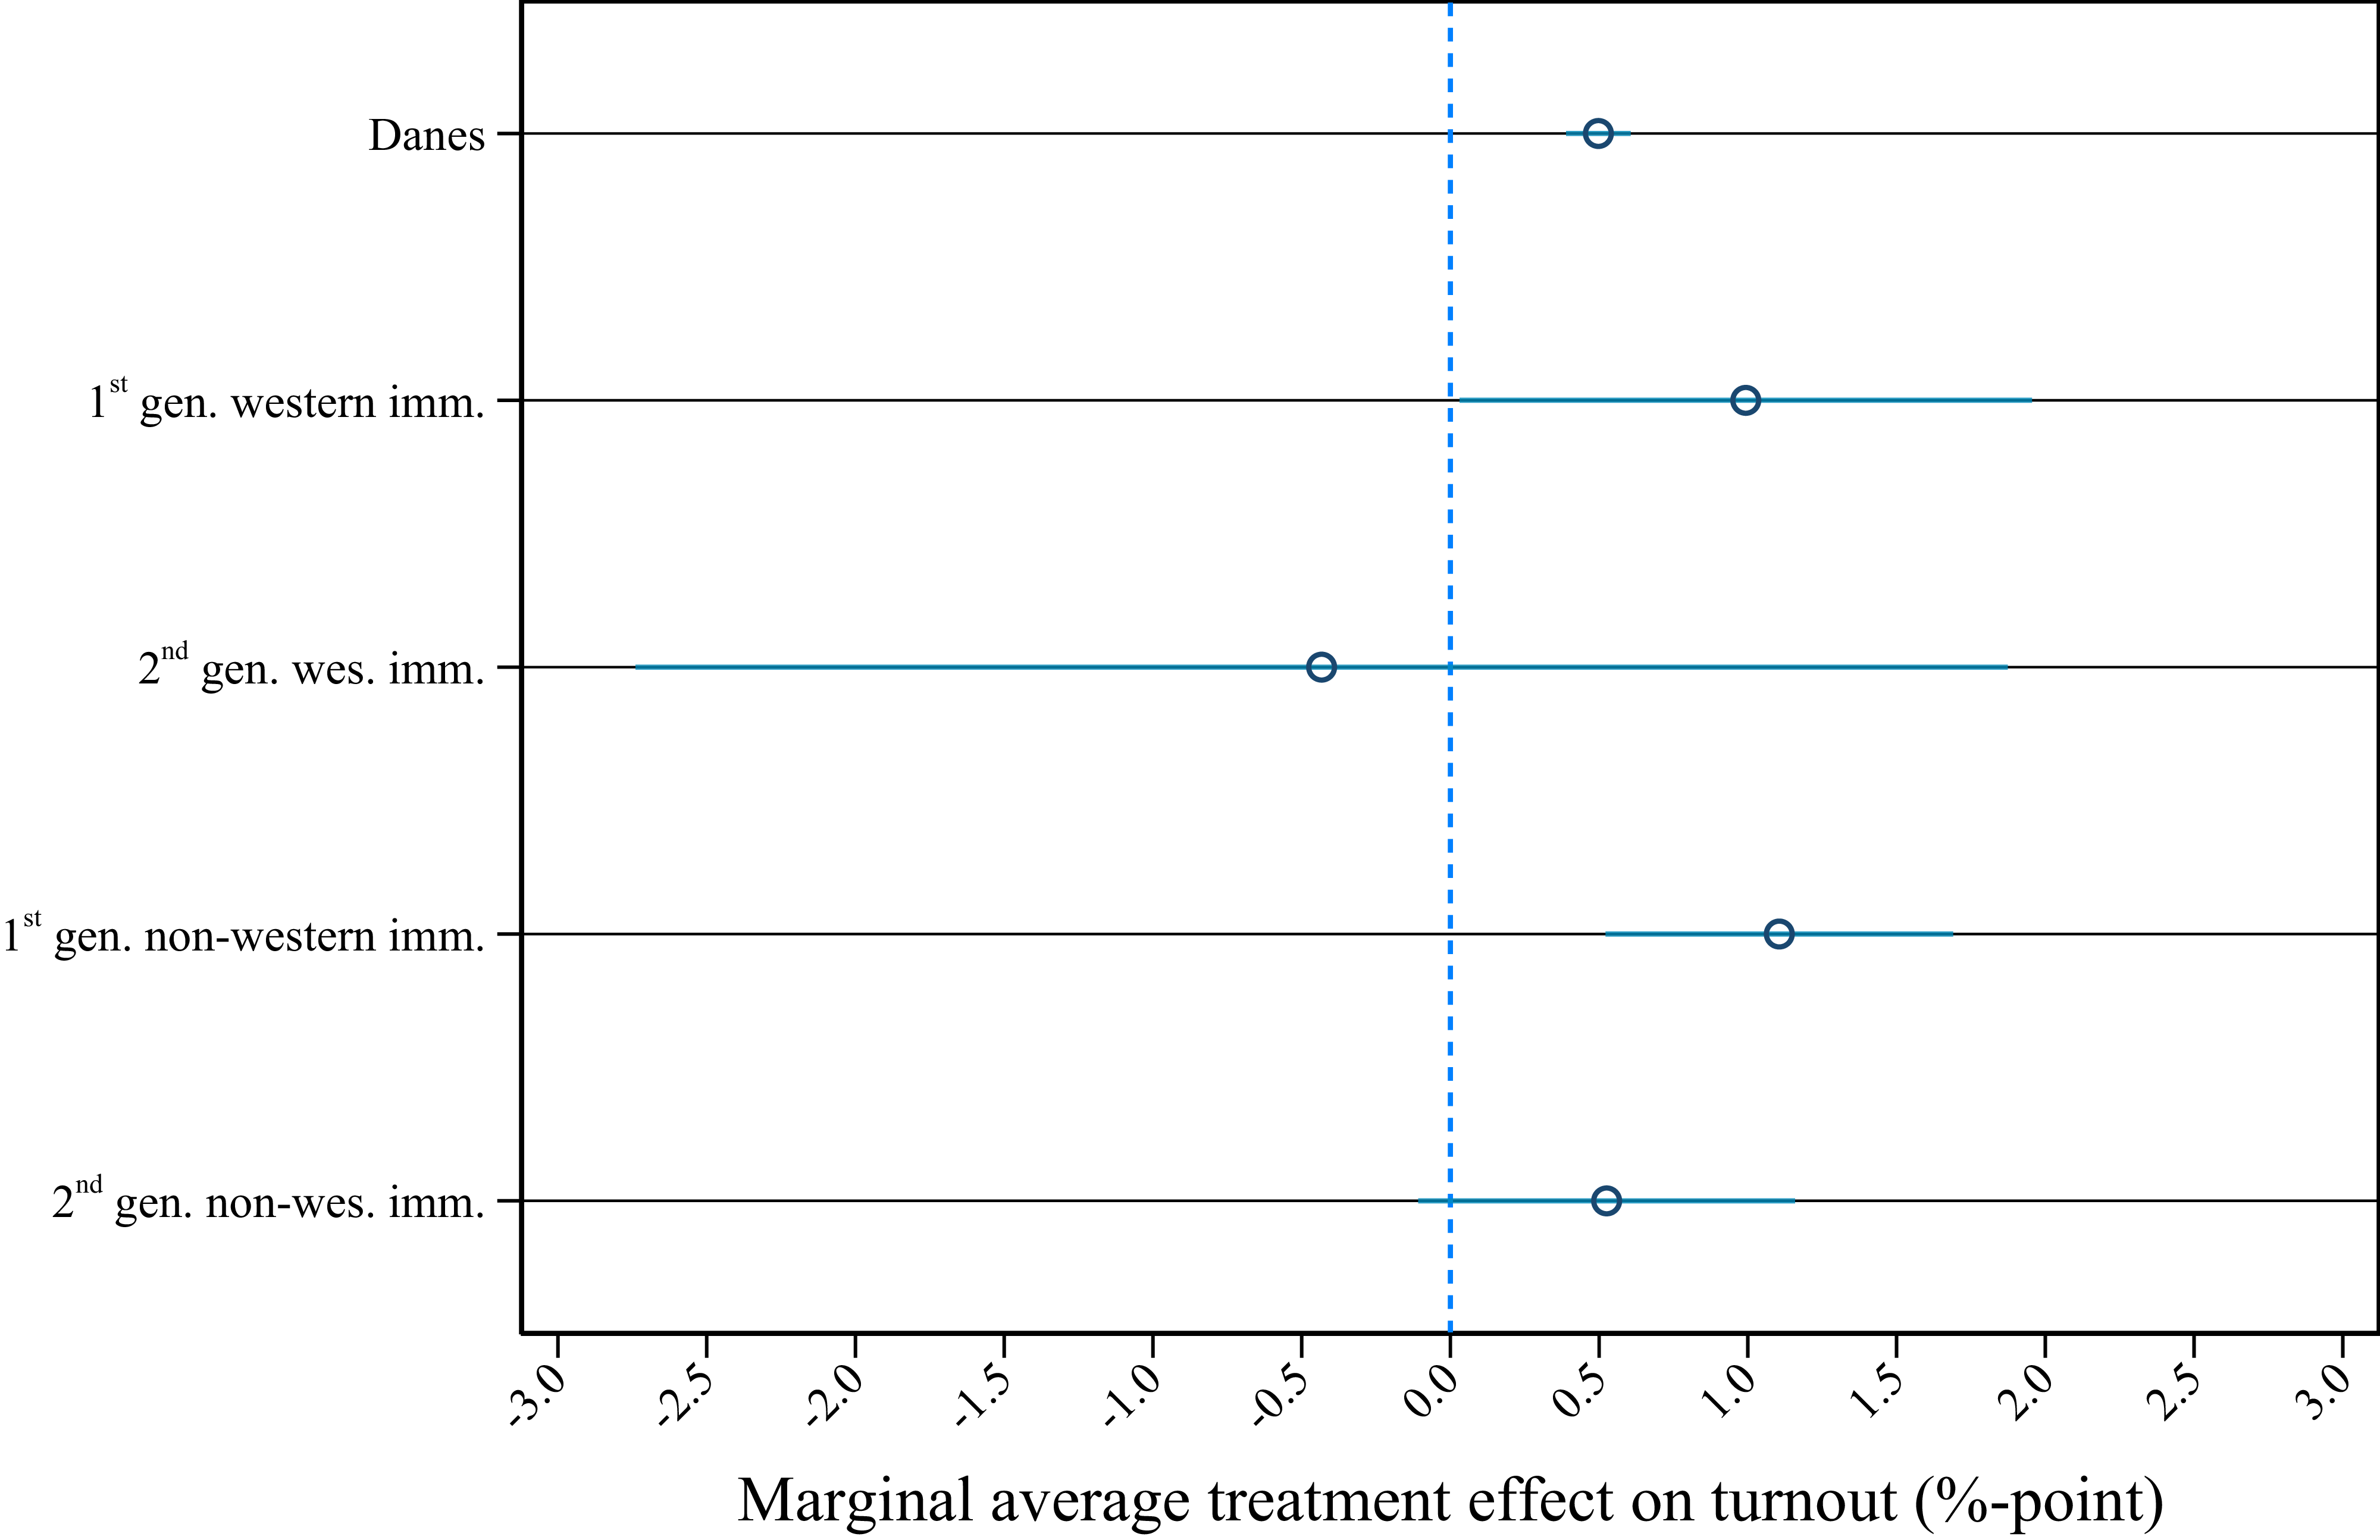
We can also open up the box of immigrants. Figure 6 presents the treatment effect not only for immigrants but also for first-and second-generation immigrants and groups by country of origin.
Treatment effect on turnout over immigrant status.
Note: The marginal predicted probabilities CI 90% are based on a logistic regression analysis with turnout in the European election as the dependent variable with standard error clustered at household. The independent variables are treatment and the five categories of origin. Normalized inverse probability weights were applied; see Table 2. Total n = 3,151,864. See the online supporting information Tables S6 and S7 for descriptives for the five groups.

The Danish citizens whose parents were born in Denmark experience the general overall positive effect of the experiment of about 0.5 percentage points on their turnout, as they dominate the population by far. What is more surprising is the statistically significant effect of about 1 percentage point among first-generation immigrants, both Western and non-Western, and the lack of a statistically significant effect among second-generation immigrants, regardless of origin. The absence of an effect for second-generation immigrants can partly be explained by observable characteristics. Tables S6 and S7 in the online supporting information show that, on average, second-generation immigrants have lower levels of education and income, are younger, and are less likely to be married compared to first-generation immigrants. Relative to first-generation immigrants, this subgroup can therefore be argued to have a lower propensity to vote. In line with Figure 4, second-generation immigrants are thus less likely to be mobilized. The treatment did not influence turnout among second-generation immigrants – a pattern that may have been concealed in previous mobilization experiments, which often treat first-and second-generation immigrants as a single category. This finding indicates that future mobilization interventions should be more specifically targeted, with particular attention to how second-generation immigrants can be effectively mobilized.
Discussion
This paper demonstrates that digital messages are a powerful and effective tool for increasing voter turnout. Across both our randomized controlled field experiment and the broader meta-analysis, we find consistent evidence that digital mobilization can positively influence electoral participation, even in contexts with already high turnout rates. These findings are encouraging, since digital messaging is a low-cost and easily implementable intervention that can be scaled to the full population across diverse electoral contexts. Its simplicity and efficiency make digital messages particularly well-suited for governments and organizations seeking to enhance democratic participation without requiring extensive resources.
Importantly, our results show that digital messages do more than just increase overall turnout – they also contribute to reducing general inequalities in electoral participation. Both our experiment and the meta-analysis reveal that voters with immigrant backgrounds, a group traditionally underrepresented at the ballot box, respond particularly well to digital mobilization efforts. The meta-analysis estimates an average effect of 1.5 percentage points for immigrant voters, while our experiment finds a slightly smaller but still significant effect of 0.78 percentage points for immigrants. Zooming in on different subgroups of immigrants, it turns out that especially first-generation immigrants are responsive to our treatment, whereas the second-generation is not affected. This suggests that future interventions should focus the treatment on this group’s particular concerns. In both the meta-analysis and our experiment, digital messages increased voter turnout among immigrants at a higher rate than among the general electorate, and these results thus underscore the inclusive potential of digital messaging in strengthening democratic representation.
Another marginalized group is young voters. Both the meta-analysis and the experiment suggest that it is possible to significantly increase voter turnout for this group by sending digital mobilization messages. The meta-analysis shows that digital messages increase voter turnout for young voters at a higher rate than among the general electorate, while our experiment reveals that the very young and very old voters are the least mobilized by digital messages. Our experiment thus suggests that the effect of digital messaging on the very young and very old voters might be more context-sensitive and potentially influenced by message content or delivery conditions. The discrepancy between the meta-analysis and the experiment regarding whether young voters are more or less likely to be mobilized by digital messages, compared to the general electorate, could potentially be explained by the fact that young voters were more responsive to digital messages ten years ago. Due to the explosive number of notifications young voters receive on their cell phones – from social media, news platforms, dating apps, and other sources – mobilization messages risk being crowded out. The constant stream of digital stimuli reduces the visibility and impact of GOTV messages, making it increasingly difficult to capture attention in an already saturated communication environment. Today, digital mobilization messages may be perceived as less novel, and young people receive a large amount of digital communication on their phones, making the intervention less impactful today compared to ten years earlier – bringing the effect closer to the one estimated for the general electorate. This highlights the need for further research into how future generations of digital interventions can be tailored and optimized to better capture attention and engage especially younger demographics.
Taken together, these findings emphasize that digital messaging is not only effective in increasing turnout but also has the potential to reduce turnout gaps between different voter groups – particularly between first-generation immigrant voters and the general electorate. This makes digital mobilization a promising tool for promoting democratic inclusion.
Given that all studies in the meta-analysis, as well as our own experiment, were conducted in Denmark, Norway, Sweden, and Finland, we consider these to be critical cases. The high baseline turnout in these countries suggests that the observed effects may represent a lower bound, and that even greater impacts could be expected in countries with lower levels of electoral participation. Compared to effect sizes found in the United States for all voters, we observe – as expected – a smaller impact of digital messaging on voter mobilization in low-salience elections in Europe, likely due to higher baseline participation rates. In contrast, European voters appear more responsive in high-salience elections than their American counterparts. While there are observable differences in the estimated effects of digital mobilization interventions across the two contexts, these differences may not reach statistical significance and should therefore be interpreted with caution.
In addition to electoral participation, variation in the volume of digital communication from public authorities may shape the likelihood that voters react to the intervention. In countries where it is common for public authorities to communicate with citizens via digital messaging, the mobilizing effect of a digital message encouraging voter participation is expected to be smaller. This is likely due to the normalization of such communication, which may reduce the salience and perceived urgency of the message. In contrast, in societies where digital outreach from public institutions is less frequent, such messages may stand out more and therefore have a greater impact on voter mobilization. As such, the level of digitalization in a given context could influence the anticipated effect size.
Beyond immediate turnout effects, digital messaging may also yield indirect and longer-term benefits. Prior research has documented spillover effects within households, where individuals not directly targeted by the intervention nonetheless increase their likelihood of voting. These spillover effects can amplify the overall impact by 30–50% (Bhatti, Dahlgaard, Hedegaard et al. Reference Bhatti, Dahlgaard, Hedegaard and Hansen2017b; Lindgren, Nyman and Oskarsson Reference Lindgren, Nyman and Oskarsson2025), although similar effects have not been observed in workplace settings, suggesting that the potential for spillover is context-dependent (Lindgren, Nyman and Oskarsson Reference Lindgren, Nyman and Oskarsson2025). Additionally, digital messaging has been shown to produce positive turnout effects in subsequent elections of the same type, highlighting its potential long-term benefits for democratic engagement. These findings are important to consider, as they suggest that the overall impact of digital messaging may be more cost-effective than initially estimated. Thus, digital messaging can play a role in sustaining and potentially strengthening democratic participation in Europe.
Supplementary material
The supplementary material for this article can be found at https://doi.org/10.1017/S1475676526101911
Data availability statement
Data and code for the meta-analysis are available at Harvard Dataverse https://doi.org/10.7910/DVN/49NEDC. The register data for our experiment were stored on servers in Statistics Denmark. Owing to the security and privacy implications, data cannot be made publicly available.
Acknowledgements
Thanks for the comments at our presentations at the November 2024 Danish Political Science Annual Meeting (DPSA), The European Affairs Committee of the Danish Parliament (Folketing, January 2025), and The European Parliament’s office in Copenhagen (January 2025).
Funding statement
Improving democracy – Causal Effects on Turnout (I-DET) financed by Trygfonden (no. 159726), The Danish Parliament, and Department of Political Science, University of Copenhagen.
Competing interests
We declare no conflicting interests.
Ethical standards
The experiments have received ethical approval from the Department of Political Science’s Ethics Committee (7 May 2024, ref. 2024-002). In addition, the project has been approved by the Faculty of Social Sciences at the University of Copenhagen (case no. 514-0053/18-2000). All analyses were conducted on Statistics Denmark’s secure research server, where the data are anonymized and subject to Statistics Denmark’s requirements for the use of microdata. The experiments and the analyses are preregistered at OSF; see Hansen (Reference Hansen2024).
Use of AI
No use of AI.






 Open access

