


1 Introduction
Nonresponse is an important threat to the validity of household surveys and political polls. In many surveys, the target population consists of two groups: respondents and nonrespondents. Nonrespondents are people who do not answer some or all of the items on the survey questionnaire. Since data on nonrespondents is unavailable, the analysis of survey data often focuses on the sample of respondents. The threat to validity is that respondents and nonrespondents may have systematically different answers to the survey questions. In that case, the sample of respondents would not be representative of the target population of interest. It is fundamentally difficult to learn much about whether a respondent sample suffers from this kind of nonresponse bias because the nonrespondents did not fill out the questionnaire. By definition, their answers to the survey questions are unknown.
Nonresponse has always been an important conceptual concern. But survey response rates have been falling for decades and the threat to validity is now quite large (Steeh Reference Steeh1981; De Leeuw and De Heer Reference De Leeuw, De Heer and Groves2002; Meyer, Mok, and Sullivan Reference Meyer, Mok and Sullivan2015). Many private telephone polls now have response rates below 10% (Kohut et al. Reference Kohut, Keeter, Doherty, Dimock and Leah1997), and response rates in major government surveys are only around 75–85% (Czajka and Beyler Reference Czajka and Beyler2016). As a result, survey researchers and policy makers often try to design surveys and implement policies that promote high response rates. But the focus on response rates can be misleading. Response rates may vary over time and across surveys because of social norms, economic conditions, technological change, public policy, and the design and implementation of the survey itself (Groves, Singer, and Corning Reference Groves, Singer and Corning2000; Groves and Peytcheva Reference Groves and Peytcheva2008; Dillman, Smyth, and Christian Reference Dillman, Smyth and Christian2014; Brehm Reference Brehm1993). However, most of the manipulable factors that can be used to affect response rates are not powerful enough to eliminate nonresponse entirely. When response rates increase by a few percentage points, new people are pulled into the sample of respondents. But who are the new respondents? Do they provide systematically different answers to the survey questions?
In this paper, I study the way exogenous increases in survey response rates can affect the composition of a sample of survey respondents. In this context, an exogenous increase in response rates is one that arises because of a variable that induces some people to participate in the survey, but that is not itself correlated with the outcomes the survey is designed to measure. To date, the literature on survey nonresponse does not include a set of statistical tools that can be used to investigate the characteristics of the people who are brought into a survey sample because of an exogenous factor or event, such as a variation in a survey design element or change in public policy.
I develop an instrumental variables method to fill this gap in the literature. The paper makes three main contributions. First, it uses potential outcomes notation to connect questions about survey outcomes with a design-based causal model of survey participation. Second, it introduces a simple data transformation and an instrumental variable estimator that can be applied to data with missing survey responses. It shows that, under four assumptions, the estimator identifies a new parameter called the Complier Average Survey Response (CASR). The CASR is not a treatment effect. It is a summary statistic measuring the average survey responses provided by those who join the respondent sample because of an exogenous increase in response rates. The CASR provides a coherent way of describing the group of people who were induced to participate in the survey because of a particular variable. Third, the paper shows how researchers can use estimates of the CASR to test the null hypothesis that a response rate intervention does not alter the composition of the sample. Researchers can use these statistical tests to partially validate conventional corrections for survey nonresponse bias, such as weighting or imputation methods.
I apply the methods to data from a survey experiment conducted during the 2011 Swiss Electoral Study (SES) (Lipps and Pekari Reference Lipps and Pekari2016). In the SES, prior to initial contact, members of the sample were randomly assigned to either a control group or a treatment group that received a small cash incentive to participate in the survey. The results of the instrumental variable analysis suggest that the cash incentive induced participation among people with more nationalist political views. I constructed nonresponse weights using a propensity score method, and then used the instrumental variable analysis to test the validity of the nonresponse weights. The monetary incentives remain bias altering in the weighted data, suggesting that the nonresponse bias in the original sample is not fully explained by observed covariates.
2 Related Research
The design and analysis of surveys and opinion polls plays a key role in political science research, and nonresponse is an important source of uncertainty for quantitative political scientists (Brehm Reference Brehm1993). In recent work, for example, Ansolabehere and Hersh (Reference Ansolabehere and Hersh2012) study why postelection public opinion surveys tend to overestimate election turnout. They use voter registration data to validate surveys and find that both survey sample composition and misreporting explain the overestimates. In another example, Gelman et al. (Reference Gelman, Goel, Rivers and Rothschild2016) study how measures of voter support for a candidate changes over an election campaign. The conventional interpretation is that some people are swing voters who respond to campaign events. Gelman et al. (Reference Gelman, Goel, Rivers and Rothschild2016) find that most of the pattern comes from month-to-month changes in polling response rates, which alter the composition of the respondent sample. Political scientists are also relying more heavily on randomized survey experiments (Sniderman, Brody, and Tetlock Reference Sniderman, Brody and Tetlock1993; Lacy Reference Lacy2001). The trade off between internal and external validity is a key issue in survey experiments, and it is closely connected with problems of survey nonresponse (Gaines, Kuklinski, and Quirk Reference Gaines, Kuklinski and Quirk2006; Mishra et al. Reference Mishra, Barrere, Hong and Khan2008; Sniderman Reference Sniderman and Druckman2011).
From a statistical perspective, the problems created by survey nonresponse are a special case of the more general problem of missing data. Typically, missing data problems revolve around an outcome variable of interest, a binary participation (or missingness) variable, and additional covariates. There are four broad approaches to missing data analysis: complete case analysis, weighting based on covariates or auxiliary information, missing data imputation, and statistical models of sample selection. The methods rely on distinct assumptions about the connection between participation and outcomes.
Complete case analysis is valid under the assumption that the data are missing completely at random (MCAR) (Rubin Reference Rubin1976; Little Reference Little1988). When the data are MCAR, the participants are a random sample from the target population and excluding the missing data from analysis will not lead to bias. In contrast, methods that use covariates or other information to form weights or to impute missing data assume that the outcome data are missing at random conditional on covariates (MAR) (Kalton and Kasprzyk Reference Kalton and Kasprzyk1986; Little Reference Little1993; Little and Rubin Reference Little and Rubin2014). Under the MAR assumption, both participation rates and the average value of the outcome variable may vary across sub-populations defined by covariates. However, within those sub-populations the participation and outcome variables must be statistically independent. When the MAR assumption is valid, researchers can use matching, weighting, or imputation to correct for the missing data bias.
Methods based on MAR are not valid if participation decisions depend on unmeasured covariates that are associated with how the person would have answered the survey. In these situations, researchers often turn to sample selection models (Heckman Reference Heckman1974, Reference Heckman1979; Achen Reference Achen1986; Brehm Reference Brehm1993). To make good use of a sample selection model, researchers must be able to correctly specify and estimate statistical models of both participation and the outcome of interest, and they must have access to an instrumental variable that appears only in the participation equation (Little Reference Little1982, Reference Little1988). In applied work, sample selection models work best when researchers have a compelling theoretical model of the behavior guiding participation and outcomes. For example, Heckman (Reference Heckman1974) develops a selection model in the context of a study of female labor market outcomes. In this case, the participation equation is essentially a model of female employment; the outcome equation is a model of wages and hours worked. In contrast, social scientists often lack a detailed theoretical model of the joint relationship between survey participation and the ways in which people will likely answer a disparate collection of survey questions.
The literature on survey methodology does not make much use of instrumental variables. Instead, the literature relies on research design to understand the determinants of survey participation (Brehm Reference Brehm1993; Groves et al. Reference Groves, Fowler, Couper, Lepkowski, Singer and Tourangeau2011; Dillman, Smyth, and Christian Reference Dillman, Smyth and Christian2014). For example, a large literature uses randomized experimental designs to test the effects of survey design elements on survey participation rates (Brehm Reference Brehm1994; Davern et al. Reference Davern, Rockwood, Sherrod and Campbell2003; Doody et al. Reference Doody, Sigurdson, Kampa, Chimes, Alexander, Ron, Tarone and Linet2003; Groves et al. Reference Groves, Couper, Presser, Singer, Tourangeau, Acosta and Nelson2006; Singer and Ye Reference Singer and Ye2013; Lipps and Pekari Reference Lipps and Pekari2016). These studies generally do not examine the way that induced changes in response rates alter the composition of the respondent sample.
The recent literature on causal inference emphasizes a design-based instrumental variables framework (Imbens and Angrist Reference Imbens and Angrist1994; Angrist, Imbens, and Rubin Reference Angrist, Imbens and Rubin1996). Sample selection models can also be used to model causal effects in ways that are very similar to the design-based instrumental variables framework (Maddala Reference Maddala1983; Heckman and Navarro-Lozano Reference Heckman and Navarro-Lozano2004). However, the design-based approach to instrumental variables has gained popularity because it allows researchers to justify assumptions using arguments about research design rather than explicit theoretical models of choice and behavior. Although the design-based approach now plays a key role in empirical studies of the causal effects, it has not played an important role in the analysis of missing data. Researchers studying missing data continue to work mostly with either the MAR framework or with sample selection models. The method developed in this paper is an effort to apply a design-based instrumental variables analysis to the problem of missing survey data.
3 Instrumental Variables Framework
3.1 Notation
Suppose that researchers are conducting a survey by drawing a random sample of people from a well-defined sampling frame. Use
 $i=1\ldots N$
to index the members of the survey sample. The set of
 $N$
members of the survey sample includes everyone who was randomly selected from the frame, regardless of whether they actually ended up responding to the survey. Let
 $X_{i}$
represent a vector of covariates that were recorded on the sampling frame.
 $Z_{i}$
is a binary instrumental variable, and
 $D_{i}$
is a binary survey participation variable. Specifically,
 $D_{i}=1$
if the person participates in the survey in the sense that they are contacted and eventually answer the questions on the survey questionnaire.
 $D_{i}=0$
if the person does not participate.
All of the variables defined so far are measured for each member of the survey sample. The frame is used to populate
 $X_{i}$
. In an experimental setting, values of
 $Z_{i}$
are randomly assigned by the researcher. In other settings, values of the instrument might arise from quasi-experimental variation in survey technologies, costs, legal constraints, or other factors. Finally, values of
 $D_{i}$
are revealed when researchers attempt to obtain a questionnaire from each member of the study sample.
Although
 $X_{i},Z_{i}$
, and
 $D_{i}$
are measured for each member of the survey sample, the outcomes measured by the survey questionnaire will be missing for survey nonrespondents. Suppose that
 $H_{i}$
is the person’s response to an item on the survey questionnaire. For instance,
 $H_{i}$
might be the person’s answer to a question about whether she voted in the previous election. In principle, the value of
 $H_{i}$
is defined for every person in the survey sample. But unlike the values of
 $X_{i},Z_{i}$
, and
 $D_{i}$
, individual values of
 $H_{i}$
are only recorded for people who actually participate in the survey. That means that the value of
 $H_{i}$
is measured for people with
 $D_{i}=1$
and unmeasured—missing—for people with
 $D_{i}=0$
. If the average value of
 $H_{i}$
is different among respondents and nonrespondents, simple objects like the sample mean of
 $H_{i}$
in the respondent data will provide a biased estimate of the population mean of
 $H_{i}$
.
3.2 Potential Outcomes
The instrument is a variable that causes some people to participate in the survey who would otherwise not participate. To make the causal link between the instrument and participation clear, let
 $D(1)_{i}$
and
 $D(0)_{i}$
represent the outcomes of a person’s survey participation decision under the two alternative values of the instrument.
 $D(1)_{i}$
indicates whether the person would participate in the survey if her value of the instrument was set to
 $Z_{i}=1$
. In contrast,
 $D(0)_{i}$
represents the same person’s participation if her instrument was set to
 $Z_{i}=0$
. A person’s realized survey participation outcome is
 $D_{i}=D(0)_{i}(1-Z_{i})+D(1)_{i}Z_{i}$
. For example, if a person has
 $Z_{i}=1$
then her value for
 $D(1)_{i}$
is observable, but her value for
 $D(0)_{i}$
is unknown.
Using the notation defined so far,
 $D(1)_{i}-D(0)_{i}$
represents the person-level causal effect of the instrument on participation decisions. Individuals may respond in different ways to the instrument. Angrist, Imbens, and Rubin (Reference Angrist, Imbens and Rubin1996) introduced compliance-type terminology to describe the sub-populations of people who respond in specific ways to a binary instrument in the context of a binary treatment condition. It is straightforward to adapt the same terminology to the problem of survey participation. For example, one possible sub-population consists of people who participate in the survey regardless of their exposure to the instrument. People in this group have
 $D(1)_{i}=D(0)_{i}=1$
, and they are called Always Takers. In contrast, people who refuse to participate in the survey regardless of their exposure to the instrument are called Never Takers. They have
 $D(1)_{i}=D(0)_{i}=0$
. Compliers are people with
 $D(1)_{i}-D(0)_{i}=1$
. Compliers are the people who are pulled into the survey because of the instrumental variable. Finally, Defiers have
 $D(1)_{i}-D(0)_{i}=-1$
. Defiers act in opposition to the instrument, which is supposed to encourage participation. The compliance-type labels are instrumental variable specific. Someone who is complier when the instrument is a cash incentive may be a never taker when the instrument involves interviewer training, for example.
The participation potential outcomes are concerned with the way in which a person’s survey participation depends on the instrumental variable. But what about the person’s responses to the items on the survey questionnaire? Let
 $H(z,d)_{i}$
define a set of potential survey responses that a person would provide under alternative values of the instrumental variable and the participation variable. This means that each person is described by four different potential outcomes for the survey response. For example,
 $H(1,1)_{i}$
represents the person’s response to the survey question under a hypothetical scenario where
 $Z_{i}=1$
and
 $D_{i}=1$
. Only one of the four potential outcomes is actually realized for any individual. A person’s realized outcome depends on her realized values of the instrument and participation variables. Formally, the idea is that a person’s realized
 $H_{i}=H(Z_{i},D(Z_{i})_{i})$
. However, values of
 $H_{i}=H(Z_{i},D(Z_{i})_{i})$
are unknown (missing) for people with
 $D(Z_{i})_{i}=0$
because such people do not participate in the survey questionnaire and answer the questions related to
 $H_{i}$
.
3.3 Instrumental Variables Analysis
This paper’s main technical claim is that a binary instrumental variable identifies the average survey responses among compliers. The result depends on four assumptions and a variable transformation.
Assumption i (Independence).
The instrumental variable is as good as randomly assigned with respect to the potential treatments and outcomes. Formally, this is a statistical independence condition implying that
 $Z_{i}\bot \!\!\!\bot (D(z)_{i},H(z,d)_{i})$
.
Assumption ii (Exclusion).
Neither the instrument nor the participation variable exerts a causal effect on the outcome variable.Footnote
1
Under the exclusion restriction, the potential survey outcomes simplify from a collection of four potential outcomes to a scalar:
 $H(z,d)_{i}=H_{i}$
.
Assumption iii (First Stage).
The instrument affects participation for some members of the study population so that
 $Pr(D(1)_{i}-D(0)_{i}=1)>0$
.
Assumption iv (Monotonicity).
The instrument affects participation (weakly) in the same direction for each person, implying that either
 $D(1)_{i}\geqslant D(0)_{i}$
for all
 $i$
or
 $D(1)_{i}\leqslant D(0)_{i}$
for all
 $i$
.
Define a transformed outcome variable
 $R_{i}=D_{i}H_{i}$
. Unlike
 $H_{i}$
, the transformed variable is never missing because:
 $$\begin{eqnarray}\displaystyle R_{i}=\left\{\begin{array}{@{}ll@{}}0,\quad & \text{if }D_{i}=0,\\ H_{i},\quad & \text{if }D_{i}=1.\end{array}\right. & & \displaystyle\end{eqnarray}$$
After the transformation, values of
 $(Z_{i},D_{i},R_{i})$
are observed for each member of the sample. Under assumptions i–iv the simple Wald Ratio with transformed outcomes in the numerator and participation rates in the denominator identifies a parameter called the Complier Average Survey Response (CASR):
 $$\begin{eqnarray}\displaystyle \frac{E[R_{i}|Z_{i}=1]-E[R_{i}|Z_{i}=0]}{E[D_{i}|Z_{i}=1]-E[D_{i}|Z_{i}=0]}=E[H_{i}|D(1)_{i}-D(0)_{i}=1]=CASR(H_{i},Z_{i}). & & \displaystyle\end{eqnarray}$$
I present the derivation of this result in three steps. First, I analyze the numerator of the expression, which is analogous to the Intent to Treat (ITT) component of an IV analysis of causal treatment effects. Second, I examine the denominator of the ratio, which is often called the first stage of an IV analysis. Finally, I combine the ITT and first-stage results.
3.3.1 Intent To Treat
In randomized experiments, the numerator of the Wald Ratio is called the Intent To Treat effect (ITT). In the nonresponse setting, let
 $ITT=E[R_{i}|Z_{i}=1]-E[R_{i}|Z_{i}=0]$
. Rewrite the
 $ITT$
in terms of the underlying potential outcomes, noting that the exclusion restriction implies that
 $H(z,d)_{i}=H_{i}$
and that
 $R_{i}=D_{i}H_{i}$
by construction.
 $$\begin{eqnarray}\displaystyle ITT & = & \displaystyle E[(D(0)_{i}(1-Z_{i})+D(1)_{i}Z_{i})H_{i}|Z_{i}=1]\nonumber\\ \displaystyle & & \displaystyle -\,E[(D(0)_{i}(1-Z_{i})+D(1)_{i}Z_{i})H_{i}|Z_{i}=0].\end{eqnarray}$$
The values of
 $(1-Z_{i})$
and
 $Z_{i}$
are determined by conditioning, so the equation simplifies:
 $$\begin{eqnarray}\displaystyle ITT=E[D(1)_{i}H_{i}|Z_{i}=1]-E[D(0)_{i}H_{i}|Z_{i}=0]. & & \displaystyle\end{eqnarray}$$
Under the independence assumption,
 $E[D(z)_{i}H_{i}|Z_{i}]=E[D(z)_{i}Hi]$
. Dropping the conditioning on
 $Z_{i}$
gives:
 $$\begin{eqnarray}\displaystyle ITT=E[(D(1)_{i}-D(0)_{i})H_{i}]. & & \displaystyle\end{eqnarray}$$
Decompose the right-hand side to obtain:
 $$\begin{eqnarray}\displaystyle ITT & = & \displaystyle 1\times E[H_{i}|D(1)_{i}-D(0)_{i}=1]Pr(D(1)_{i}-D(0)_{i}=1)\nonumber\\ \displaystyle & & \displaystyle +\,0\times E[H_{i}|D(1)_{i}-D(0)_{i}=0]Pr(D(1)_{i}-D(0)_{i}=0)\nonumber\\ \displaystyle & & \displaystyle -\,1\times E[H_{i}|D(1)_{i}-D(0)_{i}=-1]Pr(D(1)_{i}-D(0)_{i}=-1).\end{eqnarray}$$
The second term is multiplied by zero, and the third term cancels under the monotonicity assumption. That leaves:
 $$\begin{eqnarray}\displaystyle ITT=E[H_{i}|D(1)_{i}-D(0)_{i}=1]Pr(D(1)_{i}-D(0)_{i}=1). & & \displaystyle\end{eqnarray}$$
In the missing data setting, the numerator of the Wald Ratio based on the transformed outcome is essentially an estimate of the average survey response among the Compliers that is biased toward zero.
3.3.2 First Stage
Let
 $F=E[D_{i}|Z_{i}=1]-E[D_{i}|Z_{i}=0]$
be the denominator of Wald Ratio, which is called the first-stage effect of the instrument. Write first stage in terms of potential outcomes and use the conditioning on
 $Z_{i}$
to simplify:
 $$\begin{eqnarray}\displaystyle F=E[D(1)_{i}|Z_{i}=1]-E[D(0)_{i}|Z_{i}=0]. & & \displaystyle\end{eqnarray}$$
Use the independence assumption to drop the conditioning on
 $Z_{i}$
. Then decompose the distribution of the first-stage effects.
 $$\begin{eqnarray}\displaystyle F & = & \displaystyle 1\times Pr[D(1)_{i}-D(0)_{i}=1]\nonumber\\ \displaystyle & & \displaystyle +\,0\times Pr[D(1)_{i}-D(0)_{i}=0]\nonumber\\ \displaystyle & & \displaystyle -\,1\times Pr[D(1)_{i}-D(0)_{i}=-1].\end{eqnarray}$$
The second term is zero. The third term cancels under the monotonicity assumption.
 $$\begin{eqnarray}\displaystyle F=Pr[D(1)_{i}-D(0)_{i}=1]. & & \displaystyle\end{eqnarray}$$
The first stage identifies the fraction of people who are induced to participate in the survey because of the instrument.
3.3.3 Complier Average Survey Responses
Combining the intent to treat and first-stage results gives:
 $$\begin{eqnarray}\displaystyle \frac{ITT}{F}=\frac{E[H_{i}|D(1)_{i}-D(0)_{i}=1]Pr(D(1)_{i}-D(0)_{i}=1)}{Pr[D(1)_{i}-D(0)_{i}=1]}. & & \displaystyle\end{eqnarray}$$
The denominator and the second term in the numerator cancel, showing that the Wald Ratio identifies the average value of the untransformed survey response variable among the sub-population of Compliers. This is a new parameter called the Complier Average Survey Response (CASR).
 $$\begin{eqnarray}\displaystyle \frac{ITT}{F}=CASR=E[H_{i}|D(1)_{i}-D(0)_{i}=1]. & & \displaystyle\end{eqnarray}$$
The derivation is very similar to the potential-outcomes-based instrumental variables analysis presented in Imbens and Angrist (Reference Imbens and Angrist1994) and Angrist, Imbens, and Rubin (Reference Angrist, Imbens and Rubin1996). Those papers show that in randomized experiments where some people do not comply with their assigned treatments, the population estimand of the IV estimator is a treatment effect that is sometimes called the Complier Average Treatment Effect (CATE) or the Local Average Treatment Effect (LATE). In contrast, the analysis presented in this paper shows that the population estimand of the IV estimator applied to the transformed survey response variable is the CASR parameter.
3.3.4 Estimation Using Two Stage Least Squares
The Wald Ratio estimator is equivalent to a just identified Two Stage Least Squares (TSLS) regression, which is easy to implement in existing software packages and makes a convenient platform for statistical inference (Angrist and Pischke Reference Angrist and Pischke2009; Morgan and Winship Reference Morgan and Winship2014). In the TSLS framework, the first-stage regression is
 $D_{i}=\unicode[STIX]{x1D6FF}_{0}+\unicode[STIX]{x1D6FF}_{1}Z_{i}+v_{i}$
. The outcome equation is
 $R_{i}=\unicode[STIX]{x1D6FD}_{0}+\unicode[STIX]{x1D6FD}_{1}\hat{D_{i}}+e_{i}$
, where
 $\hat{D_{i}}$
is the predicted value from the first-stage regression. Fitting a second-stage model using TSLS gives
 $\unicode[STIX]{x1D6FD}_{1}=\frac{ITT}{F}=E[H_{i}|D(1)_{i}-D(0)_{i}=1]$
.
3.4 Tests of Bias Neutrality
The derivation above showed that a simple IV estimator applied to the transformed survey response variable identifies the CASR. A natural question is what to do with an estimate of the CASR. One answer is to compare it with the average survey outcome among people who would have participated in the survey even in the absence of the intervention. Using the IV terminology outlined earlier, this amounts to a comparison of average outcomes among Compliers and Always Takers.
If Compliers and Always Takers tend to give the same answers to a survey question, then the instrument does not alter the composition of the sample with respect to that survey question. Such an instrument might be called bias neutral or composition neutral. A statistical test of bias neutrality evaluates the null hypothesis that Compliers and Always Takers provide the same survey responses on average. Rejecting the null hypothesis that
 $E[H_{i}|D(1)_{i}=D(0)_{i}=1]=E[H_{i}|D(1)_{i}-D(0)_{i}=1]$
suggests that the instrument is bias altering in the sense that it pulls in new respondents who give systematically different answers than the original respondents.
To implement the test, researchers need to form an estimate of the Always Taker Average Survey Response (ATASR), which is
 $E[H_{i}|D(1)_{i}=D(0)_{i}=1]$
. Under the independence and monotonicity assumption, Always Takers are the only people who participate in the survey among people with
 $Z_{i}=0$
. A natural estimator of the ATSR is simply the average survey response among people with
 $D_{i}=1$
and
 $Z_{i}=0$
. Under the null hypothesis that the survey design intervention is bias neutral, you would expect that
 $CASR-ATASR=0$
. Rejecting the null of bias neutrality implies that the survey design is bias altering. In principle, the test provides information about whether the instrument affects the representativeness of the survey. However, absent additional information, the test does not reveal whether the survey design intervention reduces nonresponse bias or makes it worse.
A statistical wrinkle is that some members of the survey sample contribute to estimates of both the CASR and the ATASR. One way to account for the dependence between the two estimates is to construct two data sets, stack them, and then jointly estimate the ATASR and CASR. The first data set is the full sample of
 $N$
observations. The second data set is the subset of Always Takers (AT) from the full sample. This means there are
 $N$
observations in the full sample and
 $N_{AT}=\sum _{i=1}^{N}D_{i}(1-Z_{i})$
observations in the Always Taker Sample. In the full sample, let
 $\mathbf{R}_{\mathbf{N}}$
,
 $\mathbf{D}_{\mathbf{N}}$
, and
 $\mathbf{Z}_{\mathbf{N}}$
be
 $N$
vectors containing the transformed outcome, participation outcome, and instrumental variable for each person.
 $\mathbf{1}_{\mathbf{N}}$
and
 $\mathbf{0}_{\mathbf{N}}$
are
 $N$
vectors of ones and zeros. In the AT sample,
 $\mathbf{H}_{\mathbf{AT}}$
is the vector of observed outcomes and
 $\mathbf{1}_{\mathbf{AT}}$
and
 $\mathbf{0}_{\mathbf{AT}}$
are the corresponding
 $N_{AT}$
vectors of ones and zeros. Stack the two data sets to form:
 $$\begin{eqnarray}\displaystyle Y=\left[\begin{array}{@{}c@{}}H_{AT}\\ R_{N}\end{array}\right]\quad X=\left[\begin{array}{@{}ccc@{}}1_{AT} & 0_{AT} & 0_{AT}\\ 0_{N} & 1_{N} & D_{N}\end{array}\right]\quad Z=\left[\begin{array}{@{}ccc@{}}1_{AT} & 0_{AT} & 0_{AT}\\ 0_{N} & 1_{N} & Z_{N}\end{array}\right]. & & \displaystyle\end{eqnarray}$$
The sample mean of the survey response variable in the Always Taker sample can be estimated by regressing the survey outcome on a constant. Specifically, in the Always Taker sample:
 $H_{i}=\unicode[STIX]{x1D6FC}_{0}+u_{i}$
, where
 $\unicode[STIX]{x1D6FC}_{0}$
is an estimate of ATASR. In the full data set, the complier mean outcome is the coefficient on the participation variable in the TSLS regression as described above. In the stacked data,
 $\hat{\unicode[STIX]{x1D703}}=(Z^{T}X)^{-1}(Z^{T}Y)$
is a joint estimator of the Always Taker and Complier means with
 $\hat{\unicode[STIX]{x1D703}}=[\hat{\unicode[STIX]{x1D6FC}_{0}},\hat{\unicode[STIX]{x1D6FD}_{0}},\hat{\unicode[STIX]{x1D6FD}_{1}}]$
.
The joint estimator produces the same point estimates as single equation estimators, but it also produces the joint covariance matrix required to compute a Wald test that
 $\unicode[STIX]{x1D6FC}_{0}=\unicode[STIX]{x1D6FD}_{1}$
, which evaluates the null hypothesis that the instrument is bias neutral. Since the Always Takers appear in both equations, researchers should use a cluster robust variance estimator that allows for dependency at the person level.
3.5 Validating Alternative Corrections for Survey Nonresponse Bias
The most widely used methods of correcting for survey nonresponse bias rest on some form of the MAR assumption. If MAR is valid, adjustments for differences in covariates between the respondents and nonrespondents should remove nonresponse bias. Depending on the situation, you might use MAR to justify corrections based on covariates using poststratification weights, multiple imputation, or inverse propensity score weights.
To understand the MAR assumption, consider a researcher studying HIV prevalence using biometric household survey data that suffers from high rates of nonresponse. In some situations, it might be reasonable to assume that the rate of HIV infection is the same for people who have the same gender, age, geographical location, and household wealth. However, some gender–age–geography–wealth groups may be more likely to respond to the survey than others. If the MAR assumption is valid, researchers can form estimates of sub-group-specific HIV prevalence using data on the HIV tests of respondents in each gender–age–geography–wealth sub-population. With those estimates in hand, overall HIV prevalence estimates can be formed by taking a weighted average of the sub-population prevalences with weights that reflect the relative size of each sub-population in the overall population. Of course, if survey respondents and nonrespondents have different HIV risks even within gender–age–geographic strata, then MAR fails and these weighted prevalence estimates will not lead to unbiased estimates of population HIV prevalence.
MAR is a common foundation for nonresponse corrections in applied work. But it is difficult to justify on theoretical grounds, and most of the time it is not empirically testable. The instrumental variables framework outlined here provides an opportunity to test one of the empirical implications of the MAR assumption. Specifically, MAR requires that
 $H_{i}\bot \!\!\!\bot (D(1)_{i},D(0)_{i})|X_{i}$
, where
 $X_{i}$
is a vector of covariates. The values of
 $D(1)_{i}$
and
 $D(0)_{i}$
pin down a person’s compliance type. In the IV setting, MAR is a claim that, conditional on the covariates, the distribution of survey responses is the same among Always Takers, Never Takers, Compliers, and Defiers.
If researchers have access to a credible instrumental variable that is not bias neutral, they can evaluate the effectiveness of a candidate nonresponse correction based on MAR. The idea is that the MAR-based strategy should be able to render the instrument bias neutral. To put the test into practice, researchers would need to construct the relevant weights and then apply the IV test for bias neutrality using the weighted data. Under the null hypothesis that MAR holds, average outcomes among Compliers and Always Takers should be equal. Weights based on a valid MAR assumption should undo the sensitivity and convert the bias sensitive instrument into a bias neutral instrument.
4 Empirical Application: The Swiss Electoral Study
4.1 Data
The Swiss Electoral Study (SES) is a survey instrument fielded after Switzerland’s national elections. The main survey is conducted over the phone using a probability sample drawn from a national register. The 2011 SES included an online survey based on an independent simple random sample from the national register. The research team sent an advance letter to each member of the online sample. One-third of the letters were randomly assigned to include a prepaid postal check for 20 CHF ($21.88 USD). The money was intended to encourage participation (Lipps and Pekari Reference Lipps and Pekari2016). Every member of the sample is included in the data, which means that the SES data set includes information on incentive status and several register variables for both respondents and nonrespondents. In contrast, questionnaire responses are only available for people who actually participated in the survey and answered the questions.
The study is easy to describe using the IV framework. The randomly assigned incentive is the instrumental variable. Participation is a person–item-level binary variable set to 1 if the person responded to a particular survey question. Responses to the survey questions are the outcomes of interest. Finally, the transformed outcome is the product of the participation variable and the response variable.
The IV assumptions seem credible in this application. Random assignment supports the independence assumption from a conceptual perspective. Register covariate balance provides a partial empirical test of independence. The exclusion restriction implies that receiving a 20 CHF check and completing the survey does not alter a person’s political knowledge and beliefs. That seems plausible but is not testable. The first-stage assumption requires that response rates are different in the two arms of the experiment, which is easy to verify in the data. The monotonicity assumption holds as long as providing the cash incentive does not convert anyone from a respondent to a nonrespondent. Monotonicity is not empirically testable, but it is consistent with a variety of theories of behavior. For example, if people adhere to a norm of reciprocity, then prepaid unconditional monetary transfers may make some people feel obliged to participate in the survey (Groves, Singer, and Corning Reference Groves, Singer and Corning2000; Singer and Ye Reference Singer and Ye2013). However, alternative theories in which extrinsic monetary compensation reduces intrinsic motivation might cast doubt on the monotonicity assumption (Rebitzer and Taylor Reference Rebitzer and Taylor2011).
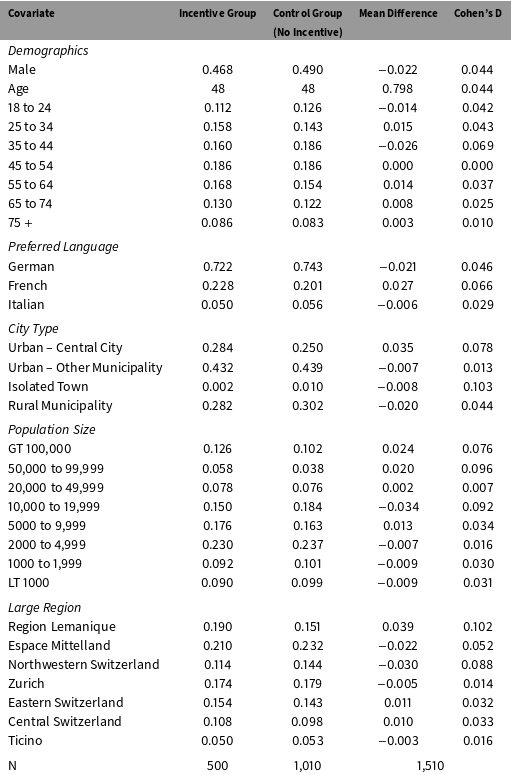
Covariate Balance in the Incentive Experiment.
4.2 Register Covariate Balance
The IV analysis maintains the assumption that the instrument is statistically independent of the participation potential outcomes and survey responses. Independence is implied by the random assignment procedure, but it is impossible to verify the assumption empirically because half of the potential outcomes are counterfactual. However, random assignment also implies that the distribution of register covariates should be balanced across the two arms of the study.
The first two columns of Table 1 show the average value of each register covariate in the incentive and control groups. The third and fourth columns show the difference in means and the absolute value of the standardized mean difference between the two groups. The largest discrepancy across all of the variables in Table 1 is only .10 standard deviations. The results in the balance table provide indirect support for the validity of the independence assumption.
4.3 First-Stage Results
The online survey includes a summary measure of each person’s participation. Table 2 shows that about 76% of the control group members are coded as No Response, which means they never started the online questionnaire. In contrast, only 55% of the incentivized group are coded as No Response. Most of reduction in nonresponse came in the form of Complete Responses, which occur when people log in to the survey and click the submit button at the end of the questionnaire. Without the incentives, 22% of the sample clicked the submit button and 1.4% broke off before clicking submit. The completion rate was almost 43% in the incentivized group; there was little difference in the partial completion rate.
Incentives and Survey Participation.
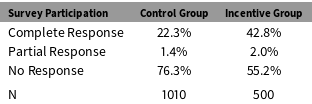
The gross participation rates in Table 2 support the first-stage assumption, which requires that the instrument affects participation rates. But the complete and partial response categories do not reveal whether a person actually responded to each individual questionnaire item. It is possible that the incentives were more important for some items than for others. Table 3 reports estimated coefficients from item-specific OLS regressions with the form:
 $Dj_{i}=\unicode[STIX]{x1D6FC}_{j0}+\unicode[STIX]{x1D6FC}_{j1}Z_{i}+v_{ji}$
. In each model,
 $Dj_{i}$
is a binary variable set to 1 if person
 $i$
answered questionnaire item
 $j$
;
 $\unicode[STIX]{x1D6FC}_{j0}$
measures the response rate for item
 $j$
in the control group, and
 $\unicode[STIX]{x1D6FC}_{j1}$
represents the first-stage effect of the incentives on the response rate for item
 $j$
.
First-Stage Effects of Incentives on Item-Specific Response Rates.
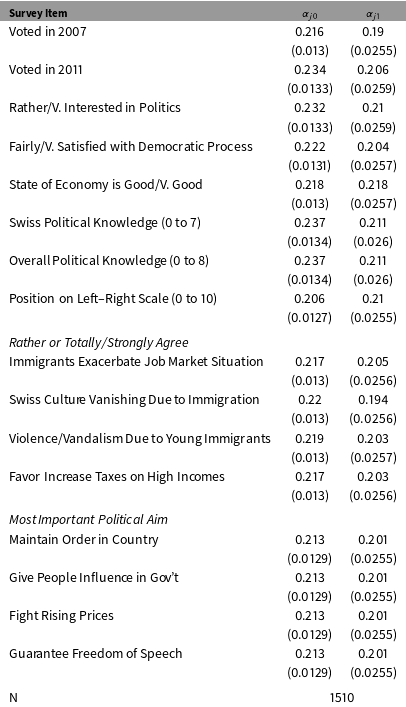
Note: Heteroskedasticity robust standard errors are in parentheses.
For most items, the response rate was around 22% in the control group, and the incentive increased response rates by about 20 percentage points. That means that the 20 CHF ($21.88 USD) check increased response rates by about 93 percent. A conventional rule of thumb in the IV literature suggests that the F-statistic on the first-stage effect should exceed 10. For most of the items in Table 3, the F-statistic is around 63.
The regression coefficients also provide a convenient way to measure the size of the Always Taker, Complier, and Never Taker populations. The intercept from the first-stage regression is an estimate of the prevalence of Always Takers in the survey population since
 $\unicode[STIX]{x1D6FC}_{j0}=Pr(D_{ji}=1|Z_{i}=0)=Pr(D(0)_{ji}=1)$
under the IV assumptions. Likewise the coefficient on the instrument provides an estimate of the prevalence of compliers because
 $\unicode[STIX]{x1D6FC}_{j1}=Pr(D_{ji}=1|Z_{i}=1)-Pr(D_{ji}=1|Z_{i}=0)=Pr(D(1)_{ji}-D(0)_{ji}=1)$
. Netting out the Compliers and Always Takers provides an estimate of the prevalence of Never Takers:
 $Pr(D(0)_{ji}=D(1)_{ji}=0)=1-\unicode[STIX]{x1D6FC}_{j0}-\unicode[STIX]{x1D6FC}_{j1}$
. In the SES target population, about 22% of people are Always Takers who would have responded without an incentive. About 20% are Compliers who participated because of the incentive. The remaining 58% are Never Takers.
4.4 Complier Average Causal Responses and Bias Neutrality
Table 4 reports estimates of average survey responses among Compliers (CASR) and Always Takers (ATASR). I estimated the Complier and Always Taker averages using the stacked regression framework described earlier, and I estimated standard errors using a cluster robust variance matrix that allows for dependencies that arise because some people contribute to both estimates. The final column shows the Chi Square statistic associated with the test of the null hypothesis that the CASR and ATASR are equal.
Complier Average Outcomes and Tests for Bias Neutrality.
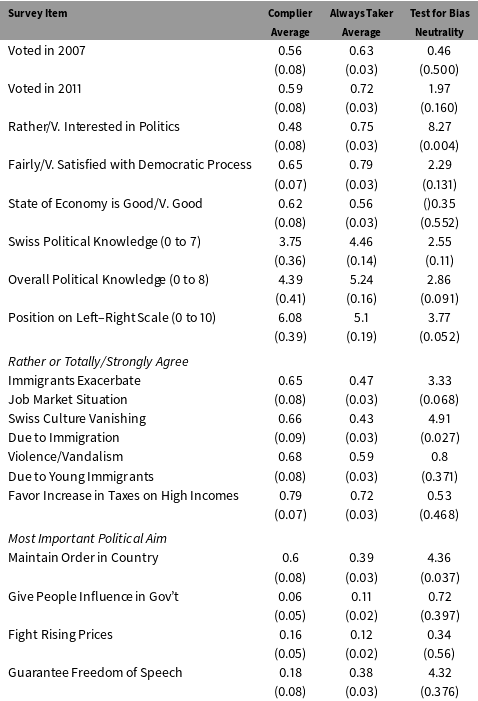
Note: Clustered robust standard errors for estimates of the CASR and the ATSR are in parenthesis under the point estimates. The final column shows the Chi Square test statistics and the associated
 $p$
value for the test of the null hypothesis that CASR
 $=$
ATSR.
The results suggest that, compared to Always Takers, Compliers were somewhat less likely to have voted in the 2007 and 2011 elections. However, the difference in voting rates was not statistically significant. In contrast, the two groups had very different levels of interest in politics. 48% of Compliers were rather or very interested in politics compared to 75% of Always Takers (
 $p<.01$
). One interpretation is that the cash incentives pulled in a group of people who were less politically engaged than the people who answered regardless of whether they received an incentive. Compliers were also less likely to report that they were satisfied with the democratic process, and they scored lower on simple measures of national and overall political knowledge. These differences were not precisely estimated:
 $p$
values on tests of bias neutrality were around .09 to .13. Both groups were relatively centrist according to self-reported positions on a left–right scale from 0 to 10, but the Compliers were about 1 point further to the right (
 $p<.10$
). Compliers had more negative views of immigration than Always Takers. About 65% of Compliers felt that immigrants exacerbated the (weak) job market situation in Switzerland compared to only 46% of Always Takers (
 $p<.10$
). And 66% of Compliers felt that Swiss culture was vanishing due to immigration, compared to only 43% of Always Takers (
 $p<.05$
). Compliers and Always Takers had similar views on tax increases and the state of the economy. But they had systematically different political aims. About 60% of Compliers felt that the most important goal was to maintain order in Switzerland, compared to only 39% of Always Takers (
 $p<.05$
). In contrast, 38% of Always Takers reported that freedom of speech was the central political aim compared to only 18% of Compliers (
 $p<.05$
).
Overall, the results in Table 4 suggest that the cash incentives encouraged participation among people who hold more nationalist views than the people who would participate in the absence of the incentives. The instrumental variable tests are sufficient to reject bias neutrality at the 10-percent level or better for measures of interest in politics, political knowledge, ideology, opinions on immigration, and political priorities. These tests imply that participation incentives did more than increase the number of respondents to the survey. The incentives changed the mix of people who answered the survey questions. Since both the incentivized and unincentivized groups continued to have high rates of nonresponse, it is not clear which respondent sample is more representative of the overall population.
4.5 Testing the Validity of Nonresponse Weights
A good starting point in many studies of nonresponse bias is to compare the distribution of the sampling frame covariates among respondents and nonrespondents. If survey participation is associated with the values of the frame covariates, then nonresponse bias seems like a realistic concern. A natural follow up would involve adjusting the respondent data to account for covariate differences. This logic underlies various forms of nonresponse adjustment. The virtues of specific methods—imputation methods, poststratification weighting methods, propensity score methods—depend on data constraints and the context of the problem. A natural approach in the SES data is to re-weight the respondent data to reflect the covariate distribution in the full sample using inverse propensity score weights.
To demonstrate, let
 $D_{i}$
be an indicator set to 1 if the person participated in the survey, and let
 $X_{i}$
be a vector of register covariates. The propensity score—
 $p(X_{i})=Pr(D_{i}|X_{i})$
—is the probability that the person participates in the survey given his covariates. Assuming that
 $H_{i}\bot \!\!\!\bot (D(1)_{i},D(0)_{i})|X_{i}$
and
 $0<Pr(D_{i}|X_{i})<1$
, inverse propensity score weighted (IPW) estimates of various respondent sample moments are unbiased for their population counterparts.
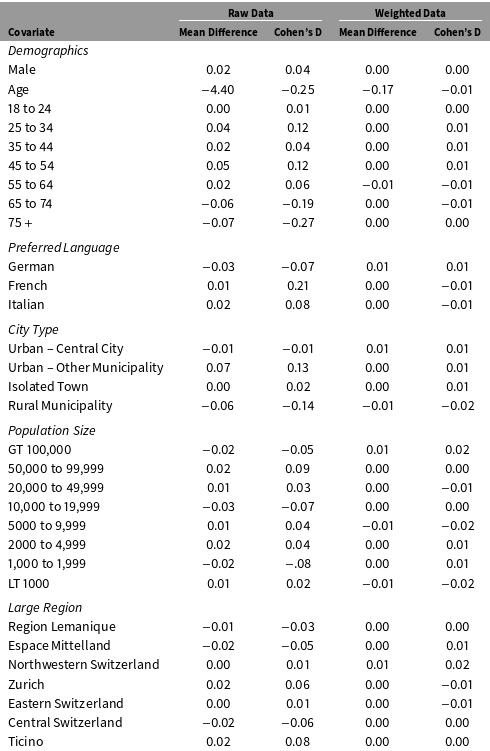
I estimated propensity scores using logistic regressions of survey participation on a vector of register covariates. Table 5 compares register covariate balance between the respondent and nonrespondent samples before and after the inverse propensity score weights are applied to the data. The table shows that several variables are out of balance in the raw sample, which implies that survey participation rates do differ across sub-populations defined by the register covariates. However, the two samples are well balanced after weighting. The mean differences are nearly zero for all of the register variables, and the absolute values of the Cohen’s D statistics are less than .03 standard deviations for every variable.
Covariate Balance Before and After Inverse Propensity Score Weighting.
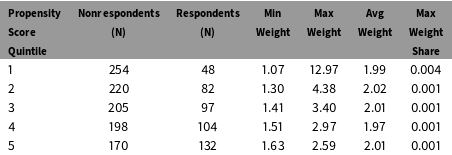
In principle, IPW estimates may be sensitive to extreme weights. Table 6 stratifies the sample into quintiles of the propensity score distribution and shows the sample size and the range of weights in each strata. The final column reports the largest weight in each strata as a percentage of the sum of the weights. The largest weight in the sample is 12.97; it represents less than 1% of the sum of the weights. The results in the table suggest that extreme weights are not a major concern in these data.
Distribution of Inverse Propensity Score Weights.
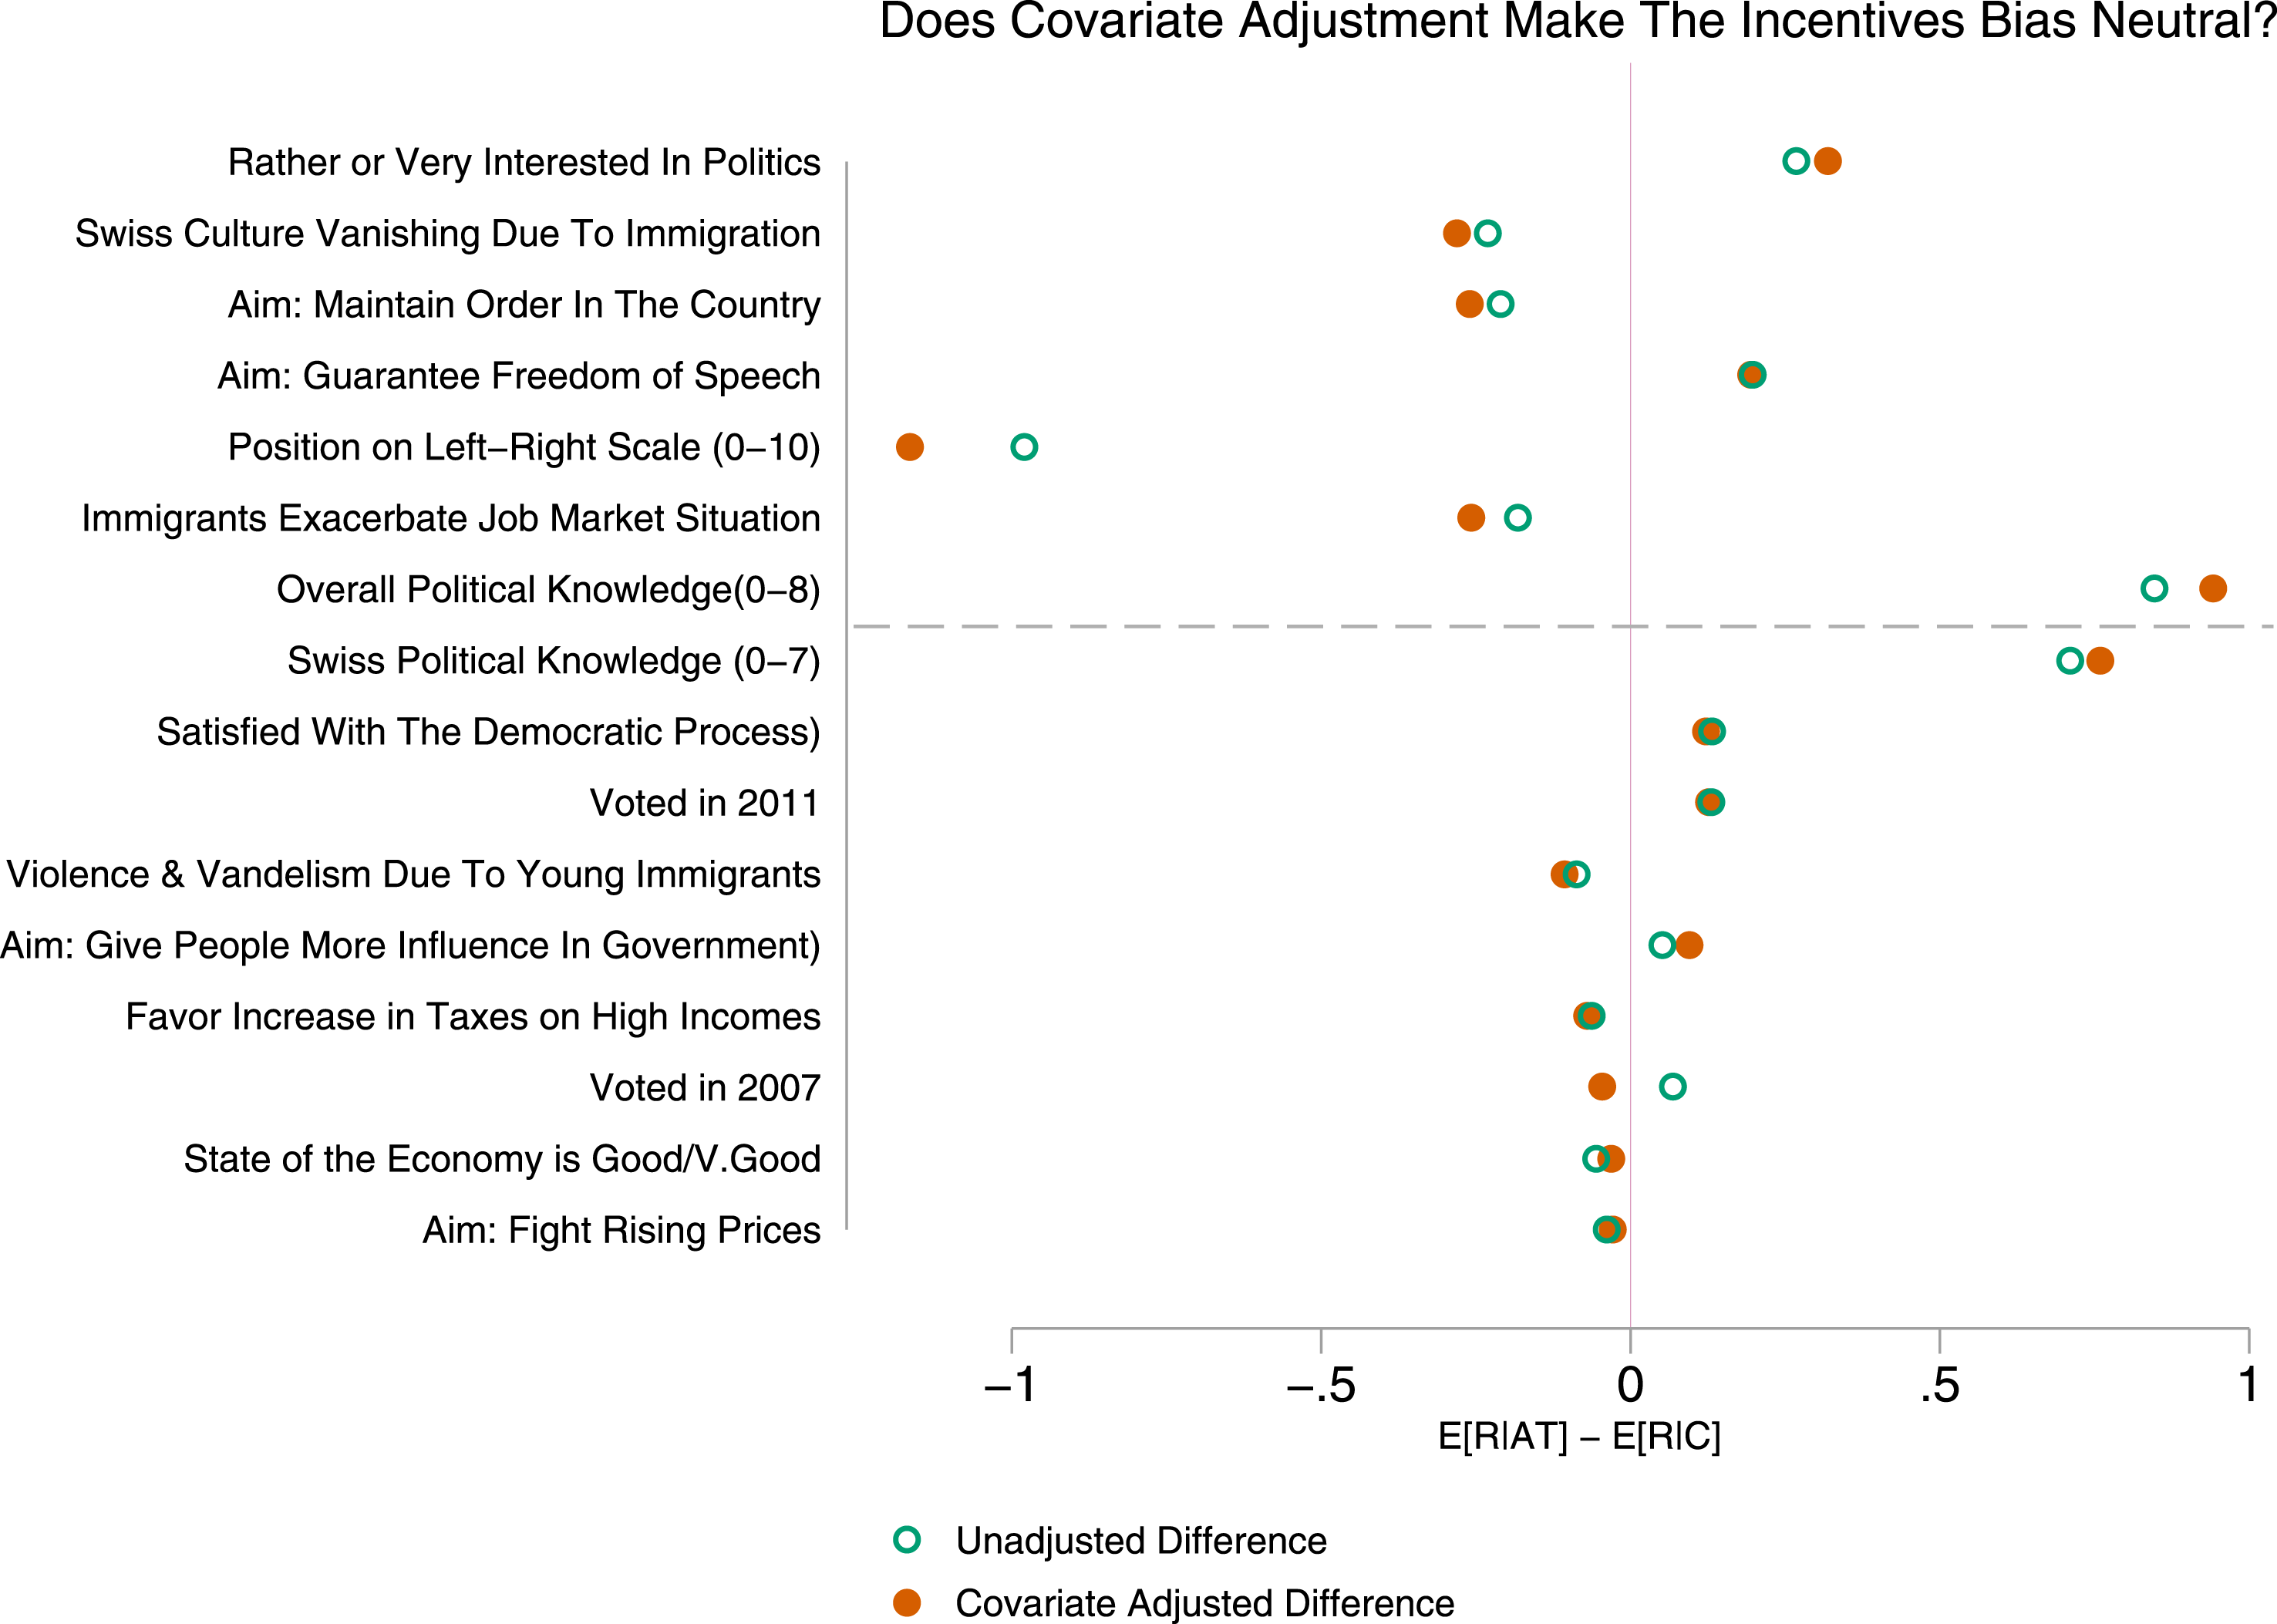
I estimated IPW versions of the stacked regressions presented earlier. The idea is that if the weights remove nonresponse bias then they should equalize the Complier and Always Taker averages. Figure 1 compares estimates of the mean difference in Always Taker and Complier responses based on the unweighted and weighted models. The open circles show the difference in means in the unadjusted data; these are the same statistics reported in Table 4. The solid circles show the difference in means in the weighted data. The results are sorted by the estimated
 $p$
value on the unweighted mean difference. The mean differences above the dashed line were statistically significantly different from zero at the 10% level or better in the unadjusted data. The covariate adjustment did not lead to substantial changes in the mean differences. In many cases, the gap between the Always Takers and Compliers was actually larger after weighting. In the SES data, the register covariates do not seem to account for the differences between the Always Takers and the Compliers.
The open circles show the estimated difference in average survey responses given by Always Takers and Compliers in the unadjusted data. The solid circles show the estimated differences when inverse propensity scores are used to adjust for differences in register covariates between respondents and nonrespondents. The estimates are sorted by the
 $p$
value on the unadjusted differences. All of the outcomes above the dashed line were statistically significant at the 10% level or better in the unadjusted data.
5 Discussion
This paper shows how to exploit the logic of instrumental variables to measure average survey responses among people who are pulled into a sample because of an exogenous instrumental variable. It also shows how to test whether the increased response rate is bias neutral, and offers a way to gauge the performance of alternative corrections for nonresponse bias that are based on the MAR assumption.
The method is related to work by Abadie (Reference Abadie2003) and Imbens and Rubin (Reference Imbens and Rubin1997). Both of those studies are concerned with the identification of the marginal distributions of treated and untreated potential outcome distributions. The test for bias sensitivity presented in this paper is conceptually similar to the test by Hausman (Reference Hausman1978) and recent variants described by Angrist (Reference Angrist2004) and Bertanha and Imbens (Reference Bertanha and Imbens2014). Of course, these studies are concerned with treatment effects rather than survey nonresponse.
At a conceptual level, the analysis in this paper highlights a disconnect that has emerged in the literature on missing data and causal inference. In the older literature, structural models of sample selection based on instrumental variables were used to study both causal inference and missing data. Since the 1990s, researchers have often studied causal questions using instrumental variables motivated by research design rather than a structural model of behavior. However, design-based approaches to instrumental variables have been limited to questions about treatment effects and have not played an important role in the analysis of missing data. This paper shows how design-based instrumental variables can be used to study problems related to missing data and survey nonresponse.
The method developed in the paper has several limitations. First, it requires that researchers have access to a research design that justifies the instrumental variable assumptions. Second, the method proposed in the paper is not a correction for survey nonresponse bias, and it is not a test of whether a particular survey actually suffers from nonresponse bias. Instead, it is a technique that researchers can use to understand whether and how an exogenous change in survey response rates alters the composition of the respondent sample. One advantage of a design-based approach is that it is apt to apply to a broader set of substantive areas of research under weaker assumptions about underlying behavioral models. The catch is that the analysis will support weaker conclusions about nonresponse bias.
The instrumental variable framework also raises questions about how researchers might study survey nonresponse bias in less tightly controlled settings. The application in the paper relies on a randomized survey experiment. However, there is nothing about the instrumental variables framework that requires a formal randomized experiment. In the causal inference literature, quasi-experimental research designs often are analyzed using instrumental variables. Extensions of the method developed in this paper to quasi-experimental settings in which public policies, political and economic conditions, or survey design factors affect survey response rates seem like promising directions for future work.



