Introduction
Glaucoma, a progressive degenerative neuropathy of the retina, is one of the most frequently observed conditions resulting in visual impairment and blindness, primarily due to the selective loss of retinal ganglion cell function, retinal ganglion cell death, and optic nerve atrophy (Quigley & Green, Reference Quigley and Green1979; Quigley, Reference Quigley1996, Reference Quigley1999). Glaucoma is characterized by attrition of the optic nerve head, gliosis, a progressive loss of optic nerve axons, and ganglion cell death attributed to apoptosis (Quigley, Reference Quigley1999). Elevated intraocular pressure (IOP) is a common risk factor for glaucoma, although the range of IOPs is highly variable (Libby et al., Reference Libby, Anderson, Pang, Robinson, Savinova, Cosma, Snow, Wilson, Smith, Clark and John2005; Inman et al., Reference Inman, Sappington, Horner and Calkins2006). Ganglion cell damage and death are likely initiated by multiple factors, including cellular stress induced by ischemia and excitotoxicity. In some animal models, nerve damage at the lamina cribrosa occurs from compression of optic nerve axons with increased IOP or a variety of other factors not associated with elevated IOP (Quigley, Reference Quigley1999; Morrison et al., Reference Morrison, Johnson, Cepurna and Jia2005). Although the main mechanism of retinal ganglion cell death is known to be apoptosis, the underlying physiological and cellular triggers that lead to this pathology have not been established yet (Kuehn et al., Reference Kuehn, Fingert and Kwon2005).
The DBA/2J (D2) mouse strain has become an important model for studying the natural progression of ganglion cell death in glaucoma (Nickells, Reference Nickells1996; John et al., Reference John, Smith, Savinova, Hawes, Chang, Turnbull, Davisson, Roderick and Heckenlively1998; Chang et al., Reference Chang, Smith, Hawes, Anderson, Zabaleta, Savinova, Roderick, Heckenlively, Davisson and John1999; Nickells, Reference Nickells1999; Jakobs et al., Reference Jakobs, Libby, Ben, John and Masland2005; Libby et al., Reference Libby, Anderson, Pang, Robinson, Savinova, Cosma, Snow, Wilson, Smith, Clark and John2005; Schlamp et al., Reference Schlamp, Li, Dietz, Janssen and Nickells2006). Several ocular abnormalities become apparent as D2 animals age, including anterior synechia, iris stromal atrophy, pigment dispersion, and elevated IOP. In many animals, elevated IOP is initially detected around 6 months of age, followed by glaucomatous changes, such as ganglion cell death, optic nerve atrophy, and optic nerve head cupping (John et al., Reference John, Smith, Savinova, Hawes, Chang, Turnbull, Davisson, Roderick and Heckenlively1998; Chang et al., Reference Chang, Smith, Hawes, Anderson, Zabaleta, Savinova, Roderick, Heckenlively, Davisson and John1999). There is a great deal of variability in the D2 strain in the age-related progression of axonal loss and damage and retinal ganglion cell death, including a small number of animals that show such pathology very early and some animals that never develop glaucomatous changes at all (Schuettauf et al., Reference Schuettauf, Quinto, Naskar and Zurakowski2002; Inman et al., Reference Inman, Sappington, Horner and Calkins2006; Howell et al., Reference Howell, Libby, Marchant, Wilson, Cosma, Smith, Anderson and John2007). Two recessive mutations, glycosylated protein nmb (Gpnmb; NCBI GeneID 93695) and tyrosinase-related protein 1 (Tyrp1; NCBI GeneID 22178) (Chang et al., Reference Chang, Smith, Hawes, Anderson, Zabaleta, Savinova, Roderick, Heckenlively, Davisson and John1999; Anderson et al., Reference Anderson, Smith, Hawes, Zabaleta, Chang, Wiggs and John2002), lead to iris disease in D2 mice, depositing pigment and eventually obstructing the ocular drainage structures (Chang et al., Reference Chang, Smith, Hawes, Anderson, Zabaleta, Savinova, Roderick, Heckenlively, Davisson and John1999).
Past studies have addressed the etiology and pathophysiology of glaucoma in the D2 mouse (Chang et al., Reference Chang, Smith, Hawes, Anderson, Zabaleta, Savinova, Roderick, Heckenlively, Davisson and John1999; Jakobs et al., Reference Jakobs, Libby, Ben, John and Masland2005; Libby et al., Reference Libby, Anderson, Pang, Robinson, Savinova, Cosma, Snow, Wilson, Smith, Clark and John2005; Moon et al., Reference Moon, Kim, Gwon, Park, Kang, Lim, Choi and Chun2005; Inman et al., Reference Inman, Sappington, Horner and Calkins2006; Schlamp et al., Reference Schlamp, Li, Dietz, Janssen and Nickells2006; Howell et al., Reference Howell, Libby, Marchant, Wilson, Cosma, Smith, Anderson and John2007). The progressive death of retinal ganglion cells was studied using retrograde labeling and cell-specific immunohistochemical markers, such as neurofilament staining (Dyka et al., Reference Dyka, May and Enz2004; Jakobs et al., Reference Jakobs, Libby, Ben, John and Masland2005; Moon et al., Reference Moon, Kim, Gwon, Park, Kang, Lim, Choi and Chun2005). However, such studies are limited by the incomplete labeling of ganglion cell populations and, in some cases, the inability to accurately distinguish ganglion cells from the numerous displaced amacrine cells that also occupy the ganglion cell layer (GCL) (Jeon et al., Reference Jeon, Strettoi and Masland1998). In the mouse retina, it is estimated that 40–45% of the neurons in the GCL are ganglion cells and some overlap in size with the 55–60% of the displaced amacrine cells that occupy the same cell layer (Williams et al., Reference Williams, Strom, Rice and Goldowitz1996; Jeon et al., Reference Jeon, Strettoi and Masland1998). Retrograde labeling, a technique often used to label ganglion cells by the transport of tracers from their axonal terminals to their cell bodies, is likely to be affected in glaucoma due to axonal changes (Jakobs et al., Reference Jakobs, Libby, Ben, John and Masland2005; Howell et al., Reference Howell, Libby, Marchant, Wilson, Cosma, Smith, Anderson and John2007). In addition, retrograde transport tracers are usually an index of transport and cannot be used as reliable markers for somatic changes in the retina. Furthermore, other labeling techniques require tissue fixation, which is incompatible with in vivo or live cell studies using dissociated retinal cells or explants. Therefore, there was a critical need to develop alternative experimental approaches for visualizing ganglion cells and their axons in this glaucoma animal model.
The aim of our study was to generate and characterize an animal model in which retinal ganglion cells could be directly visualized by the expression of a fluorescent marker during the development of glaucoma. We generated the Thy1-CFP DBA/2J (CFP-D2; DBA/2J.Cg-Tg(Thy1-CFP)23Jrs/J) transgenic mouse line, with Thy1 promoter controlled cyan fluorescent protein (CFP) expression in retinal ganglion cells, by the congenic breeding of a Thy1-CFP mouse line (#23; Jackson Laboratory, Bar Harbor, ME) (Feng et al., Reference Feng, Mellor, Bernstein, Keller-Peck, Nguyen, Wallace, Nerbonne, Lichtman and Sanes2000) and the D2 mouse line (Jackson Laboratory). Thy1-CFP transgenic mice were previously generated by the injection of gel-purified DNA vectors containing the regulatory sequences of the murine Thy1.2 gene driving the expression of CFP constructs into fertilized oocytes of C57BL/6J mice (Feng et al., Reference Feng, Mellor, Bernstein, Keller-Peck, Nguyen, Wallace, Nerbonne, Lichtman and Sanes2000). Thy1 is an immunoglobulin superfamily gene that is expressed by neurons in many parts of the central nervous system, including retinal ganglion cells and by several nonneuronal cell types, such as thymocytes (Morris, Reference Morris1985). CFP expression within individual cells is stable throughout the lifetime of the animal and has no effects on cellular homeostasis, synaptic structure, or function (Feng et al., Reference Feng, Mellor, Bernstein, Keller-Peck, Nguyen, Wallace, Nerbonne, Lichtman and Sanes2000; Tian & Copenhagen, Reference Tian and Copenhagen2003). The Thy1-CFP mouse line is characterized by the prominent expression of CFP in numerous fluorescent ganglion cell bodies, as well as their axons and dendrites, in all retinal regions (Raymond et al., Reference Raymond, Vila, Huynh and Brecha2008).
Materials and methods
Animal procedures
Mice were housed and monitored on a daily basis in the Animal Care Facility at the David Geffen School of Medicine at the University of California, Los Angeles (UCLA). NIH, American Physiological Society, Society for Neuroscience, UCLA, and Veteran’s Administration animal guidelines were followed concerning animal welfare. Mice used for tissue collection for immunohistochemistry and polymerase chain reaction (PCR) were euthanized by Isofluorane (Novaplus, Lake Forest, IL) inhalation anesthesia and decapitated. Thy1-CFP C57BL/6 (B6.Cg-Tg(Thy1-CFP)23Jrs/J) mice and DBA/2J mice were purchased from the Jackson Laboratory, and the CFP-D2 animal colony was established at UCLA. D2 breeders were bred into the colony at each generation up to N12, then every 3–4 generations thereafter.
For these studies, we used female CFP-D2 mice, 3 weeks to 12 months of age, generations N3 to N12 as stated in the text, and age- and sex-matched D2 and Thy1-CFP C57BL/6 mice for comparisons to the published ocular D2 phenotype and CFP expression, respectively. As negative controls, we used female CFP-D2 mice that did not develop elevated IOP and ganglion cell loss. The CFP-D2 line characterized in this study will be made available to the academic research community through the Jackson Laboratory or the NIH mouse repository.
Microsatellite genetic analysis
Microsatellites, or Simple Sequence Repeats, are polymorphic noncoding DNA loci that consist of repeating units of 1–6 base pairs in length. Their variability between mouse strains can be used as molecular markers to determine the genetic background of an animal strain. To guide our breeding, we screened progeny using microsatellite markers closest in proximity to the isa and ipd loci (D4Mit81 and D6Mit275 located on mouse chromosomes 4 and 6) that contain the Gpnmb and Tyrp1 mutations, using the following primer sequences: GACCTGAGTCTTTCTTAAGATGGA and GCTTGCTTTTTTGGCTTCTG and GGAGAACCCTGACTTTTTTGC and ATGAAAGGTATTTTCAATACTCCACC, respectively.
To score microsatellite markers, genomic DNA was isolated from tail tips by a standard phenol/chloroform extraction procedure. PCR was performed in a reaction volume (10 μl) containing Tris-HCl (10 mm, pH 8.3); KCl (50 mm); MgCl2 (1.5 mm); 0.01% (w/v) gelatin; dATP, dCTP, dGTP, and dTTP (0.2 mm each); primers (0.13 mm each); genomic DNA (100 ng); and AmpliTaq DNA polymerase (0.25 U). The PCR conditions were 94°C for 2 min, then 35 cycles at 94°C for 15 s, 50°C for 2 min, and 72°C for 2 min, followed by a final incubation at 72°C for 7 min. PCR products were electrophoresed on 4% agarose gels (FMC Bioproducts, Rockland, ME) in TAE and visualized with ethidium bromide staining.
A detailed microsatellite analysis of specific locations on each mouse chromosome was evaluated by Charles River Laboratories (Troy, NY) to detect D2 congenicity. This analysis is a PCR-based method that scans the X chromosome and all 19 autosomes of the mouse genome at approximately 15-cM intervals (a total of 103 microsatellite markers) and distinguishes between the D2 and the C57BL/6 genotypes at each locus (http://www.criver.com/SiteCollectionDocuments/rm_gt_d_background_strain_characterization.pdf). Generations N5, N9, and N10 of the CFP-D2 mouse line were tested in this manner, with generation N10 yielding 99.5% D2 congenicity overall (Supplemental Table 1).
Thy1-CFP PCR
Thy1-CFP and CFP-D2 mice were genotyped to confirm the inclusion of the CFP reporter transgene under the control of the Thy1 promoter. Mouse tail DNA was prepared by digesting 2–3 mm of mouse tail overnight at 55°C in 180 μl tail digestion buffer [50 mm Tris-HCl (pH 8.0), 1 mm MgCl2, and 1% Tween-20] with 20 μl proteinase K (10 mg/ml). Genotypes were determined by PCR using the following primers: Thy1F1 (TCTGAGTGGCAAAGGACCTTAGG) from Thy1 sequence and ECFPR1 (CCGTCGCCGATGGGGGTGTT) from Thy1-CFP mice. PCR reactions were performed in 25 μl total volume containing 50 mm Tris-HCl (pH 9.2), 16 mm ammonium sulfate, 3.5 mm MgCl2, 0.1% Tween-20, 0.2 mm dNTP, 2.5 U KlentaqLA (Clonetech, Mountain View, CA), and 1 μl mouse tail DNA. The PCR reaction was started at 94°C for 1.5 min and then continued for 35 cycles at 30 s/94°C, 60 s/60°C, and 60 s/72°C, with a final amplification step of 72°C for 10 min. Approximately one third of the PCR reaction was separated by electrophoresis in 1.5% agarose, stained with ethidium bromide (1.25 μg/ml) in 1X TAE, and photographed. The animals were scored as CFP positive if the predicted 173bp PCR DNA product was obtained. PCR products were sequenced to confirm identity.
Tissue preparation and histology
Mice were euthanized and the eyes were removed and dissected. For transverse sections, the eyecups containing retinas were fixed in 4% paraformaldehyde (PFA) in 0.1 m phosphate buffer (PB), pH 7.4 for 15–60 min at room temperature and then transferred to 30% sucrose overnight at 4°C. The eyecups with the retina were frozen in Optical Cutting Temperature (Reichert-Jung, Bensheim, Germany) and sectioned perpendicularly to the vitreal surface at 10–12 μm with a cryostat, and retinal sections were collected onto gelatin-coated slides and stored at −20°C until antibody staining. For wholemount preparations, retinas were removed from the eyecup after 1 min in 4% PFA, dissected and flattened between two slides with spacers on both ends, and fixed for an additional 15–30 min. Isolated retinas were transferred to 0.1 m PB and stored at 4°C until antibody staining. For histology, mouse eyecups, including the retina, were fixed in 4% PFA for 24 h. The fixative was replaced with 70% ethanol and the eyecups were embedded in paraffin, sectioned (4 μm), and stained with hematoxylin and eosin (H&E; Sigma, St Louis, MO) using standard procedures. We evaluated serial sagittal sections through central retina, including the optic nerve.
Immunohistochemistry
Retinal sections were rinsed in 0.1 m PB for 30 min and then incubated for 12–16 h at 4°C in the primary antibody solution in a humidified chamber. Primary antibody solution routinely contained 1–5% normal goat serum, 1% bovine serum albumin, and 0.5% Triton X-100 in 0.1 m PB, pH 7.4. Retinal sections were washed and incubated in secondary antibodies conjugated with Alexa 568 or Alexa 633 (1:1000; Molecular Probes, Eugene, OR) for 1–2 h at room temperature in 0.1 m PB containing 0.5% Triton X-100. Sections were washed for 30 min with 0.1 m PB, air-dried, and mounted using the ProLong Antifade Kit (Molecular Probes). Retinal wholemounts were incubated in 1% sodium borohydride (in deionized water) for 1 h at room temperature, rinsed, and incubated in primary antibody solution as above, for 5–7 days at 4°C. Retinal wholemounts were washed and incubated in secondary antibody solution as above, for 1–2 days at 4°C, rinsed again, and mounted onto glass slides ganglion cell side up, air dried, and coverslipped using the ProLong Antifade Kit or Vectashield Mounting Medium (Vector Laboratories, Burlingame, CA) containing the fluorescent nuclear dye 4′, 6-diamidino-2-phenylindole (DAPI).
Antibodies
Primary antibodies that immunolabel amacrine and displaced amacrine cells and ganglion cells were used as follows: mouse monoclonal antibodies against neuronal nuclei (NeuN; 1:3000; Millipore, Temecula, CA), a nonphosphorylated epitope on neurofilaments of high molecular weight (SMI32; Millipore), and the POU-domain protein Brn3a (clone 5A3.2; 1:1000; Millipore), rabbit polyclonal antibodies against neurofilament-light (NF-L; 1:5000; Millipore), and goat polyclonal antibodies to choline acetyltransferase (ChAT; 1:500; Millipore). Immunolabeling with these primary antibodies was visualized using fluorochrome-conjugated secondary antibodies Alexa 568- and Alexa 633-conjugated goat anti-rabbit IgG, donkey anti-goat IgG, and goat anti-mouse IgG (1:1000; Molecular Probes, Eugene, OR). Controls, including cognate peptide adsorption studies, were carried out to evaluate specificity of the primary antibodies and binding of the secondary antisera to the appropriate antigen–antibody complex. These preparations were evaluated using both conventional and confocal microscopy.
Light and confocal microscopy
Retinal sections and wholemounts were examined and analyzed with a Zeiss LSM 510 Meta confocal microscope (Zeiss, Thornwood, NY) equipped with argon (Ar) and helium/neon (He/Ne) lasers, using a Plan-Neofluar 40× 1.3 numerical aperture or a Plan-Neofluar 63× 1.25 numerical aperture objective or an Axiocam digital camera (Zeiss) mounted onto a Zeiss Axioplan Two fluorescence microscope. Digital scans were acquired at a magnification zoom of 1× to 2.5× and a resolution of 1024 × 1024 or 2048 × 2048. Confocal scans were acquired at an optical thickness between 0.5 and 1.0 μm and ~1.0 airy unit. For projections, typically 3–8 optical sections were acquired with an average total thickness of 3–8 μm and compressed for viewing. All confocal images shown are maximum projections of stacks. Digital confocal stacks were saved as Zeiss .LSM files and final publication quality images were exported in the .TIFF format at 300 dpi using Zeiss LSM 510 Meta software version 3.2. images were adjusted for contrast and brightness, labeled, and formatted using Adobe Photoshop 7.0.1 (Adobe Systems, Inc., San Jose, CA) and saved at 300 dpi at their final magnification.
Quantitative analysis
Average somal diameters and densities of CFP-expressing cells were determined from confocal stacks of the CGL or the inner nuclear layer (INL) taken from retinal wholemounts. Scans were acquired every 500 μm from the optic nerve head along the dorsoventral and nasotemporal axes, and 200 × 200 μm fields were analyzed in their entirety. Somal size was obtained by averaging the maximum and minimum diameters of CFP-fluorescent cells measured manually using Zeiss LSM 510 software (Zeiss). We did not attempt to correct for the negligible shrinkage of the tissue from the mounting process. The number of DAPI, NF-L, NeuN, Brn3a, SMI 32, and ChAT immunoreactive cell bodies containing CFP fluorescence was determined from similar digital stacks taken 1.5 mm from the optic nerve head in the nasal retina along the nasotemporal axis.
IOP measurements
IOP measurements were obtained from our colony of CFP-D2 mice using a commercially available murine rebound Tonometer (Colonial Medical Supply Co., Franconia, NH; Reitsamer et al., Reference Reitsamer, Kiel, Harrison, Ransom and McKinnon2004; Libby et al., Reference Libby, Anderson, Pang, Robinson, Savinova, Cosma, Snow, Wilson, Smith, Clark and John2005) at 2, 3, 6, 9, and 12 months of age. With the exception of the 2- and 3-month-old animals, which were measured consecutively, average IOP values were measured only 1 time in each animal eye to minimize any effect of corneal abrasion on disease development and progression (although it was recently demonstrated that tonometer-induced corneal damage does not impact disease progression in D2 mice; Inman et al., Reference Inman, Sappington, Horner and Calkins2006). Mice were acclimatized to the environment for 1 day and anesthetized using intraperitoneal injections of ketamine (50 mg/kg) and xylazine (5 mg/kg). The tip of the Tonometer was applied toward the center of the cornea and six readings were obtained for the calculation of the mean pressures in each eye.
Cell counts
Ganglion cells were counted in 12-month-old CFP-D2 retinal whole mounts from N9 CFP-D2 female mice. Since retinal ganglion cell loss does not occur uniformly in D2 mice, the entire retinal surface was sampled; a grid with intersections each 500 μm was placed over each retinal wholemount and centered at the optic nerve head. Ten confocal optical slices 250 × 250 μm (z axis = 1 μm) were obtained at each point of intersection and stacked to ensure that all the cells in the GCL were visible. The total number of CFP-expressing cells was counted and converted to cells per square millimeter. For this analysis, CFP fluorescence was used as the primary ganglion cell marker. However, the whole mounts were also labeled with NF-L, NeuN, and DAPI to confirm the presence or absence of ganglion cells and cell nuclei.
Results
Development of the CFP-D2 mouse line
A D2 mouse line with Thy1-CFP labeled ganglion cells was generated by the congenic breeding of the Thy1-CFP C57BL6/J mouse line (#23) (Feng et al., Reference Feng, Mellor, Bernstein, Keller-Peck, Nguyen, Wallace, Nerbonne, Lichtman and Sanes2000) into the D2 background. Thy1-CFP positive progeny (Fig. 1), as confirmed by PCR analysis, was serially backcrossed to the D2 strain to establish genetic purity in the new CFP-D2 mouse line, which is currently in the N14 generation.
Microsatellite marker analysis: Microsatellite analysis of genetic loci D4Mit81 and D6Mit275 located on mouse chromosomes 4 and 6, respectively, near the isa and ipd loci (left and center) and PCR analysis testing for the presence of the Thy1-CFP genetic construct (right) in CFP-D2, Thy1-CFP, and D2 mice. Expected band sizes are 204 bp for D2 and 160 bp for C57BL6/J for the isa locus, 119 bp for D2 and 125 bp for C57BL6/J for the ipd locus, and 173 bp for Thy1-CFP transgenics and 324 bp for nontransgenics (D2).

Microsatellite marker analysis, near the isa and ipd loci, which include the genetic mutations that lead to iris stromal atrophy and pigment dispersion and contribute to the glaucomatous phenotype in the D2 mouse (Chang et al., Reference Chang, Smith, Hawes, Anderson, Zabaleta, Savinova, Roderick, Heckenlively, Davisson and John1999), was used to provide host-congenic genetic comparisons in order to select the progeny most genetically similar to the D2 strain for the next round of breeding (Fig. 1). Animals homozygous for the D2 alleles at both loci develop increased IOP and glaucomatous ganglion cell loss (Chang et al., Reference Chang, Smith, Hawes, Anderson, Zabaleta, Savinova, Roderick, Heckenlively, Davisson and John1999; Libby et al., Reference Libby, Anderson, Pang, Robinson, Savinova, Cosma, Snow, Wilson, Smith, Clark and John2005; Howell et al., Reference Howell, Libby, Marchant, Wilson, Cosma, Smith, Anderson and John2007). Concurrently, the genotypic inclusion of the Thy1-CFP construct was determined for all progeny using PCR (Fig. 1). PCR products were sequenced to confirm identity. A detailed microsatellite marker panel that distinguishes between DBA/2 and 129/C57BL/6 genetic backgrounds was performed by Charles River Laboratories on a N10 CFP-D2 mouse, determining 99.5% D2 congenicity (see Materials and methods and Supplemental Material). The target 99.9% D2 congenicity is expected currently in our CFP-D2 mouse colony, which is in the N14 generation.
CFP expression in the CFP-D2 mouse line
The pattern of CFP expression in transverse sections from a 3-week-old CFP-D2 retina appeared similar to previous studies of the Thy1-CFP C57BL/6J retina (Raymond et al., Reference Raymond, Vila, Huynh and Brecha2008). The CFP-D2 retina is characterized by the prominent expression of CFP fluorescence in the inner retina, in numerous cell bodies in the GCL, some weakly fluorescent small cell bodies in the INL and GCL, axons in the fiber layer, and dendrites in the inner plexiform layer (IPL) in all retinal regions (Fig. 2). CFP-containing processes were observed in all laminae of the IPL, and CFP-containing axons were in the fiber layer, optic nerve head, and optic nerve (Fig. 2B). Most large and medium-sized CFP-containing cell bodies were weakly and strongly fluorescent, while the smallest cell bodies were weakly CFP fluorescent.
Transverse sections through the (A) retina and (B) optic nerve head and optic nerve showing CFP-fluorescent ganglion cells in a 3-week-old N6 CFP-D2 retina. CFP expression is in ganglion cell bodies in the GCL; processes in the IPL; and axons in the fiber layer, optic nerve head, and optic nerve. Scale bar (A), 30 μm. Scale bar (B), 45 μm. OPL, outer plexiform layer; INL, inner nuclear layer; IPL, inner plexiform layer; GCL, ganglion cell layer.

CFP expression in a wholemount preparation from a 3-month-old CFP-D2 retina appeared similar to previous studies of the Thy1-CFP retina (Raymond et al., Reference Raymond, Vila, Huynh and Brecha2008), with numerous CFP-fluorescent cell bodies in the GCL spanning the entire retinal surface (Fig. 3A). The somal diameter of CFP-expressing cells in the GCL averaged 11.70 ± 2.73 μm (N = 250) and ranged from 6.03 to 19.87 μm, while the somal diameter in the INL averaged 7.16 ± 0.95 μm (N = 50) and ranged from 6.09 to 9.97 μm (Fig. 3B). The density of CFP-expressing cells in the GCL ranged from 1497 ± 183 to 2912 ± 250 cells/mm2 along the dorsoventral axis from peripheral to central retina, and from 1978 ± 214 to 2695 ± 272 cells/mm2 along the nasotemporal axis, in retinal whole mount preparations from 2-month-old N4–N9 female CFP-D2 mice (Fig. 3C). Analyses of variance comparisons of cell densities obtained from each of the five retinal wholemounts in the nasal midperipheral GCL (2398 ± 212 cells/mm2), 1.5 mm from the optic nerve head, indicate that there is no significant variability in the number of CFP-expressing cells between individual mice (P < 0.05).
(Color online) (A) CFP expression in a whole mount of a N4 generation CFP-D2 mouse retina at 3 months of age. Inset represents a high power confocal scan through the GCL. The retina is characterized by the extensive expression of CFP in fluorescent ganglion cell bodies in all retinal regions. Scale bar (A), 500 μm. (B) Average somal diameters of CFP-expressing cells in the GCL and INL. The somal diameter in the GCL averaged 11.70 ± 2.73 μm (N = 250). The somal diameter in the INL averaged 7.16 ± 0.95 μm (N = 50). (C) Average density of CFP-expressing cells in the GCL along the dorsoventral and nasotemporal axes of five retinal wholemounts from five different 2-month-old CFP-D2 transgenic mice. Experiments in (B) and (C) used N4–N9 CFP-D2 mouse retinas.

These findings agree with previous analyses of the Thy1-CFP retina (Raymond et al., Reference Raymond, Vila, Huynh and Brecha2008) and suggest that most ganglion cells express CFP.
Neurochemical characterization of CFP expression in the GCL and INL
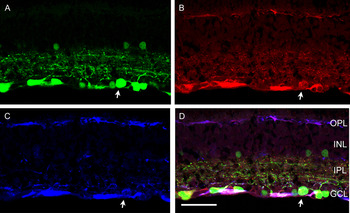
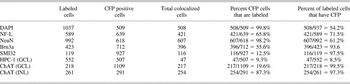
To confirm that CFP expression is localized primarily in ganglion cells, double- and triple-label immunohistochemical studies were performed in transverse sections and whole mount preparations from 3-month-old CFP-D2 retinas with antibodies to previously characterized ganglion cell neurochemical markers NF-L, NeuN, Brn 3a, and SMI 32 (Figs. 4 and 5, Table 1). Neurofilaments are neuronal cytoskeletal components that are widely expressed in ganglion cells and their axons (Ruiz-Ederra et al., Reference Ruiz-Ederra, Garcia, Hicks and Vecino2004). In the mammalian retina, NF-L antibodies immunolabel approximately 90% of all ganglion cells (Drager et al., Reference Drager, Edwards and Barnstable1984; Kong & Cho, Reference Kong and Cho1999; Ruiz-Ederra et al., Reference Ruiz-Ederra, Garcia, Hicks and Vecino2004). NF-L immunolabeling appeared as previously described, with immunofluorescence in ganglion cell somata in the GCL, dendrites throughout all laminae of the IPL, and axons in fiber bundles in the nerve fiber layer and optic nerve head (Figs. 4B and 5B). Colocalization of NF-L immunoreactivity with CFP expression in 65.8% of CFP-expressing cells in the GCL indicates that the majority of CFP-expressing cells in the CFP-D2 retina are ganglion cells (Table 1).
(Color online) Transverse section of a 3-month-old CFP-D2 retina showing the colocalization of CFP fluorescence with NF-L and SMI32 immunoreactivities in ganglion cells. (A) CFP-expressing ganglion cells in a 3-month-old CFP-D2 retina. (B) Same section as in (A) labeled with NF-L, a ganglion cell marker. (C) Same section as in (A) labeled with SMI32, a specific cell marker of large ganglion cells. (D) Bright CFP expression colocalizes with NF-L and SMI32 immunoreactivities in ganglion cells. Arrow indicates a ganglion cell body containing CFP, NF-L, and SMI 32 immunoreactivities. Scale bar, 60 μm. OPL, outer plexiform layer; INL, inner nuclear layer; IPL, inner plexiform layer; GCL, ganglion cell layer.

(Color online) Whole mount of a 3-month-old CFP-D2 retina showing the colocalization of CFP fluorescence with NF-L and NeuN immunoreactivities in ganglion cells in the GCL. (A) CFP-expressing ganglion cells in a 3-month-old CFP-D2 retina. (B) Same section as in (A) labeled with NF-L, a ganglion cell marker. (C) Same section as in (A) labeled with NeuN, a ganglion cell marker. (D) Bright CFP expression colocalizes with NF-L and NeuN immunoreactivities in ganglion cells. Arrows indicate ganglion cells containing CFP, NF-L, and NeuN immunoreactivities. Scale bar, 35 μm.

Colocalization summary of CFP with DAPI, the ganglion cell markers NF-L, NeuN, Brn3a, SMI32, and the amacrine cell markers HPC-1 and ChAT in the GCL and INL of the 3-month-old CFP-D2 mouse retina (N6-N12)

Antisera to NeuN, a neuron-specific nuclear protein, have been extensively used for identifying retinal ganglion cells. NeuN immunoreactivity was localized to numerous somata in the GCL and appeared as previously reported in the mammalian retina (Wolf et al., Reference Wolf, Buslei, Schmidt-Kastner, Schmidt-Kastner, Pietsch, Wiestler and Blumcke1996; Wang et al., Reference Wang, Tay and Ng2000, Reference Wang, Ng and Tay2005; Canola et al., Reference Canola, Angenieux, Tekaya, Quiambao, Naash, Munier, Schorderet and Arsenijevic2007; Dijk et al., Reference Dijk, Bergen and Kamphuis2007) (Fig. 5C). CFP expression colocalized with NeuN immunoreactivity in 98.2% of CFP-expressing cells in the GCL (Table 1). In addition, antibodies to Brn3a, a POU domain transcription factor, have also been extensively used in studies to label ganglion cells (Xiang et al., Reference Xiang, Zhou, Macke, Yoshioka, Hendry, Eddy, Shows and Nathans1995; Quina et al., Reference Quina, Pak, Lanier, Banwait, Gratwick, Liu, Velasquez, O’Leary, Goulding and Turner2005). Brn3a immunoreactive nuclei were numerous in the GCL and 55.6% of the CFP cells in the GCL contained Brn3a (Table 1). Nearly all SMI32-immunoreactive cells (97.5%) in the GCL contained CFP (Fig. 4). SMI32 is a preferentially selective marker for large α-ganglion cells (Drager & Hofbauer, Reference Drager and Hofbauer1984). These data show that CFP expression in the GCL is primarily localized to ganglion cells and indicate that ganglion cells in the CFP-D2 retina can be reliably identified based on their prominent expression of CFP.
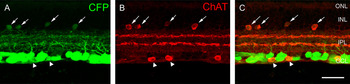
Previous studies that characterized CFP expression in the Thy1-CFP transgenic mouse showed that weakly CFP-expressing small somata in the proximal INL and GCL were cholinergic amacrine and displaced amacrine cells (Raymond et al., Reference Raymond, Vila, Huynh and Brecha2008). Therefore, we used antibodies against the neurochemical markers HPC-1 (syntaxin 1a) and choline acetyltransferase (ChAT), which immunolabel amacrine and displaced amacrine cells and the cholinergic amacrine cell population, respectively (Barnstable et al., Reference Barnstable, Hofstein and Akagawa1985; Inoue et al., Reference Inoue, Obata and Akagawa1992; Inoue & Akagawa, Reference Inoue and Akagawa1993; Kang et al., Reference Kang, Ryu, Kim, Oh and Chun2004). HPC-1 immunofluorescence was localized to a dense plexus of processes throughout all laminae of the IPL and numerous amacrine and displaced amacrine cell somata in the proximal INL and GCL. In the GCL, 9.3% of the CFP-expressing cells colocalized HPC-1 immunoreactivity (Table 1). ChAT immunoreactivity was localized to amacrine and displaced amacrine cell bodies distributed in the INL and GCL and their processes that narrowly stratified in laminae 2 and 4 of the IPL (Fig. 6). Weak CFP expression was visualized in most ChAT immunoreactive somata in the INL and GCL and in ChAT immunoreactive processes in the IPL. About 20% of CFP-expressing cells in the GCL contain ChAT immunoreactivity. These data indicate that most CFP expression in amacrine cells is localized to the cholinergic amacrine cell population.
(Color online) Transverse section of a 3-month-old CFP-D2 retina showing the colocalization of CFP fluorescence with ChAT immunoreactivity in cholinergic amacrine and displaced amacrine cells in the INL and GCL, respectively. (A) CFP-expressing cells in a 3-month-old CFP-D2 retina. (B) Same section as in (A) labeled with ChAT, a cholinergic amacrine and displaced amacrine cell marker. (C) Weakly CFP-expressing small somata colocalize with ChAT immunoreactivity in the INL (arrows) and GCL (arrowheads). Scale bar, 35 μm.

Glaucomatous phenotype in CFP-D2 retinas
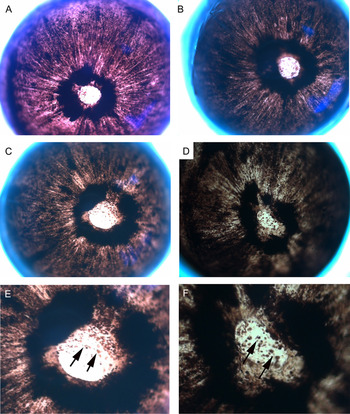
Iris disease progression in D2 mice includes iris stromal atrophy, transillumination defects, and progressive depigmentation with abnormal dispersal of iris pigment into the anterior chamber (Libby et al., Reference Libby, Anderson, Pang, Robinson, Savinova, Cosma, Snow, Wilson, Smith, Clark and John2005). Evaluations of CFP-D2 mouse eyes at 10 and 12 months of age indicate that similar age-related changes occur in this mouse line (Schuettauf et al., Reference Schuettauf, Rejdak, Walski, Frontczak-Baniewicz, Voelker, Blatsios, Shinoda, Zagorski, Zrenner and Grieb2004; Libby et al., Reference Libby, Anderson, Pang, Robinson, Savinova, Cosma, Snow, Wilson, Smith, Clark and John2005). For example, low power light microscope images show iris disease indicative of D2 phenotype, including iris stromal atrophy, depigmentation, and subsequent dispersal of pigment in the anterior chamber (Fig. 7).
(Color online) Iris disease in a 10-month-old D2 eye (A), a 10-month-old CFP-D2 eye (B), and two 12-month-old CFP-D2 eyes (C and D). (E and F) High magnification of the images in (C) and (D) showing pigment dispersion and iris atrophy. Individual clumps of pigment are visible across the surface of the iris (arrows).

Studies assessed ganglion cell loss and optic nerve head damage in the retinas of 9-month-old N6–N12 CFP-D2 mice in transverse sections stained with hematoxylin and eosin (H&E; Fig. 8). Consistent with previous studies of the D2 line (Schuettauf et al., Reference Schuettauf, Rejdak, Walski, Frontczak-Baniewicz, Voelker, Blatsios, Shinoda, Zagorski, Zrenner and Grieb2004; Libby et al., Reference Libby, Anderson, Pang, Robinson, Savinova, Cosma, Snow, Wilson, Smith, Clark and John2005), we observed thinning of the fiber layer and damage to the optic nerve and optic nerve head cupping (Fig. 8A). The IPL near the optic nerve head showed a 33.1 ± 8% reduction in width when compared to 3-month-old D2 retina and no apparent differences when compared to age- and sex-matched D2 retina with severe glaucomatous damage (Fig. 8). There is a 41.2 ± 4% reduction in the number of cell nuclei in the CFP-D2 line compared to 3-month-old D2 retinas and a 43.7 ± 12% reduction in the number of cell nuclei when compared to age-matched nonglaucomatous D2 retinas. Cell nuclei counts were made in 0.5 mm lengths with their origin at the optic nerve head. In fact, in the most damaged areas, the remaining cells in the GCL had small nuclei characteristic of displaced amacrine cells. In addition, there was thinning of the GCL and NFL, as well as extensive optic nerve head atrophic excavation. All these findings are indicative of glaucomatous neurodegeneration in the CFP-D2 mouse line (Libby et al., Reference Libby, Anderson, Pang, Robinson, Savinova, Cosma, Snow, Wilson, Smith, Clark and John2005).
(Color online) Transverse sections through the optic nerve head (A–C) and central retina (D–F) of a 9-month-old CFP-D2 (A and D), 9-month-old glaucomatous D2 (B and E), and a 3-month-old nonglaucomatous D2 (C and F), showing neurodegeneration of the nerve fiber layer, optic nerve head cupping, and ganglion cell death in the affected retinas (A, B, D, and E) but not in the young D2 retina (C, F). Scale bar, 100 μm. (G) Bar graph showing the reduction in the size of the IPL of 9-month-old CFP-D2 when compared to 3-month-old D2, 9-month-old nonglaucomatous D2, and 9-month-old glaucomatous D2 retinas. (H) Bar graph showing the reduction in the number of nuclei in the GCL of 9-month-old CFP-D2 when compared to 3-month-old D2, 9-month-old nonglaucomatous D2, and 9-month-old glaucomatous D2 retinas.

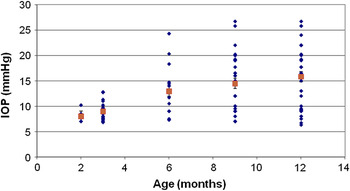
Elevated IOP is often used as an indicator of glaucomatous changes in the D2 mouse eye (Libby et al., Reference Libby, Anderson, Pang, Robinson, Savinova, Cosma, Snow, Wilson, Smith, Clark and John2005; Inman et al., Reference Inman, Sappington, Horner and Calkins2006). IOP measurements were obtained from CFP-D2 mice at 2, 3, 6, 9, and 12 months of age using a commercially available murine rebound Tonometer (Colonial Medical Supply Co., Franconia, NH; Reitsamer et al., Reference Reitsamer, Kiel, Harrison, Ransom and McKinnon2004). Fig. 9 represents a total of 120 average IOP values (n = 26, 2 months; n = 26, 3 months; n = 24, 6 months; n = 28, 9 months; n = 16, 12 months). With the exception of the 2- and 3-month-old time points, which were obtained from the same group of animals, measurements are from individual CFP-D2 animal eyes to minimize any effect of corneal abrasion from tonometer readings on disease development and progression. Overall, the measurements for CFP-D2 mice were within the elevated range of IOP values (7–22 mm Hg) reported for D2 animals (Libby et al., Reference Libby, Anderson, Pang, Robinson, Savinova, Cosma, Snow, Wilson, Smith, Clark and John2005; Inman et al., Reference Inman, Sappington, Horner and Calkins2006). In our cohort of animals, elevated IOP was initially detected at the 6-month time point (12.95 ± 1.39 mm Hg) and IOP remained elevated in some mice at the 12-month time point (18.11 ± 1.27 mm Hg).
(Color online) Age-related increase in IOP in CFP-D2 mice. A total of 120 average IOP values are shown (blue diamonds; n = 26 2 months, SEM = 0.35; n = 26 3 months, SEM = 0.41; n = 24 6 months, SEM = 0.49; n = 28 9 months, SEM = 1.07; n = 16 12 months, SEM = 0.78; N = 120 total). Red squares represent average IOP ± SEM. Using our IOP measurement methodology, elevated average IOP was detected at the 6-month time point and remained elevated at the 12-month time point in some animals.

CFP as an indicator of ganglion cell loss in CFP-D2 retinas
To confirm that CFP fluorescence could accurately represent ganglion cell survival or death in aged and glaucomatous CFP-D2 retinas, we evaluated several wholemount preparations from 12-month-old N9 CFP-D2 female mice. Since retinal ganglion cell loss in the D2 retina is variable and asynchronous (Nickells, Reference Nickells1996; Jakobs et al., Reference Jakobs, Libby, Ben, John and Masland2005; Libby et al., Reference Libby, Anderson, Pang, Robinson, Savinova, Cosma, Snow, Wilson, Smith, Clark and John2005), we determined CFP-expressing cell densities in the GCL of several entire wholemount preparations as described in the methods section. Three examples of nondamaged, moderately damaged, and severely damaged retinas are shown in Fig. 10G–10I. Loss of retinal ganglion cells was confirmed using NF-L and NeuN immunolabeling and DAPI staining.
(Color online) Loss of CFP-expressing retinal ganglion cells in the GCL of the CFP-D2 retina. (A–F) Confocal scans of retinal wholemounts from 12-month-old CFP-D2 mice showing unaffected (A–C) and severely affected (D–F) retinas immunostained with antibodies to NF-L. Representative scans were obtained from the midperipheral retina, 1.5 mm in the nasal direction along the nasotemporal axis. (A) CFP-expressing ganglion cells and displaced amacrine cells in the GCL. Weak CFP-expressing cells are cholinergic amacrine cells and have been distinguished based on localization, size, and expression of ChAT. (B) Same scan as in (A) labeled with NF-L, a ganglion cell-specific marker. (C) Same scan as in (A) showing CFP expression and NF-L immunoreactivity superimposed. Most NF-L labeled ganglion cells also express CFP. (D) CFP-expressing ganglion cells and displaced amacrine cells in the GCL of a severely affected section of the retina. Extensive ganglion cell loss is evident in this retinal area. Most CFP-expressing cells that remain are small weakly CFP-expressing cholinergic displaced amacrine cells. (E) Same scan as in (D) labeled with NF-L shows the few remaining ganglion cells. (F) Same scan as in (D), with CFP expression and NF-L immunoreactivity superimposed, shows only a few (four) surviving ganglion cells. Scale bar, 40 μm. (G–I) Density maps of CFP-expressing somata in the GCL of 3 retinal wholemounts from 12-month-old CFP-D2 mice showing unaffected (G), moderately affected (H), and severely affected (I) retinas. (J) Comparison of CFP cell densities from five regions (230 × 230 μm) from three severely damaged retinas and five matched regions from three undamaged retinas (a total of 30 fields).

CFP cell densities from five midperipheral sections of three severely affected, 12-month-old CFP-D2 retinas (a total of 15 230 × 230 μm sections) were compared to five grid-matched sections from three nonaffected, 12-month-old CFP-D2 retinas, showing a substantial loss of CFP-expressing cells (66 ± 7%). These findings illustrate a loss of CFP-ganglion cells in some retinal regions, suggesting an advanced glaucomatous phenotype in these animals. These findings are consistent with a report of about 60% overall loss of ganglion cells at 12 months in the D2 line (Schuettauf et al., Reference Schuettauf, Quinto, Naskar and Zurakowski2002).
Discussion
This report details the development of a novel CFP-D2 mouse line, which exhibits the neurodegenerative glaucomatous phenotype of the D2 mouse with aging and contains numerous fluorescent retinal ganglion cells that can be readily identified. This novel mouse line was generated by the congenic breeding of a Thy1-CFP mouse line (#23; Jackson Laboratory; Feng et al., Reference Feng, Mellor, Bernstein, Keller-Peck, Nguyen, Wallace, Nerbonne, Lichtman and Sanes2000) and the D2 mouse line, and it is currently in the N14 generation. Microsatellite marker analysis confirmed overall D2 congenicity in each generation near the genetic loci that contribute to the neurodegenerative phenotype (Chang et al., Reference Chang, Smith, Hawes, Anderson, Zabaleta, Savinova, Roderick, Heckenlively, Davisson and John1999), and a more detailed microsatellite marker analysis of an N10 animal confirmed greater than 99% congenicity, indicating that the animal line is predominantly D2 congenic. Evaluations of the ocular appearance of 9- and 12-month-old CFP-D2 animals showed a glaucomatous phenotype, including iris stromal atrophy, pigment dispersion, elevated IOP, extensive ganglion cell death, and optic nerve atrophy, further substantiating the overall D2-like phenotype of the CFP-D2 mice. Elevated IOP is often used as an indicator of glaucomatous changes in the D2 mouse (Libby et al., Reference Libby, Anderson, Pang, Robinson, Savinova, Cosma, Snow, Wilson, Smith, Clark and John2005), and IOP values for the CFP-D2 eyes were within the range of IOP values reported for D2 animals. Quantitative studies of ganglion cell loss indicate that glaucomatous changes in the CFP-D2 mice are comparable to those reported for D2 mice (Schuettauf et al., Reference Schuettauf, Rejdak, Walski, Frontczak-Baniewicz, Voelker, Blatsios, Shinoda, Zagorski, Zrenner and Grieb2004; Jakobs et al., Reference Jakobs, Libby, Ben, John and Masland2005; Libby et al., Reference Libby, Anderson, Pang, Robinson, Savinova, Cosma, Snow, Wilson, Smith, Clark and John2005).
In CFP-D2 mice, the pattern of CFP expression is similar to that described for the original Thy1-CFP C57BL/6 line (#23; Feng et al., Reference Feng, Mellor, Bernstein, Keller-Peck, Nguyen, Wallace, Nerbonne, Lichtman and Sanes2000), with strongly fluorescent cell bodies in the GCL; weakly fluorescent small cell bodies in the GCL and INL; dendrites and processes in the IPL; and axons in the fiber layer, optic nerve head, and optic nerve. Immunohistochemical studies with antibodies to the well-characterized ganglion cell markers NF-L, NeuN, Brn 3a, and SMI 32 confirmed strong CFP expression in most ganglion cells, including large ganglion cells. The small weakly CFP-fluorescent cells in the GCL and INL were cholinergic amacrine cells, based on their expression of HPC-1 (Barnstable et al., Reference Barnstable, Hofstein and Akagawa1985) and ChAT immunoreactivity (Voigt, Reference Voigt1986). Together, these observations indicate that ganglion cells in CFP-D2 mice can be accurately identified and imaged in vivo, in tissue and in dissociated culture based on their level of CFP expression.
Other groups have reported that Thy1 mRNA and Thy1 protein levels decrease in retinal ganglion cells well before cell death occurs, in several models of retinal damage, including elevated IOP and optic nerve crush (Schlamp et al., Reference Schlamp, Johnson, Li, Morrison and Nickells2001; Huang et al., Reference Huang, Fileta, Guo and Grosskreutz2006). In the CFP-D2 retina, we have observed stable Thy1-CFP expression beyond 12 months of age, in animals with or without elevated IOP or a history of elevated IOP. Loss of CFP expression was usually indicative of ganglion cell death and was concurrent with the absence of NF-L and/or NeuN immunoreactivity and DAPI nuclear labeling in wholemount preparations. It is possible that CFP and Thy1 expression, although driven by comparable promoter sequences (Feng et al., Reference Feng, Mellor, Bernstein, Keller-Peck, Nguyen, Wallace, Nerbonne, Lichtman and Sanes2000), is subject to different posttranscriptional and translational processing. This could differentially affect CFP and Thy1 mRNA and protein stability, resulting in differential rates of loss from injured neurons (Day & Tuite, Reference Day and Tuite1998). Furthermore, moderate changes in Thy1-CFP expression may not be readily observed since CFP expression in ganglion cells is usually very robust. Our empirical observations indicate that CFP expression persists in CFP-D2 retinas past 12 months of age, and the loss of CFP expression is indicative of retinal ganglion cell death.
As previously reported for D2 mice, neuronal cell death in the CFP-D2 retinas seems limited to retinal ganglion cells and does not appear to affect other cell populations, including displaced amacrine cells in the GCL (Schuettauf et al., Reference Schuettauf, Rejdak, Walski, Frontczak-Baniewicz, Voelker, Blatsios, Shinoda, Zagorski, Zrenner and Grieb2004; Jakobs et al., Reference Jakobs, Libby, Ben, John and Masland2005; Libby et al., Reference Libby, Anderson, Pang, Robinson, Savinova, Cosma, Snow, Wilson, Smith, Clark and John2005; Moon et al., Reference Moon, Kim, Gwon, Park, Kang, Lim, Choi and Chun2005). In fact, ChAT immunolabeled “starburst” displaced amacrine cells, which show weak CFP fluorescence, persist in normal densities in areas severely depleted of ganglion cells (Fig. 10). Additionally, evaluations of several aged CFP-D2 whole mount retinas suggest that ganglion cell loss occurs in irregular “patches,” with some regions severely affected, while other regions retain a nearly normal appearance (Fig. 10). At this point, it is unknown what molecular and cellular mechanisms initiate and sustain the asynchronous retinal ganglion cell death and whether the size or shape of the “patches” covaries with IOP, age, or gender. Other studies have reported the presence of fan-shaped sectors of degenerating ganglion cells, radiating from the optic nerve (Nickells, Reference Nickells1996; Jakobs et al., Reference Jakobs, Libby, Ben, John and Masland2005; Soto et al., Reference Soto, Oglesby, Buckingham, Son, Roberson, Steele, Inman, Vetter, Horner and Marsh-Armstrong2008), supporting the hypothesis that ganglion cell death is a result of optic nerve injury due to elevated IOP and the compression of the optic nerve at the lamina cribrosa in humans or its equivalent in rodents. Although these groups all described sectorial changes in the D2 retina with age, we have not observed a regular or distinct pattern in our wholemounts even for extremely aged animals.
We did not observe any preferential degeneration of specific ganglion cell types based on size, morphology, or stratification (Doi et al., Reference Doi, Uji and Yamamura1995; Sun et al., Reference Sun, Li and He2002; Kong et al., Reference Kong, Fish, Rockhill and Masland2005). In fact, severely damaged retinal areas were often completely devoid of ganglion cells (see Fig. 10). However, in retinal areas with moderate damage, we observed unusually large cells, with pronounced primary processes, as visualized by both CFP fluorescence and especially by NF-L immunolabeling. These observations agree with a report showing no selective loss of large mouse α-type ganglion cells or of ganglion cells containing melanopsin in D2 retinas (Libby et al., Reference Libby, Anderson, Pang, Robinson, Savinova, Cosma, Snow, Wilson, Smith, Clark and John2005) but differ from previous studies of the human retina reporting that large ganglion cells are selectively vulnerable in glaucoma (Quigley, Reference Quigley1995, Reference Quigley1999). It is likely that morphological changes due to disease and injury include alterations in cellular morphology, including somal shrinkage or swelling. However, the CFP label still appears to be a reliable ganglion cell marker in these degenerate retinas as the intensity difference in CFP expression is maintained in the degenerate condition. In fact, as shown in Fig. 10, in severely damaged retinas, CFP expression in ganglion cells is even more readily distinguishable from the weak CFP expression in cholinergic amacrine cells (see Fig. 10D).
The CFP-D2 mouse line promises to be a valuable new tool in the study of the neurodegenerative death of ganglion cells in glaucoma. CFP imaging of ganglion cells in vivo offers several advantages to classical methods used to label ganglion cells. For example, many technical problems inherent with retrograde labeling methods can be avoided. A major problem in glaucoma models is that retrograde axonal transport is compromised due to pressure on the optic nerve head or constriction of the optic nerve (Schuettauf et al., Reference Schuettauf, Rejdak, Walski, Frontczak-Baniewicz, Voelker, Blatsios, Shinoda, Zagorski, Zrenner and Grieb2004; Jakobs et al., Reference Jakobs, Libby, Ben, John and Masland2005). Furthermore, retrograde tracer injections into the superior colliculus often fail to cover the entire projection field of retinal ganglion cells and miss some ganglion cells (Weber, Reference Weber1985). In addition, ganglion cell projections to the central visual nuclei are difficult to target with retrograde tracer injections. A drawback of immunohistochemical methods, such as neurofilament immunohistochemistry, is often the incomplete labeling of the entire ganglion cell (Ruiz-Ederra et al., Reference Ruiz-Ederra, Garcia, Hicks and Vecino2004; Coombs et al., Reference Coombs, van der List, Wang and Chalupa2006). In addition, CFP expression in individual cells that extend throughout the cytoplasm allows for the visualization of changes in dendritic and axonal architecture without additional treatments. Finally, a major advantage of CFP-expressing retinal ganglion cells is that ganglion cell visualization does not require tissue fixation and does not affect cellular homeostasis (Feng et al., Reference Feng, Mellor, Bernstein, Keller-Peck, Nguyen, Wallace, Nerbonne, Lichtman and Sanes2000), allowing for in vivo or dissociated culture studies.
Acknowledgments
The authors would like to thank Arlene A. Hirano, Ph.D., and Catia Sternini, M.D., for their comments on the manuscript, as well as all members of the Brecha Lab for their assistance. Financial support was obtained from a UCLA Oppenheimer Grant, NIH EY 04067, a NIH Minority Supplement Fellowship, a VA Merit Award, and a VA Senior Scientist Award. Grant Support: NEI EY04067, a NIH Minority Supplement Fellowship, VA Merit Review, VA Senior Career Scientist funds and a UCLA Oppenheimer Grant.