





Introduction
Carbapenemase-producing Enterobacterales (CPE) have emerged as a major healthcare-associated threat worldwide, combining multidrug resistance with gastrointestinal colonization, transmission within healthcare settings, and persistence in hospital reservoirs. Reference Alvisi, Curtoni and Fonnesu1,Reference Aung, Kanagasabai and Koh2 Colonized patients may remain asymptomatic for prolonged periods up to 2 years while serving as an unrecognized reservoir for transmission, Reference Marimuthu, Venkatachalam and Koh3,Reference Ma, Lai and Chuang4 making early detection a key component of infection prevention and control strategies. Reference Jenkins, Auckland and Chadwick5 Accordingly, the World Health Organization (WHO) and other infection prevention authorities recommend early recognition of carbapenem-resistant organisms through active surveillance combined with transmission-based precautions in acute care facilities. Reference Organization.6–8
Testing fecal specimens (stools and rectal swabs) is the most commonly used method for detecting gastrointestinal carriage of CPE, as the intestinal tract is the principal site of Enterobacterales colonization. Reference Nordmann, Gniadkowski and Giske9,Reference Curiao, Baquero, Coque and Cantón10 Screening strategies vary widely across institutions and may include culture-based methods, molecular assays, or combined algorithms, each with different trade-offs in sensitivity, turnaround time, labor, and cost. Reference Skally, Cafferkey and Russell11,Reference Pham, Nguyen and My12 Admission screening can identify imported carriers and inform isolation and cohorting strategies; however, its yield depends strongly on local prevalence, patient risk profile, and the diagnostic method used. Reference Yan, Sun, Xu and Huang13,Reference Otter, Dyakova and Bisnauthsing14
Although screening may reduce transmission, its economic value is not consistent across settings. Previous modeling studies suggest that universal or targeted screening can be cost-effective in some hospitals, but results are highly sensitive to prevalence, test performance, and assumptions regarding transmission dynamics. In low-prevalence settings, targeted strategies may be more efficient than universal screening, whereas broader screening may be justified in higher-risk populations. Reference Lapointe-Shaw, Voruganti, Kohler, Thein, Sander and McGeer15–Reference Pople, Kypraios and Donker17 These findings highlight the need for local, real-world economic evaluations rather than reliance on assumptions derived from other healthcare systems.
In Hong Kong, the epidemiology of CPE has evolved over time, influenced by patient referral patterns, antimicrobial exposure, and infection control practices. Reference Cheng, Chan and Wong18,Reference Wong, Chan and Lam19 However, real-world evidence on the cost-effectiveness of CPE screening over an extended period using contemporaneous hospital data remains limited. We therefore performed a cost-effectiveness analysis of CPE screening in a university-affiliated tertiary hospital using real-world data from 2015 to 2024, with the aim of informing infection prevention policy, resource allocation, and future screening strategy.
Methods
Study setting and CPE screening
This study was conducted at Queen Mary Hospital, a 1,700-bed university-affiliated teaching hospital governed by the Hospital Authority, Hong Kong’s tax-funded public healthcare system, in which inpatient care is heavily subsidized, patients pay nominal flat fees rather than claiming insurance reimbursement, and hospitals are not financially penalized for healthcare-associated infections. Wards comprise predominantly shared multi-bed cubicles with limited single rooms. Fecal screening (stools or rectal swabs) for CPE followed institutional protocols: Reference Wong, Chiu and Ip20 admission screening, which shifted from risk-based screening (CPE colonization within one year, admission from local hospitals within three months, or hospitalization outside Hong Kong within one year) to universal screening; repeat screening during prolonged hospitalization; opportunistic screening of specimens submitted for Clostridioides difficile testing; and screening of epidemiologically linked contacts. Patients with CPE were placed under contact precautions and cohorted in shared cubicles or single rooms; bed closure was generally not required. Specimens were cultured on selective media for the detection of carbapenem-resistant Enterobacterales (CRE), as previously described. Reference Wong, Chan and Lam19 CRE isolates with carbapenemase production confirmed by in-house molecular testing, Xpert® Carba-R (Cepheid), or NG-Test CARBA 5 (NG Biotech), were classified as CPE. Reference Wong, Chiu and Ip20
Data source and study population
Demographic and clinical data for patients screened for CPE between January 1, 2015 and December 31, 2024 were retrieved from the Clinical Data Analysis and Reporting System (CDARS), an electronic health record database under the governance of the Hospital Authority, as previously described. Reference Wong, Chau and So21,Reference Wong, Chen and Chau22 Episodes without a recorded discharge date by December 31, 2024 were excluded. Admissions with an extreme length of stay exceeding 365 days were also excluded as outliers. Retrieved variables included age, sex, duration of stay in the general ward, high-dependency unit (HDU), or intensive care unit (ICU), specimen type, CPE laboratory results, and clinical outcomes, including discharge or death.
CPE-related laboratory testing episodes were defined as hospitalization episodes during which at least one fecal screening specimen or clinical culture was processed for CPE detection. To better reflect the screening workload, we also calculated the total number of screening tests performed, as multiple tests could be conducted during the same case of hospitalization. Reference Wong, Chiu and Ip20 Clinical CPE infection was defined as isolation of CPE from clinical specimens (e.g. blood, urine, or respiratory samples), whereas CPE colonization was defined as detection of CPE in fecal specimens from asymptomatic patients. To assess whether the death was associated with CPE infection, deduplication was performed at the patient level using hospital admission number. After deduplication, we analyzed the health outcomes using the most recent testing case and excluded the remaining ones if the patients had multiple admissions.
Model inputs for economic analysis
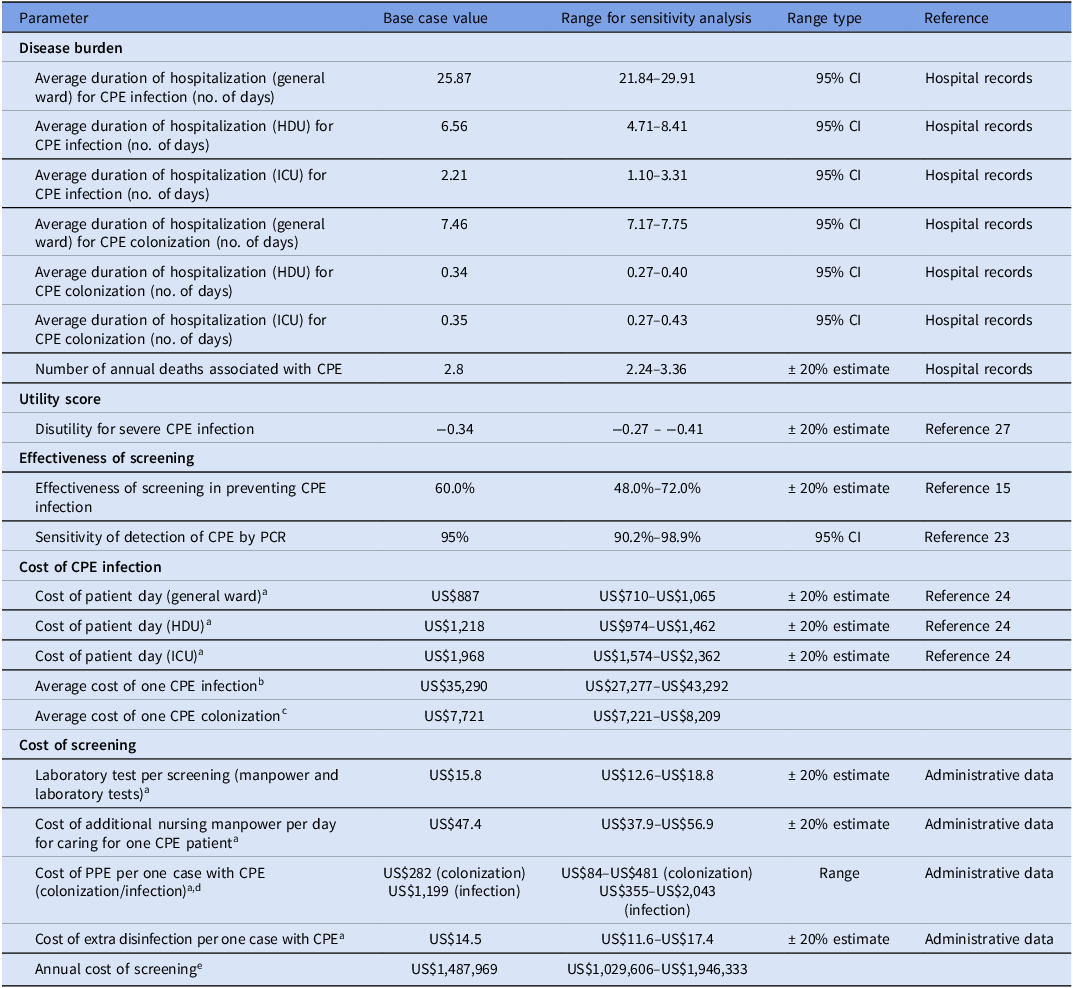
The parameters used in the economic analysis are summarized in Table 1. The average lengths of stay in the general ward, HDU, and ICU were derived from hospital records. For mortality attributable to CPE infection, all cases of CPE bacteremia were assumed to be infection-related. Patients with respiratory specimens positive for CPE were assessed on a case-by-case basis to determine attribution. In contrast, patients with CPE isolated from urine or wound specimens were considered unlikely to have died directly from CPE infection, with deaths more likely attributable to underlying comorbidities. The effectiveness of screening was based on a previous study demonstrating that universal screening of hospital inpatients reduced symptomatic CPE infections by 60%. Reference Lapointe-Shaw, Voruganti, Kohler, Thein, Sander and McGeer15 The sensitivity of polymerase chain reaction for CPE detection was obtained from the published literature. Reference Saliba, Karam-Sarkis and Zahar23 Unit costs for general ward, HDU, and ICU stays were obtained from the Gazette of the Government of the Hong Kong Special Administrative Region. 24 Costs of laboratory testing (manpower, reagents, and operational expenses) were obtained from hospital administrative records. Personal protective equipment (PPE) costs were calculated as the unit cost per PPE set (gown and gloves) multiplied by five care episodes per day and the mean length of stay per CPE case. Additional nursing manpower costs were estimated from the staff time required for donning and doffing PPE five times daily. Reference Sharma, Leal, Kim, Pearce, Pillai and Hollis25 Environmental disinfection costs were estimated based on the volume of disinfectant used for routine and terminal cleaning for each patient with CPE.
Parameters used in the cost-effectiveness analysis for carbapenemase-producing Enterobacterales (CPE) screening

Table 1. Long description
The table presents parameters used in the cost-effectiveness analysis for CPE screening, organized into several categories: Disease burden, Utility score, Effectiveness of screening, Cost of CPE infection, and Cost of screening. It has 25 rows and 5 columns. The columns are labeled Parameter, Base case value, Range for sensitivity analysis, Range type, and Reference. The table includes data on the average duration of hospitalization for CPE infection and colonization in different wards, the number of annual deaths associated with CPE, disutility for severe CPE infection, effectiveness of screening in preventing CPE infection, sensitivity of detection of CPE by PCR, costs of patient days in different wards, average costs of CPE infection and colonization, costs of screening including laboratory tests, additional nursing manpower, personal protective equipment, extra disinfection, and annual cost of screening. Each row provides specific values and ranges for these parameters, along with references to hospital records or other data sources.
Note. CI, confidence interval; HDU, high-dependency unit; ICU, intensive care unit.
a Costs were converted from HKD to USD using an exchange rate of US$1 = HK$7.8.
b Average cost of one CPE infection = Average duration of hospitalization (general ward) for one CPE infection x unit cost of general ward + average duration of hospitalization (HDU) for one CPE infection x unit cost of HDU + average duration of hospitalization (ICU) for one CPE infection x unit cost of ICU.
c Average cost of one CPE colonization = Average duration of hospitalization (general ward) for one CPE colonization x unit cost of general ward + average duration of hospitalization (HDU) for one CPE colonization x unit cost of HDU + average duration of hospitalization (ICU) for one CPE colonization x unit cost of ICU.
d Cost of PPE per one case with CPE = Unit cost per PPE set (gown and gloves) x 5 care episodes per day x mean length of stay per CPE case.
e Annual cost of screening = (Laboratory test cost per screening x annual number of screening tests) + (annual costs of additional nursing manpower, PPE, and extra disinfection for CPE-positive episodes).
Cost-effectiveness analysis
The economic evaluation was conducted from the healthcare provider-perspective, with all costs adjusted to 2024 values. The number needed to screen (NNS) was calculated by dividing the total number of screening episodes performed between 2015 and 2024 by the number of CPE cases averted during the study period. The cost of a single CPE infection was estimated by multiplying the unit cost of care in the general ward, HDU, or ICU per day by the corresponding mean length of stay among infected patients. Similarly, the cost of a single CPE colonization case was estimated using the mean length of stay among colonized patients. The total cost of the screening program was calculated as the sum of laboratory testing costs, additional staff time, PPE use, and environmental disinfection. Using the effectiveness of screening identified from literature, we estimated the annual number of CPE infections averted and compared the annual cost of CPE infection with and without the screening program.
The incremental cost-effectiveness ratio (ICER) for preventing CPE infection was calculated as the difference in annual CPE-related costs between the screening and non-screening scenarios divided by the number of CPE infections averted annually. Taking reference from a previous study on cost-effectiveness analysis of screening of carbapenem-resistant Enterobacteriaceae, Reference Ho, Ng, Ip and You26 the quality-adjusted life-years (QALYs) loss in each infected patient was calculated using the disutility value and duration of stay in HDU or ICU. The length of stay in an HDU or ICU for CPE infection was retrieved from hospital record. The utility loss of HDU or ICU (−0.34) was estimated from findings of a health-related quality of life study. Reference Ridley and Morris27 The QALY loss due to CPE-associated mortality was calculated using age at death attributable to CPE in our hospital records and age-specific life expectancy from the Census and Statistics Department life table. Reference Department.28 Lifetime QALYs gained were discounted at an annual rate of 3% to 2024. The cost per QALY gained was calculated by dividing the difference in costs between the screening and non-screening scenarios by the QALYs gained. Cost-effectiveness was interpreted with reference to the WHO threshold, where an ICER below the GDP per capita is considered highly cost-effective. 29 The GDP per capita in Hong Kong in 2024 [US$54,301 (US$1 = HK$7.8)] was retrieved for analysis. 30
Sensitivity analyses
One-way sensitivity analyses were performed for the NNS, ICER for preventing CPE infection, and cost per QALY gained by varying each parameter across the lower and upper limits shown in Table 1. For the average length of stay in the general ward, HDU, and ICU, 95% confidence intervals were used. For other parameters, ranges were obtained from the literature or set at ± 20% of the base-case value. Scenario-based sensitivity analyses were also performed using combinations of parameter values representing the most and least cost-effective situations in the model.
Statistical analysis
Statistical analyses of the CDARS data set were performed using R version 4.5.0, and economic modeling was conducted in Microsoft Excel 2021.
Results
Screening outcomes
From 2015 to 2024, 375,213 CPE-related laboratory testing episodes were recorded, comprising 447,745 screening tests, as shown in Figure 1. Of the 375,213 episodes, 10,046 (2.7%) were positive for CPE. Among these positive episodes, 390 (3.9%) were associated with clinical infection, whereas 9,656 (96.1%) represented colonization. Of the 390 clinical infections, 131 (33.6%) required care in the HDU or ICU.
Flow chart of screening outcomes for carbapenemase-producing Enterobacterales (CPE) by CPE-related laboratory episodes.

After patient-level deduplication, 149,965 individuals had undergone CPE testing in the microbiology laboratory (Figure 2). Among them, 3,628 patients (2.4%) were positive for CPE. A total of 153 patients had clinical infection, with a median age of 66 years (IQR: 55–77). Overall, 69 patients died, corresponding to an all-cause mortality rate of 45.1%. Of the 69 deaths, 27 occurred in patients with CPE bacteremia. One additional death was considered to be associated with CPE, with CPE detected in a tracheal aspirate.
Flow chart of screening outcomes for carbapenemase-producing Enterobacterales (CPE) according to patient count after deduplication.

Cost inputs and base-case analysis
The parameter estimates used in the cost-effectiveness analysis are shown in Table 1. The mean duration of hospitalization for CPE infection was 25.87 days in the general ward (95% CI 21.84–29.91), 6.56 days in HDU (95% CI 4.71–8.41), and 2.21 days in ICU (95% CI 1.10–3.31). For CPE colonization, the mean duration of hospitalization was 7.46 days in the general ward (95% CI 7.17–7.75), 0.34 days in HDU (95% CI 0.27–0.40), and 0.35 days in ICU (95% CI 0.27–0.43). Based on the unit costs of general ward, HDU, and ICU care, the estimated average cost of one CPE infection was US$35,290, with a range of US$27,277 to US$43,292, whereas that of one CPE colonization was US$7,721 (range: US$7,221 to US$8,209).
After adding the costs of laboratory testing, additional nursing manpower, PPE, and environmental disinfection, the annual cost of the CPE screening program was estimated at US$1,487,969, with a range of US$1,029,606 to US$1,946,333.
Cost-effectiveness results
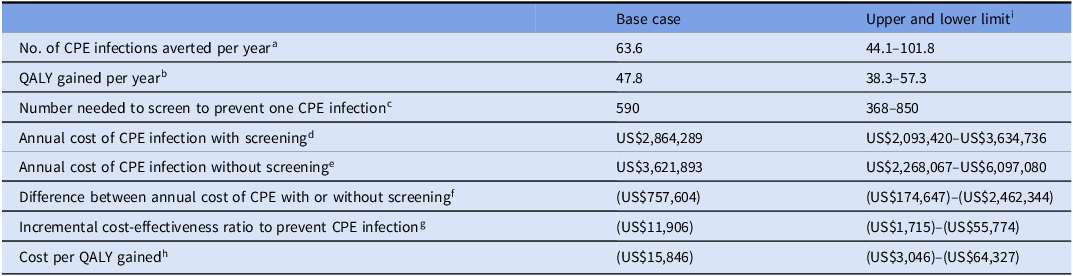
Based on the effectiveness estimates derived from the literature, the screening program was projected to avert 63.6 CPE infections per year (range: 44.1–101.8; Table 2). The annual QALY gained was estimated at 47.8 (range: 38.3–57.3). The NNS to prevent one CPE infection was 590 (range: 368–850). The estimated annual cost of CPE infection with screening was US$2,864,289 (range: US$2,093,420–US$3,634,736), compared with US$3,621,893 (range: US$2,268,067–US$6,097,080) without screening. Overall, the screening program was cost-saving with an annual amount of US$757,604 (range: US$174,647–US$2,462,344).
Summary of results in cost-effectiveness analysis for carbapenemase-producing Enterobacterales (CPE) screening

Table 2. Long description
The table presents the results of a cost-effectiveness analysis for CPE screening. It has 8 rows and 3 columns. The columns are labeled Base case, Upper and lower limit. The rows are labeled No. of CPE infections averted per year, QALY gained per year, Number needed to screen to prevent one CPE infection, Annual cost of CPE infection with screening, Annual cost of CPE infection without screening, Difference between annual cost of CPE with or without screening, Incremental cost-effectiveness ratio to prevent CPE infection, and Cost per QALY gained. Each row contains specific values and ranges for the respective metrics. The table provides a detailed comparison of the costs and effectiveness of CPE screening versus not screening.
Note. QALY, Quality-adjusted life-year.
a No. of CPE infections averted per year = Average no. of CPE infections detected per year / [(100% - effectiveness of screening) x sensitivity for detection of CPE] - average no. of CPE infections detected per year.
b QALY gained per year = Sum of age-specific life expectancy from the Census and Statistics Department life table - the age at death attributable to CPE, among all CPE-associated deaths, discounted at an annual rate of 3% + number of CPE cases requiring HDU/ICU care prevented x average duration of stay in HDU and ICU x (1 - disutility score due to severe CPE infection).
c Number needed to screen to prevent one CPE infection = Total number of screening episodes performed between 2015 and 2024 / the number of CPE cases averted during the study period.
d Annual cost of CPE infection with screening = Average cost of one CPE infection x average number of CPE infection detected per year + annual cost of screening.
e Annual cost of CPE infection without screening = Average cost of one CPE infection x (average number of CPE infections detected per year + average number of CPE infections averted per year).
f Difference between annual cost of CPE with or without screening = Annual cost of CPE infection with screening - annual cost of CPE infection without screening.
g Incremental cost-effectiveness ratio to prevent CPE infection = Difference between annual cost of CPE with or without screening / average number of CPE infections averted per year.
h Cost per QALY gained = Difference between annual cost of CPE with or without screening / average number of QALY gained per year.
i Upper and lower limit of each item (e.g. No. of CPE infections averted per year) is calculated based on the maximum and minimum value of all relevant parameters listed in Table 1 required for input into the corresponding formula.
Sensitivity analysis
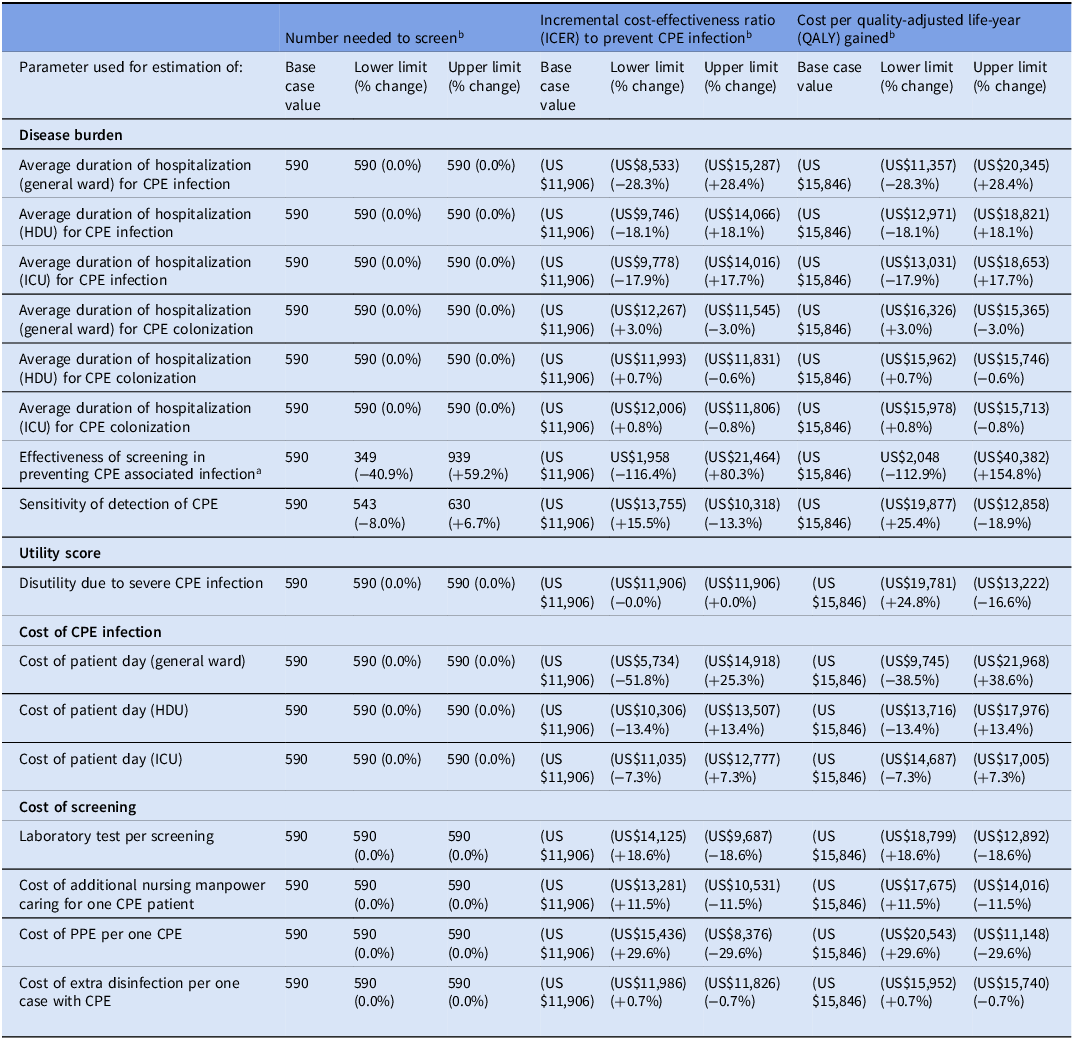
In one-way sensitivity analyses, the NNS was most influenced by the effectiveness of screening in preventing CPE infection, which changed the base-case estimate by −40.9% to + 59.2%, followed by the sensitivity of CPE detection, which changed the estimate by −8.0% to + 6.7% (Table 3).
One-way sensitivity analysis for cost-effectiveness analysis for carbapenemase-producing Enterobacterales (CPE) screening

Table 3. Long description
The table presents a one-way sensitivity analysis for the cost-effectiveness of screening for carbapenemase-producing Enterobacterales (CPE). It includes parameters related to disease burden, utility score, cost of CPE infection, and cost of screening. The table has 25 rows and 11 columns. Column headers are: Number needed to screen, Incremental cost-effectiveness ratio (ICER) to prevent CPE infection, and Cost per Quality Adjusted Life Years (QALY) gained. Each column has three sub-columns: Base case value, Lower limit (% change), and Upper Limit (% change). Row labels include parameters such as average duration of hospitalization for CPE infection and colonization in different wards, effectiveness of screening, sensitivity of detection, disutility due to severe CPE infection, cost of patient day in different wards, and cost of screening components. Each row provides values for the base case, lower limit, and upper limit of the number-needed-to-screen, incremental cost-effectiveness ratio, and cost per QALY gained. Notable trends include significant changes in the number-needed-to-screen and cost-effectiveness ratios based on the effectiveness of screening and sensitivity of detection.
a As screening effectiveness is the most influential factor in determining ICER and cost per QALY gained, we have used the extreme value of 30% effectiveness (i.e. half of the original literature-reported estimation of 60%), resulting in an ICER of US$40,446 and cost per QALY gained of US$33,248, which is still much less than that of the WHO threshold of 1 × GDP per capita (US$54,301).
b Upper and lower limit of number needed to screen, ICER and cost per QALY gained are calculated by changing one parameter each time while fixing the other parameters at base-case value.
For the ICER for preventing CPE infection, variation of all parameters did not alter the conclusion that screening was cost-saving except when the lower limit of screening effectiveness was applied; in that scenario, the ICER was US$1,958. Similarly, for cost per QALY gained, use of the lower limit of screening effectiveness yielded a value of US$2,048, whereas screening remained dominant in all other scenarios. The cost per QALY gained was far below the WHO reference value of US$54,301.
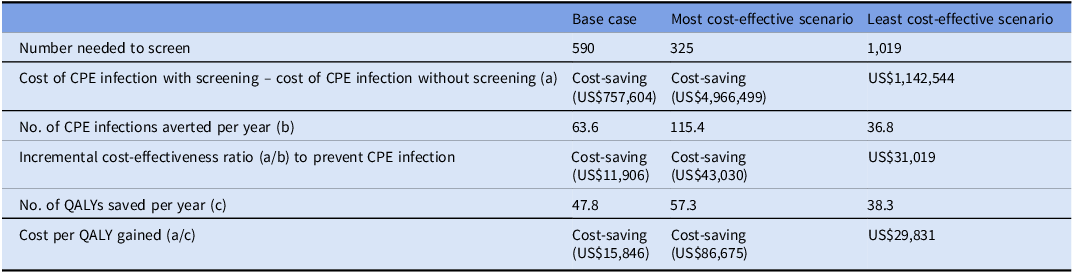
In the worst-case scenario, screening was no longer cost-saving, with an ICER for preventing CPE infection of US$31,019 and a cost per QALY gained of US$29,831 (Table 4). Nevertheless, the screening strategy remained cost-effective.
Best and least cost-effectiveness scenarios for carbapenemase-producing Enterobacterales (CPE) screening

Table 4. Long description
A table comparing cost-effectiveness scenarios for CPE screening. The table has 7 rows and 3 columns. Column headers are Base case, Most cost-effective scenario, and Least cost-effective scenario. Row labels are Number needed to screen, Cost of CPE infection with screening - cost of CPE infection without screening (a), No. of CPE infection averted per year (b), Incremental cost-effectiveness ratio (a/b) to prevent CPE infection, No. of quality adjusted life years (QALY) saved per year (c), and Cost per QALY gained (a/c). Row 1: Base case, 590; Most cost-effective scenario, 325; Least cost-effective scenario, 1,019. Row 2: Base case, Cost-saving (US $757,604); Most cost-effective scenario, Cost-saving (US $4,966,499); Least cost-effective scenario, US $1,142,544. Row 3: Base case, 63.6; Most cost-effective scenario, 115.4; Least cost-effective scenario, 36.8. Row 4: Base case, Cost-saving (US $11,906); Most cost-effective scenario, Cost-saving (US $43,030); Least cost-effective scenario, US $31,019. Row 5: Base case, 47.8; Most cost-effective scenario, 57.3; Least cost-effective scenario, 38.3. Row 6: Base case, Cost-saving (US $15,846); Most cost-effective scenario, Cost-saving (US $86,675); Least cost-effective scenario, US $29,831.
Note. QALY, Quality-adjusted life-year.
Discussion
To the best of our knowledge, this is one of the largest cost-effectiveness analyses of inpatient CPE screening informed by real-world data, combining observed epidemiological and cost data from over 375,000 screening episodes with model-projected estimates of infections averted. Our analysis showed that 590 screening episodes were required to prevent one CPE infection. The screening program was cost-saving, generating annual saving of US$757,604 (range: US$174,647–US$2,462,344). These findings remained robust across one-way sensitivity analyses, except when using the lower limit of screening effectiveness, which yielded a cost per QALY gained of US$2,048. In the worst-case scenario, the cost per QALY gained was US$29,831, much less than that of the WHO threshold of 1×GDP per capita (US$54,301), and was considered highly cost-effective. Our cost-effectiveness ratio was also substantially lower than United Kingdom thresholds (£20,000 – £30,000, or US$26,400–US$39,600; £1 = US$1.32), despite similar GDP per capita to Hong Kong (US$53,246 in 2024). 31 In a simulation study for universal screening of CPE in a US hospital using a Markov model, the ICER per QALY gained was estimated to be US$26,283 in 2016, also considered cost-effective. Reference Lapointe-Shaw, Voruganti, Kohler, Thein, Sander and McGeer15 The higher cost per QALY gained found in this study was likely due to the higher medical costs in the United States compared to Hong Kong.
Our findings align with accumulating evidence that CPE screening is economically justified in hospitals with clinically significant colonization and transmission. Reference Manoukian, Stewart and Dancer16,Reference Toumi, Pulikottil-Jacob, Watts, Odeyemi and Butler32 The primary benefit is timely identification of colonized patients, enabling prompt contact precautions, cohorting, and enhanced infection control measures to reduce further transmission. Reference Organization.6,Reference Otter, Dyakova and Bisnauthsing14,Reference Park, Yi, Suh, Ji, Han and Shin33 Although the program incurs laboratory and operational costs, these are offset by reductions in clinical infections, intensive care utilization, and CPE-associated morbidity and mortality. Our cost-saving results suggest substantial health gains relative to screening costs. Within our cohort, 96.1% of CPE detections were colonizations identified through screening rather than clinical infections, consistent with early identification and containment, although causality cannot be established without a comparator.
This study provides locally relevant estimates for tertiary care settings in Hong Kong, where resources are finite and infection control decisions must balance effectiveness with affordability. Even in the worst-case scenario, the cost per QALY gained in our study was not only below the WHO threshold but also below the commonly cited thresholds used in the United Kingdom. This suggests that CPE screening would remain an economically reasonable strategy even under more conservative decision thresholds. Importantly, the conclusion was robust across sensitivity analyses, indicating that the findings were not driven by a single model assumption.
Several factors explain the cost-saving. First, the screening strategy prevented a meaningful number of infections, and even a modest reduction in CPE infections can generate substantial downstream savings because CPE infections are associated with prolonged hospitalization, intensive care utilization, and high clinical complexity. Second, the most influential parameters in the sensitivity analyses were the effectiveness of screening and the sensitivity of detection, highlighting that the economic value of screening depends heavily on how effectively colonized patients are identified and how successfully transmission is prevented. Third, the relatively low cost per QALY saved suggests that the health benefit gained through avoidance of infection-related morbidity and mortality outweighed the additional screening expenditure.
Our findings should be interpreted in the context of prior literature. Previous studies have shown that CPE screening is more likely to be cost-effective in settings with higher prevalence, greater transmission pressure, or targeted high-risk populations. Reference Manoukian, Stewart and Dancer16,Reference Fournier and Dupont34 However, economic evaluation is highly context dependent, and results from other hospitals or countries may not be directly applicable to Hong Kong. By using real-world data from a large tertiary hospital over a prolonged period, our study provides more locally relevant evidence to support policy decisions on CPE screening strategies.
This study has several limitations. First, the analysis was conducted from the healthcare provider-perspective and therefore did not capture broader societal costs, such as productivity loss, caregiver burden, patient out-of-pocket expenses, or negative effects of contact precautions, such as reduced healthcare worker contact or patient isolation-related harms. Inclusion of a societal perspective might have further increased the apparent value of screening. Second, in estimating the cost of CPE infection, we assumed the whole period of hospitalization was due to CPE infection. However, some patients might acquire the infection after staying in the hospital for a period of time. Nevertheless, our estimate of length of stay due to CPE infection was comparable to other studies (21 to 34 days) and the exact time of acquiring CPE was difficult to ascertain. Reference Kim, Lee and Park35,Reference Ortiz-Brizuela and Cervera-Hernandez36 Third, as screening was hospital-wide standard practice without an unscreened comparator, effectiveness could not be estimated locally and was derived from a modeling study. Reference Lapointe-Shaw, Voruganti, Kohler, Thein, Sander and McGeer15 Fourth, the screening strategies include admission screening, repeat screening during prolonged hospitalization, opportunistic screening of specimens submitted for C. difficile testing, and screening of epidemiologically linked contacts. Nevertheless, it is not possible to distinguish the exact implementation timepoint of each of these screening strategies, precluding further comparison of the cost-effectiveness of these screening methods. Finally, this was a single-center study, and the generalizability of the findings to other hospitals with different prevalence, case mix, or infection control practices may be limited.
Conclusion
CPE screening in this tertiary hospital was cost-saving, or at least cost-effective and robust across sensitivity analyses. These findings support continued screening as a justified infection prevention strategy in settings with comparable epidemiology and resource structure. Local policies should consider prevalence, screening performance, institutional capacity, and available resources when optimizing CPE control strategies.
Data availability statement
The datasets generated for this study will be made available in anonymized form from the corresponding author upon reasonable request.
Acknowledgements
We are grateful for the frontline staff for enforcing the infection control measures at Queen Mary Hospital.
Author contribution
SCW: Conceptualization, Data curation, Formal analysis, Methodology, Project administration, Writing – original draft, Writing – review and editing. ESKM: Data curation, Formal analysis, Methodology, Writing – original draft, Writing – review and editing. SYCS: Data curation, Formal analysis, Methodology. EH: Data curation, Formal analysis, Methodology. EKYC: Writing – review and editing. KHYC: Writing – review and editing. KYY: Supervision, Writing – review and editing. VCCC: Conceptualization, Data curation, Formal analysis, Methodology, Project administration, Supervision, Writing – original draft, Writing – review and editing. All authors have read and agreed to the published version of the manuscript.
Financial support
This study has no funding or sponsorship.
Competing interests
The authors declare no competing interests.
Ethical approval
This study was approved by the Institutional Review Board of The University of Hong Kong/Hospital Authority Hong Kong West Hospital Cluster (IRB reference number: UW 25–652).



 Open access

