On behalf of society, healthcare budget holders have to make choices regarding the use and diffusion of healthcare interventions and reimbursement for their costs. While the number of available health technologies is increasing, budgets are limited. Thus, healthcare policy makers need to know whether the societal benefits of a particular technology or treatment are worth the investment required to offer it (Reference Park, McDaid and Weiser1). Consequently, health technology assessment (HTA) is increasingly important, as it informs decision making on how to obtain the best value for money (Reference Nicod and Kanavos2). HTA is a policy-oriented form of research designed to inform decision makers on the relative effectiveness or the cost-effectiveness of a new technology in comparison with current or best practice (Reference Drummond, Schwartz and Jönsson3). Although stakeholders’ uptake of these studies is increasing (Reference van Velden ME and Novak4;Reference Oliver, Innvar, Lorenc, Woodman and Thomas5), the extent to which HTA information is used in policy making varies. For this reason, better matching of user needs and HTA information is necessary to strengthen the use of HTA (Reference Oliver, Innvar, Lorenc, Woodman and Thomas5;Reference Macintyre, Chalmers, Horton and Smith6). Despite the increased amount of cost-effectiveness information, it is a challenge to enhance the uptake of such information by policy makers and other stakeholders (Reference Drummond7;Reference Garrido8).
EQUIPT Return on Investment Tool
To stimulate use of cost-effective information, the NICE Tobacco Return on Investment Tool was developed and tested in England by Brunel University London, the National Institute of Health and Clinical Excellence, LeLan Solutions (9), and regional tobacco control organizations in 2012 (9). Internationally, 6.3 million deaths and 6.3 percent of all disability-adjusted life years (DALYs) lost in 2010 were estimated to be attributable to tobacco smoking (Reference Lim, Vos and Flaxman10). In 2003, the World Health Organization's Framework Convention on Tobacco Control (11) was ratified by European Union member states (12). The Return on Investment Tool is an economic decision-support tool that provides policy makers and other stakeholders with customized information about the economic and wider returns that investment in packages of tobacco control methods may generate. As such economic decision-support tools provide valuable information for tobacco control stakeholders, the European-study on quantifying utility of investment in protection from tobacco (EQUIPT) is developing a new Web-based version of the tobacco return on investment tool (hereafter “ROI tool”) for use across several European countries (Reference Pokhrel, Evers and Leidl13). A prototype of the EQUIPT ROI tool has been developed for evaluation purposes.
A unique characteristic of the ROI tool is its online availability, which allows decision makers (and other stakeholders) to interact with the model using an interface. Due to several barriers (e.g., lack of adequate presentation format), the mere existence of HTA information does not automatically translate into usage by decision makers. Therefore, better matching of user needs and HTA is needed to strengthen the use of HTA (Reference Oliver, Innvar, Lorenc, Woodman and Thomas5;Reference Macintyre, Chalmers, Horton and Smith6). The lack of human centeredness among stakeholders may create usability problems, leading to high attrition rates, and resulting in “high tech-with-a-low impact” technologies (Reference van Gemert-Pijnen, Nijland and van Limburg14). Therefore, optimizing usability of the decision-support tools, such as the ROI tool, is important in enhancing their usage. Thus, this study stresses the importance of usability evaluation and aids to the HTA discipline by illustrating methods one may use to optimize HTA decision-support tools.
Importance of Usability Evaluation
Despite the valuable information these tools may provide, users may still experience difficulties with a tool's user interface and may decide not to use it (Reference Eysenbach15;Reference Horsky, Schiff, Johnston, Mercincavage, Bell and Middleton16). Usability is defined as “the extent to which a product can be used by specified users to achieve specified goals with effectiveness, efficiency and satisfaction in a specified context of use” (17). Usability evaluation is important to make tools and other interventions efficient, effective, and satisfying to use (Reference Bevan18;Reference Wichansky19). A good user interface (UI) can make the difference between continued or discontinued intervention usage (Reference Cho, Cheng and Lai20). Moreover, users may decide not to adopt an intervention based on perceived usability and merit. The perceived usability of a tool's UI has been demonstrated as an important determinant of an individual's intention to use an intervention (Reference Cho, Cheng and Lai20). In the context of an online store, usability issues may affect the customers’ perceptions and behaviors, with more usable Web sites enhancing positive attitudes toward online stores and increasing conversion rates (Reference Becker and Mottay21).
Various usability principles determine use and should guide the design of a UI (Reference Ahern22;Reference Nielsen23). Usability studies provide developers with insights into the user-friendly aspects of a UI, its violation of design principles, and its specific problems (Reference Voncken-Brewster, Moser, Van Der Weijden T and De Vries H24). Hence, it is important to evaluate usability to identify and fix problems in, and thus optimize, an economic decision-support tool, such as the EQUIPT ROI tool.
Aims
This study aims to illustrate a mixed-method usability evaluation of an economic decision-support tool for tobacco control, using the EQUIPT ROI tool prototype as a case study. This study may help to improve the ROI tool and also serve as a vantage point for developers of similar tools to conduct a usability evaluation.
METHOD
This is an exploratory study to evaluate the usability of the ROI tool prototype with a mixed methods design. This section first details the ROI tool prototype and the study participants; followed by a description of the methods of the usability evaluation.
ROI Tool Prototype
EQUIPT is developing a new version of the similar NICE Tobacco Return on Investment Tool (which is accessible online) (9) for use across several European countries (Reference Cho, Cheng and Lai20). At the time of testing, the EQUIPT study had developed a prototype of the ROI tool with dummy (UK-based) data, running on the Microsoft Excel platform with a UI built in Visual Basic for Applications. The development of the prototype was based on the design plan of EQUIPT and the results of stakeholder interviews (Reference Pokhrel, Evers and Leidl13;Reference Cheung, Evers and Hiligsmann25). These interviews revealed that it is important that the tool be easy to use, include several outputs (e.g., cost of smoking, quality of life, and effectiveness of smoking cessation interventions), and have the option to yield results in different time horizons (Reference Cheung, Evers and Hiligsmann25).
After downloading and opening the Excel file, this ROI tool prototype allows users to explore the tool's UI. Therein, users can create a “package” of tobacco control methods (which may include a mix of pharmacological and behavioral support components) and view the estimated return on investment and cost-effectiveness of such a package. At the time of the study, the Excel prototype was only functional for Windows users. The final ROI tool is intended to be a platform-agnostic, Web-based tool without the need to download and open a file (see Supplementary File 1 for a video illustrating the functionalities of the tool).
A typical experience of using the ROI tool starts with a screen to select the country (or a more specific area) of interest. This allows the tool to populate the model with country-specific estimates for relevant indicators (e.g., population size, smoking prevalence, and availability and cost of different tobacco control interventions). The tool then automatically generates a “Current Package” of interventions that reflects that country's current provision of tobacco control services. The user may view and amend the parameters in the Current Package and explore the short-, medium-, and long-term impacts of different combinations of interventions and strategies (i.e., to explore the impact of different investment scenarios).
Participants
End-users of the tool (i.e., stakeholders) and eHealth experts were recruited. European tobacco control stakeholders were recruited through convenience sampling. Stakeholders from Germany, Hungary, Netherlands, Spain, and the United Kingdom were included, as the ROI tool is being developed for these countries. Five relevant categories of stakeholders were approached: decision makers, professionals/service providers, evidence generators (academics and researchers), advocates of health promotion, and “other” stakeholders. This procedure included almost all those eligible who would be covered by the Centre for Disease Control and Prevention's stakeholder definition (26). It was not possible to predict a priori the composition of the final sample, which was determined by those who agreed to participate. All participants filled in an informed consent after reading the information letter provided before the study.
Regarding eHealth experts, three experts from the Netherlands and one from the United Kingdom were recruited through convenience sampling. This is in line with recommendations to include three to five experts for a heuristic evaluation (see below) (Reference Nielsen and Landauer27;Reference Jaspers28). An e-mail was sent to the experts, including instructions and the relevant attachments (see below).
Usability Evaluation
Multiple methods were used to evaluate the ROI tool's usability, detailed below. Before each evaluation, a video explaining the functionalities of the ROI tool was shown (see Supplementary File 1).
Test Scenario
The test scenario was written out and consisted of six questions leading the users through the main functionalities of the ROI tool. While answering the questions, users performed tasks that were similar to those that would be performed by future users. In the test scenario, users were instructed to imagine being part of a national public health team with an increased budget. The goal was to explore whether it was cost-effective to invest the additional budget in the pro-active telephone support intervention.
Users were asked to (i) report the percentage adult smokers, (ii) report the percentage of uptake and effectiveness of the pro-active telephone support intervention, (iii) report the economic return expected for every euro invested in the current package of interventions, (iv) to invest the budget in the pro-active telephone support intervention, (v) to determine the cost per quality-adjusted life-years gained from this alternative level of investment compared with the current package, and (vi) generate the narrative report and report the quasi-societal net present value after 5 years. The ROI tool prototype was piloted (n = 12) with the test-scenario resulting in minor adjustments to the final ROI tool prototype and test scenario (see Supplementary File 2).
Questionnaire
All participating European stakeholders completed a questionnaire (see Supplementary file 3 for the phrasing of each item) as part of an EQUIPT study. This questionnaire includes items testing and evaluating the usability of the ROI tool. To evaluate the ROI tool quantitatively, the System Usability Scale (SUS) was used (Reference Brooke29), which is composed of ten statements assessing the user's strength of agreement on the intervention's usability. To enhance consistency in the questionnaire, users are asked to score each statement on a 7-point scale instead of the original SUS 5-point scale of strength of agreement (1, strongly disagree; 7, strongly agree with a statement). Final scores for the SUS can range from 0 to 100, where higher scores indicate better usability.
Heuristic Evaluation
Heuristic evaluation is an evaluation method, using experts (rather than end-users), aimed to identify usability problems with user interfaces (Reference Jaspers28), and is based on Nielsen's recommendations (Reference Nielsen23). These recommendations are a list of recognized usability principles, which are called heuristics. Heuristics are general principles referring to common properties of usable interfaces. These are: (i) visibility of system status; (ii) match between system and the real world; (iii) user control and freedom; (iv) consistency and standards; (v) error prevention; (vi) recognition rather than recall; (vii) flexibility and efficiency of use; (viii) aesthetic and minimalist design; (ix) help users recognize, diagnose, and recover from errors; and (x) help and documentation. These ten heuristics (Reference Nielsen23) were translated into a series of questions (e.g., “Are there any incidents where the ROI tool is unresponsive or slow? If so, please list them and indicate how severe they are”; see Supplementary File 3), which were then developed into a heuristic evaluation form.
Four eHealth experts served as evaluators and were provided with the ROI tool prototype, a link to the introductory video, the heuristic evaluation form, and the slightly adjusted test scenario (tailored to the experts). Inspection of the UI was conducted independently, assessing the questions for each of the six scenarios with responses written on the heuristic evaluation form template.
The evaluators watched a video providing a brief introduction to the ROI tool. The heuristic evaluation form considered recommendations by Nielsen (Reference Nielsen23), which includes (i) name of heuristic and its general description, and (i) specific questions about the heuristics. The test scenario was used to guide the evaluators through the main functions of the ROI tool.
Thinking Aloud Procedure
The thinking aloud method involves participants (representing end-users) thinking aloud as they are performing a set of specified tasks (or going through a scenario) (Reference Jaspers, Steen, van Den Bos and Geenen30). The method was used to assess the stakeholders’ reasoning and the source of their problems while using the ROI tool. Country-specific researchers planned a Skype meeting with each participating stakeholder. If the usage of Skype was not possible (e.g. forbidden in the institution of the stakeholder), other communication methods were used, such as telephone and face-to-face meetings. In the meetings, which lasted approximately an hour, participants were asked to share screens with the researchers. Participants were also asked to open the prototype of the ROI tool and a link leading them to an online survey, which included the questionnaire and the test scenario.
The session started with the video explaining the functionalities of the ROI tool (see Supplementary File 1). After participants read the scenario, they were asked to verbalize their thoughts (thinking aloud) while going through the tasks of the test scenario. To encourage participants to talk freely, the researchers emphasized that the intention was to evaluate the program and not the participants’ behavior. As the meetings were online, participants were able to decide for themselves where they felt most comfortable conducting the evaluation. Participants were encouraged to speak constantly, and researchers reminded them to keep talking if they fell silent. Interruption by the observers was kept to a minimum. Researchers made field notes for each task of the scenario. Microsoft Expression Encoder 4 Screen Capture was used to capture screen display and participants’ verbal comments. This allowed the researchers to review the sessions to identify problems or comments that were missed during the sessions.
DATA Analysis
Analyses were conducted using SPSS Statistics 22 software. To get an overall picture of the usability of the ROI tool, we calculated the SUS score (Reference Brooke29). Scores on the SUS items were recoded to a score between “0” and “6,” summed, and then multiplied by (10/6). This resulted in a SUS score between 0 and 100 (Reference Brooke29).
For the heuristic evaluation, data in the templates were assembled in one document. The content of this document was categorized and analyzed according to Nielsen's heuristics. For each heuristic, a list of usability violations was created and sorted according to severity in each country. A discussion between two independent researchers (K.L.C. & M.P.) was planned to discuss categorizations according to the heuristics. Five country-specific researchers then independently rated each usability problem for its severity (five-point Likert scale ranging from “0” no usability problem to “4” severe usability problem). As the mean scores of the severity ratings of the four evaluators were found to be reliable (Reference Nielsen31), we averaged the severity ratings of the five researchers to indicate the severity of the specific usability problem.
Observations and field notes from the thinking aloud approach were reviewed and comments (i.e., relevant thoughts concerning problems during tasks or when tasks went noticeably smoothly) were identified by the country-specific researchers. In each country, two independent researchers reviewed the comments and identified violations of the heuristics; if researchers disagreed, consensus was reached through discussion. Two researchers compiled the five resulting lists of usability problems and categorized the usability violations according to the heuristics. Again, five country-specific researchers independently rated each usability problem for its severity (5-point Likert scale ranging from “0” no usability problem to “4” severe usability problem). These scores were then averaged to indicate the severity of the specific usability problem.
RESULTS
Sample Characteristics of European Stakeholders
Of the 151 European stakeholders approached in the five countries, sixty-six respondents agreed to take part, resulting in a 44 percent response rate. Approximately 41 percent respondents were female, and the average age of stakeholders was 49.4 years. Of the sixty-six respondents, 23 percent were Dutch, 24 percent Hungarians, 21 percent Germans, 21 percent Spanish, and 11 percent British. Respondents were from different categories of stakeholders: eighteen (27 percent) decision makers, twenty-three (35 percent) professional service providers, thirteen (20 percent) evidence generators, two (3 percent) advocates of health promotion, and twn (15 percent) other stakeholders.
Usability Evaluation
The mean of the SUS score was 51.80, with a standard deviation of 18.79. In total, fourteen participants (21 percent) had a ≥68 SUS score (SUS score of 68 being an average usability score of interfaces) (Reference Brooke32). The thinking aloud procedure revealed a total number of 118 distinct usability problems. The heuristic evaluation method revealed twenty-eight usability problems, while fourteen of these overlapped with the thinking aloud procedure. We found three cosmetic problems, with a score between 0 and 0.9 (e.g., old-fashioned layout with main hyperlinks in capital letters), twenty-seven minor problems with a score between 1.0 and 1.9 (e.g., one is not able to enlarge the screen of the tool, and the tool shows former smokers estimates before current smokers estimates, which may be counterintuitive), and fifty-seven major problems with a score between 2.0 and 2.9 (e.g., buttons do not look clickable, and the tool is unable to print/export the graphics).
Severe Usability Problems
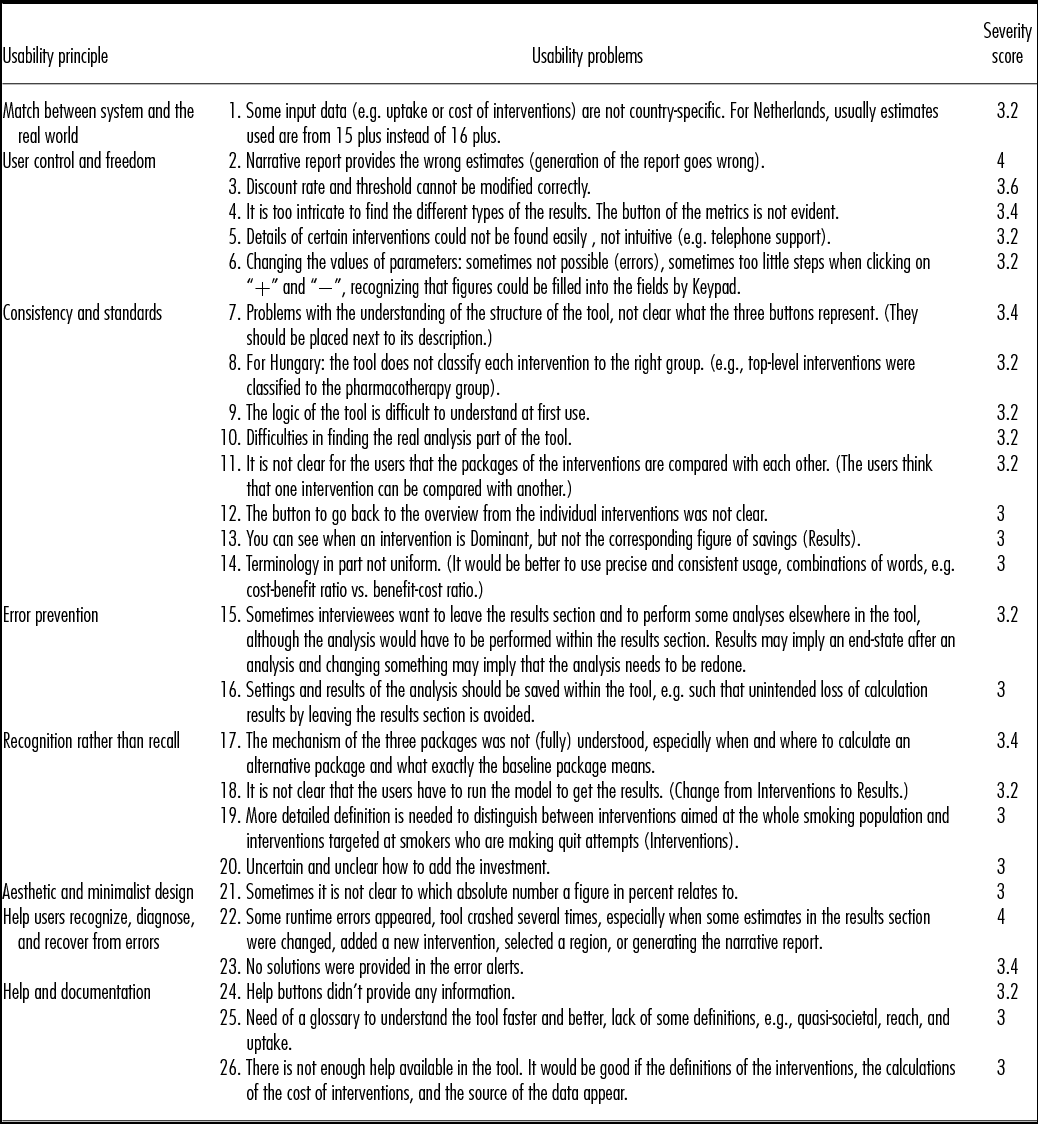
It was determined that twenty-six usability problems should be fixed with high priority; those with a severity rating of 3.0 and up (see Table 1). A complete overview of the usability problems, the mean severity ratings, and the categorization of the problem types based on Nielsen's heuristics is provided in Supplementary file 4.
Severe Usability Problems

Severity score: 0-0.9 cosmetic problem, 1-1.9 minor usability problem, 2-2.9 major usability problem, 3-4 usability catastrophe
DISCUSSION
This study illustrated, by means of a mixed-method design, the evaluation of an economic decision-support tool, using the EQUIPT ROI tool as a case study. This resulted in the identification of a rich list of usability problems regarding the ROI tool. Literature indicates that it is preferable to use a mixed method for usability evaluation, especially user-based and expert-based methods, as these two methods complement each other. The thinking aloud method provides a rich source of data and shows insights into why certain aspects are usability problems. The heuristic evaluation is cheap and less time consuming, relies less on task selection, and may better capture different usability problems (Reference Jaspers28).
Usability of the ROI Tool
Overall, the results indicated low usability of the ROI tool UI at the time of this study, as the SUS score fell below the average usability score of interfaces (Reference Brooke32). Hence, it is necessary to improve the usability of the UI, and thus the tool. For this purpose, the list of usability problems was given to the tool development team so that the UI could be revised. The development team and researchers conducting this usability study discussed the usability problems, and based on the severity ratings, some issues were prioritized to implement changes to the UI.
No high priority usability problems (usability catastrophes) were identified in the heuristics “visibility of system status” and “flexibility and efficiency of use”. Most severe problems were found in the heuristics “user control and freedom” and “consistency and standards”. Designers of such decision-support tools may thus be especially aware of the need to minimize instances where important changes cannot be easily undone or where inconsistencies arise concerning language use or functionality (Reference Nielsen23).
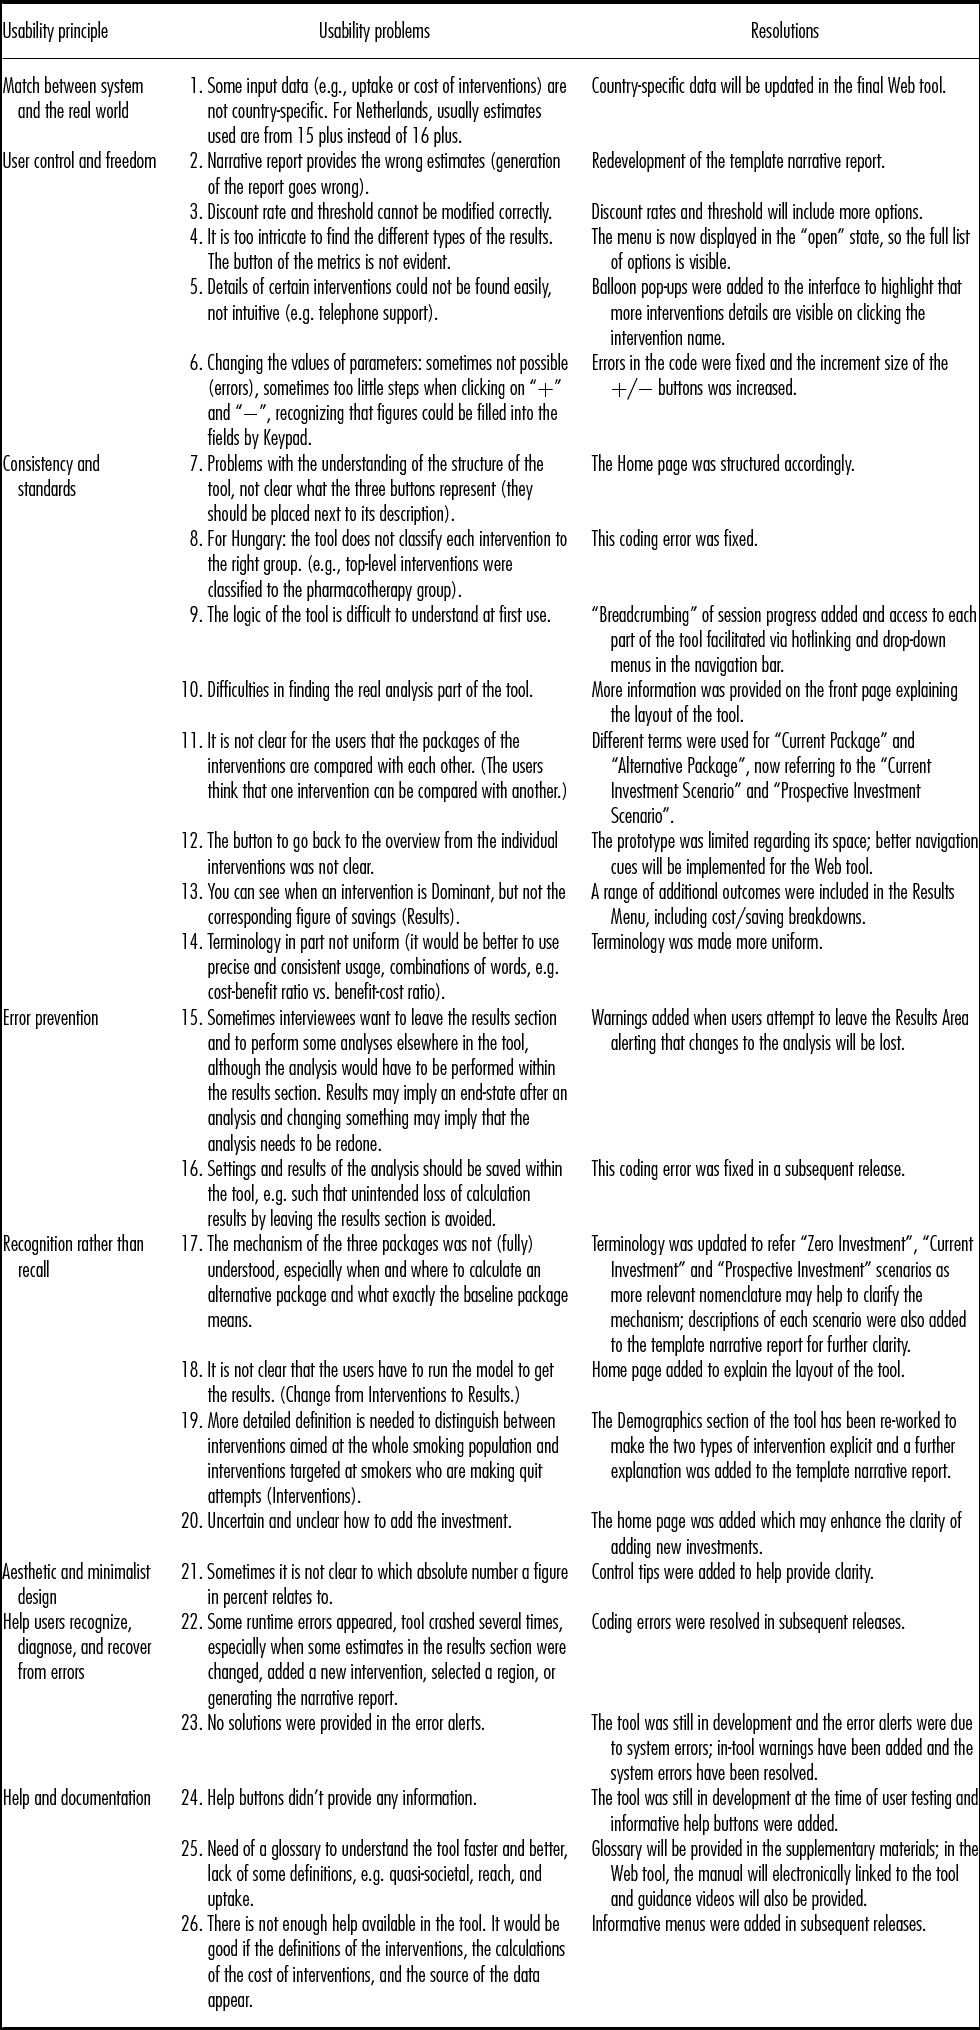
Implications of the findings were to fix these problems, especially those with high priority. The user interface needed further development and solutions were proposed by the team and implemented for the final version of the ROI tool. For instance, as the option for displaying different types of results was not plainly evident, the results menu is now displayed in the “open” state, so the full list of options is clearly visible. For the full list of resolutions of the major problems, see Table 2.
Major Usability Problems and Resolutions

Thinking Aloud versus Heuristic Evaluation
Literature showed that the heuristic evaluations detect relatively large numbers of minor usability problems (Reference Jaspers28;Reference Jeffries, Miller, Wharton and Uyeda33), and there was an indication that the method detects more low- and high-severe problems than the thinking aloud method (Reference Jeffries, Miller, Wharton and Uyeda33). However, this study did not yield such trend, as experts identified problems with a variety of severity scores. This indicates the need for more research regarding the differences between these methods in different contexts. Literature also indicates that both heuristic evaluation and thinking aloud methods are effective in revealing usability problems, but that they capture different problems (Reference Lai, Larson, Rockoff and Bakken34). Moreover, there is indication that more than half of the problems identified by the heuristic evaluation, may not be detected by the thinking aloud method (Reference Bailey, Allan and Raiello35).
Findings of this study are consistent with prior studies, as the heuristic evaluation yielded 14 more unique usability problems, which is half of the detected problems with the heuristic evaluation method. Yet, the differences between the perspectives of these methods are unclear, indicating the need for more research. In addition, this study suggests the need to evaluate usability in the future development of decision-support tools. The usability of these tools may not be optimal while it may be paramount for adoption, in line with important innovation characteristics to enhance adoption outlined in the Diffusion of Innovation theory (Reference Rogers36).
In line with our findings and previous literature, we recommend combining user-based evaluation methods (e.g., thinking aloud method) with expert-based evaluation methods (e.g., heuristic evaluation). The thinking aloud method and heuristic evaluation are the most popular methods used in usability studies. Each method has its advantages and disadvantages. However, when used in tandem, they complement one another, resulting in their collective application being more powerful than when applied in isolation (Reference Jaspers28).
While the thinking aloud method may provide a rich source of data (including the cognitions behind it), verbal protocols may not may not capture all thought processes. Results may be impacted by the user characteristics, the selected task, and the extent to which the users are representative to the end-users. The heuristic evaluation may, therefore, identify different usability problems due to the use of experts and the relatively unstructured approach (rather than capturing cognitions during the selected tasks) (Reference Jaspers28).
It is recommended that design of any interactive intervention follow an iterative process of initial design (prototype) evaluation, and redesign (Reference Jaspers28), using a combination of evaluation methods (such as the methods used in this study). This iterative process enhances the match between user needs and the intervention, and the identification of problems in early development stages (which may avoid unnecessary high adjustment costs).
In practice, the usability evaluation plan depends on several factors, including time and financial constraints, and the availability of end-users. There seems to be an increasing need to make economic models open access and available to the community. In view of this potential, future trend, optimizing usability of these economic models will be an important challenge in the field of HTA. This study may, therefore, serve as a vantage point to enhance usability of these online available models.
Limitations
This study has several limitations. One limitation is the potential lack of generalizability of the results, as participants were limited to the stakeholders of tobacco control. Findings regarding the problems identified in each method are tool specific. Another limitation is that this sample may not reflect stakeholders of tobacco control, as we cannot rule out participation bias. It is feasible that participating stakeholders were more familiar with economic decision-support tools or health economic terminology. Moreover, this study evaluated and tested the usability of the prototype. It is, therefore, uncertain to what extent the final ROI tool has major usability problems. Furthermore, due to time constraints, the scenario for the usability evaluation did not cover all functionalities of the ROI tool prototype. More usability problems may have been detected if stakeholders were asked to explore other metrics and functionalities.
Conclusion
In conclusion, despite carefully designed interfaces of decision-support tools, evaluating the usability enabled the development of a tool that is better aligned to the requirements of its stakeholders. This study used a mixed-method design to detect usability flaws, and may serve as a vantage point for other developers to conduct usability evaluations to refine similar tools before wide-scale implementation. Combining user-based and expert-based evaluation methods is recommended as these were shown to identify unique usability problems. This study aids the development of an interactive intervention and reduces implementation gaps by optimizing usability, enhancing in turn the research impact of such interventions.
SUPPLEMENTARY MATERIAL
Supplementary File 1: https://doi.org/10.1017/S0266462317004470
Supplementary File 2: https://doi.org/10.1017/S0266462317004470
Supplementary File 3: https://doi.org/10.1017/S0266462317004470
Supplementary File 4: https://doi.org/10.1017/S0266462317004470
CONFLICTS OF INTEREST
The author have nothing to disclose.