INTRODUCTION
Introductions of parasites into new geographical regions have important implications for their impacts on native species, increased disease risks and fundamental processes in evolutionary biology (Drake, Reference Drake2003; Brooks and Hoberg, Reference Brooks and Hoberg2007; Moret et al. Reference Moret, Bollache, Wattier and Rigaud2007; Barré and Uilenberg, Reference Barré and Uilenberg2010). Temperature is a major abiotic factor affecting parasite infection dynamics (Kutz et al. Reference Kutz, Hoberg, Polley and Jenkins2005; Marcogliese, Reference Marcogliese2008; Karvonen et al. Reference Karvonen, Rintamäki, Jokela and Valtonen2010), so it can be predicted that temperature change might have a major influence on the ability of parasites to establish in areas of introduction. For parasites in endotherm vertebrates, only the ‘off-host’ stages are vulnerable to changes in external temperature, primarily influencing the dynamics of invasion. However, for helminth parasites in ectotherm hosts, all life-cycle stages are affected. There may be some modulation in these effects as a result of host behavioural responses to environmental temperature: thus, hosts that seek refuge from extreme low temperatures may protect their parasites from adverse conditions, and short-term movements into warmer environments (for instance, basking by hosts) may increase rates of parasite physiological processes. Importantly, external temperature change (whether or not modulated by the host) has added significance for ectotherms because their immune responses are temperature dependent (for instance, Le Morvan et al. Reference Le Morvan, Troutaud and Deschaux1998; Carey et al. Reference Carey, Cohen and Rollins-Smith1999).
This investigation involves a helminth parasite of an ectotherm vertebrate host introduced from the Mediterranean climate of the Cape, South Africa, to a cool temperate environment in Wales, UK. The African amphibian Xenopus laevis exploits diverse environments in North and South America, Europe and Asia, showing a tolerance of water temperatures near to 30°C in desert regions and near to freezing in areas where habitats are ice-covered in winter (Tinsley and McCoid, Reference Tinsley, McCoid, Tinsley and Kobel1996). The monogenean Protopolystoma xenopodis is strictly specific to X. laevis and was almost certainly introduced with its host to Wales in the early 1960s (Tinsley et al. Reference Tinsley, York, Everard, Stott, Chapple and Tinsley2011). For this helminth, there are extensive laboratory data indicating that life-cycle processes are strongly regulated by environmental conditions, especially temperature (reviewed by Tinsley, Reference Tinsley2004). These empirical studies support the prediction that P. xenopodis should have extreme difficulty in host-to-host transmission in Wales (Tinsley et al. Reference Tinsley, York, Everard, Stott, Chapple and Tinsley2011). It has nevertheless survived despite these constraints for over 40 years. The interaction represents a ‘natural experiment’ regarding the factors affecting a parasite introduction.
Habitat conditions for the host-parasite population in Wales that enable interpretation of life-cycle events, have been described by Tinsley et al. (Reference Tinsley, York, Everard, Stott, Chapple and Tinsley2011). The study site is a man-made pond (area 140 m2) in farmland. With reference to the parasite developmental periods considered below, data loggers located on the pond bottom recorded water temperatures that were more-or-less continuously <10°C from mid-October to late April (>6 months) (in 2006–2008). Temperatures were >15°C for 5 months in 2007 and 4·25 months in 2008 and >18°C for a total of 6 days in 2007 and 2 days in 2008. Spatial temperature variation in the pond showed a range of up to 8°C at mid-day in early June, between deep water in permanent shade (15°C) and shallow water over mud banks exposed to sunshine (23°C). Habitat area where these elevated temperatures can develop is constrained by the structure of the pond: most of the perimeter (>70%) is formed by vertical stone walls alongside which water depth is approximately 60 cm above about 1 m of mud, but there are ramps for access by livestock that provide gently sloping banks and shallow water (<30% of the perimeter). About half of the water surface is shaded by tree canopy and about half exposed to sun (Tinsley et al. Reference Tinsley, York, Everard, Stott, Chapple and Tinsley2011).
As part of a larger study of the host-parasite interactions, temperature effects have been quantified at a series of key points in the life cycle. Tinsley et al. (Reference Tinsley, York, Everard, Stott, Chapple and Tinsley2011) considered viability and developmental rates of eggs. This paper records growth and developmental rates of juveniles post-infection. Further studies of environmental constraints on survival post-infection and reproduction are considered in a separate account (Tinsley et al. manuscript in preparation). The procedures have employed parasites taken from natural infections ‘in the wild’ and maintained under controlled environmental conditions in the laboratory. Temperatures were selected to enable reconstruction of life-cycle schedules in the range 10–20°C (relevant to the Welsh site) and at 25°C. Data at this highest temperature are relevant to conditions in S. Africa (see Jackson and Tinsley, Reference Jackson and Tinsley2002) but also allow predictions relating to future warming in temperate regions. Results provide assessment of the factors affecting establishment of introduced parasites from warm climate regions in cool, non-native environments.
MATERIALS AND METHODS
Sources of material
The overall programme of experiments employed hosts and parasites from 2 sources: the introduced population in Wales and a consignment of adult X. laevis carrying a natural infection of P. xenopodis, caught at one locality on the Cape, South Africa and imported to the UK within 48 h of capture in December 2006. For the present account, data are reported only for the S. African material. This latter sample represented a ‘wild-type’ for hosts and parasites of this system since the Cape was the probable geographical origin of the Welsh population (Tinsley and McCoid, Reference Tinsley, McCoid, Tinsley and Kobel1996).
To provide naïve hosts for experimental infections, X. laevis were spawned in the laboratory following injection of Human Chorionic Gonadotrophin (Sigma, UK); tadpoles were reared to metamorphosis on a diet of finely-ground fish flakes, commercial Xenopus tadpole food (Blades Ltd, UK) or milk; post-metamorphic stages were fed with commercial pelleted Xenopus diet or chopped ox heart (following the methods of Tinsley, Reference Tinsley, Hubrecht and Kirkwood2010). There was no systematic bias in the diets of tadpoles between treatments in the present experiments. A series of families was produced from different parents and the offspring of each spawning were kept separate throughout development.
All laboratory raised hosts employed in experimental infections in this study were from a single F1 family of full-sibs (designated ‘Sib 17’), bred from wild-caught parents, and were exposed to parasite larvae hatched from eggs from naturally infected X. laevis from the same S. African population. (Other combinations of hosts and parasites from Wales and South Africa, mentioned briefly below, will be documented in future publications.)
Eggs of P. xenopodis for experimental infection were pooled from the output of about 30 X. laevis. As a guide to the genetic diversity of larvae used in experiments, this ‘egg factory’ carried 1–3 adult worms/host (estimated from egg output, see Tinsley, Reference Tinsley2004).
Experimental infections
The wild-caught hosts were maintained in aquaria (each with about 10 animals in 50 litres of water) and fed weekly with chopped ox heart. Parasite eggs were collected at each water change (every 48 or 72 h): the water was allowed to settle and the sediment decanted, with rinsings, into crystallizing dishes; eggs were transferred with a Pasteur pipette to Petri dishes and incubated at controlled temperature and illumination.
At the end of larval development, eggs collected during one 24 h period typically hatch over several days (Jackson et al. Reference Jackson, Tinsley and Du Preez2001; Tinsley et al. Reference Tinsley, York, Everard, Stott, Chapple and Tinsley2011). To obtain freshly emerged oncomiracidia for host exposures, Petri dishes containing ready-to-hatch eggs were transferred from incubator to stereo-microscope stage, and the disturbance (movement, increased illumination, together with water currents induced with a Pasteur pipette) resulted in rapid hatching. Larvae known to be <1 h old were removed with a pipette, counted, and introduced into a container with a naïve, juvenile, laboratory-raised X. laevis (typically 35–45 mm snout-vent length at the time of infection) in 300 ml of dechlorinated tapwater. Each prospective host was exposed to invasion with precisely 20 swimming oncomiracidia and was left undisturbed in dim illumination for about 24 h. Experimentally infected animals were marked using numbers and letters made with stainless steel wire cooled in liquid nitrogen to produce a unique identifier (Tinsley, Reference Tinsley, Hubrecht and Kirkwood2010), maintained in groups generally of 20 in aquarium tanks (45×45×45 cm containing 50 litres of water), and fed once or twice weekly with chopped ox-heart.
Effects of temperature on parasite development post-infection
All host exposures were carried out at 20°C using larvae from eggs incubated at 20°C to ensure equivalent invasion success. Subsequent parasite development was studied at 4 temperatures: 10, 15, 20 and 25°C. For trials at 15 and 25°C, animals were acclimated to their respective temperatures over several weeks before infection, brought to 20°C for the period of exposure (24 h) and then returned to their maintenance temperature in stages of 2−3°C/day (i.e. about 2 days). For experiments at 10°C, acclimated animals were brought up to and down from 20°C over a longer period (typically 1–2 weeks).
Experimentally infected hosts were maintained in rooms with environmental control providing constant water temperature (variation typically within 1 °C). Onset of patency was detected by screening the tank sediment for P. xenopodis eggs; at the first record of eggs in bulk water collections, animals were transferred to individual containers and the water screened after 48 or 72 h to identify the host(s) responsible. For records at 15, 20 and 25°C, most infections were terminated and the hosts dissected at 105 (±2) days post-exposure; 13 out of 60 infections were terminated just outside this range (at −3, −4 or +3 days). To allow for predicted slow development at 10°C, these infections (n=26) were maintained for 150–180 days p.i. before dissection, so results are not directly comparable with those from the 3 higher temperatures. One result (below) is cited from a preliminary trial following experimental infection in a different sib-ship of X. laevis maintained at 10°C for 13 months.
Infection outcome
Parasites were recovered from the urinary system by dorsal host dissection: removal of the vertebral column allowed extraction of bladder, kidneys and associated ducts intact (preventing loss of worms from severed ducts until after transfer to a Petri dish). Urinary bladder and kidneys were examined in separate dishes of 0·3% buffered saline (approximately isotonic with amphibian urine) with the kidneys finely teased apart with dissection needles. Fixatives typically cause irregular distortion of P. xenopodis with transverse folding in the mid-body and the haptor attaching to the head. In unflattened specimens, internal features (arrangement of gut, shape and size of haptoral sclerites) may be difficult to determine. For this study, worms were flattened individually under gentle pressure from a cover-slip during infiltration of 10% formal saline: this achieved a consistent natural form with the hamuli lying flat. For microscopic examination, worms stored in formalin were rinsed in water, transferred to a drop of glycerine under a cover-slip, and examined unstained with a Nikon Optiphot microscope. Morphometric characters were measured using a digital camera (Infinity Camera V, Lumenera Corporation, Canada) with dimensions recorded with Image-Pro Express version 6 software (Media Cybernetics, Inc., USA).
Data were recorded for numbers of parasites recovered in the kidneys and urinary bladder, pre-patent period, and body size and developmental stage at termination. For each worm, a suite of morphometric characters was measured, following criteria defined by Tinsley and Jackson (Reference Jackson and Tinsley1998) and Jackson and Tinsley (Reference Jackson and Tinsley2007). Data in this account are limited to total body length (including haptor), body length (measured to the junction of body with haptor), large hamulus total length (top of dorsal root to the distal lobe adjacent to the base of the point), and one additional character: body area (representing the space within the profile of the body proper excluding the haptor, calculated by the Image-Pro programme).
Data analysis
Allometric relationships between body size metrics were assessed using linear models in R (version 2.11.1, R Development Core Team, 2010). Parasite body size data were analysed with linear mixed effect models using lmer from lme4 in R. The effects of the covariates host body weight, host fat body weight, host gonad weight, intensity of infection and temperature on parasite body size were investigated alongside that of the fixed factor host sex. The logs of parasite body size measures were used to improve the normality of residuals and equalize variances between temperature treatments. Models all included the random effects of ‘host’ nested within the ‘tank’ in which groups of hosts were housed. Models were fitted using maximum likelihood, then simplified and selected based on AIC scores. The significance of terms was assessed by comparing models with and without the term of interest using likelihood ratio tests. Time to patency data were investigated using non-parametric Kaplan-Meier survival analysis (SPSS version 16), comparing survival curves by the Log-Rank method. Means are reported±their standard errors.
RESULTS
Effects of temperature on parasite developmental migrations within the host
Protopolystoma xenopodis first invades the host kidneys and later migrates to the urinary bladder (Tinsley and Owen, Reference Tinsley and Owen1975). At the 3 higher temperatures (examined at around 105 days p.i.), worms that had completed migration to the urinary bladder comprised 77% of the total at 15°C, 83% at 20°C, and 100% at 25°C (n=189, 150 and 105 worms respectively in 18–22 hosts per temperature). The fraction of the population at 20°C that still remained in the kidneys was dominated by a cohort of worms that were stunted in development (considered below). Excluding this apparently abnormal occurrence, only 1 worm at 20°C had not completed migration by the 105-day end-point. At 15°C, 13 out of 18 hosts carried worms in the kidneys alongside already-migrated worms in the bladder, suggesting migration in progress at the time of the 105-day termination (and in the remaining 5 hosts in this group all worms had completed migration).
After 150–180 days p.i. at 10°C, almost all worms (56 out of 57 in 26 hosts) remained in the kidneys; the single worm that had migrated to the bladder was found in a host examined after 177 days. In a trial with 2 hosts from an unrelated sib-ship (see above), worms were found still in both sites after 13 months p.i. (totals 10 in the bladder and 6 in the kidneys), indicating a considerable delay to migration.
Assessment of morphometric characters
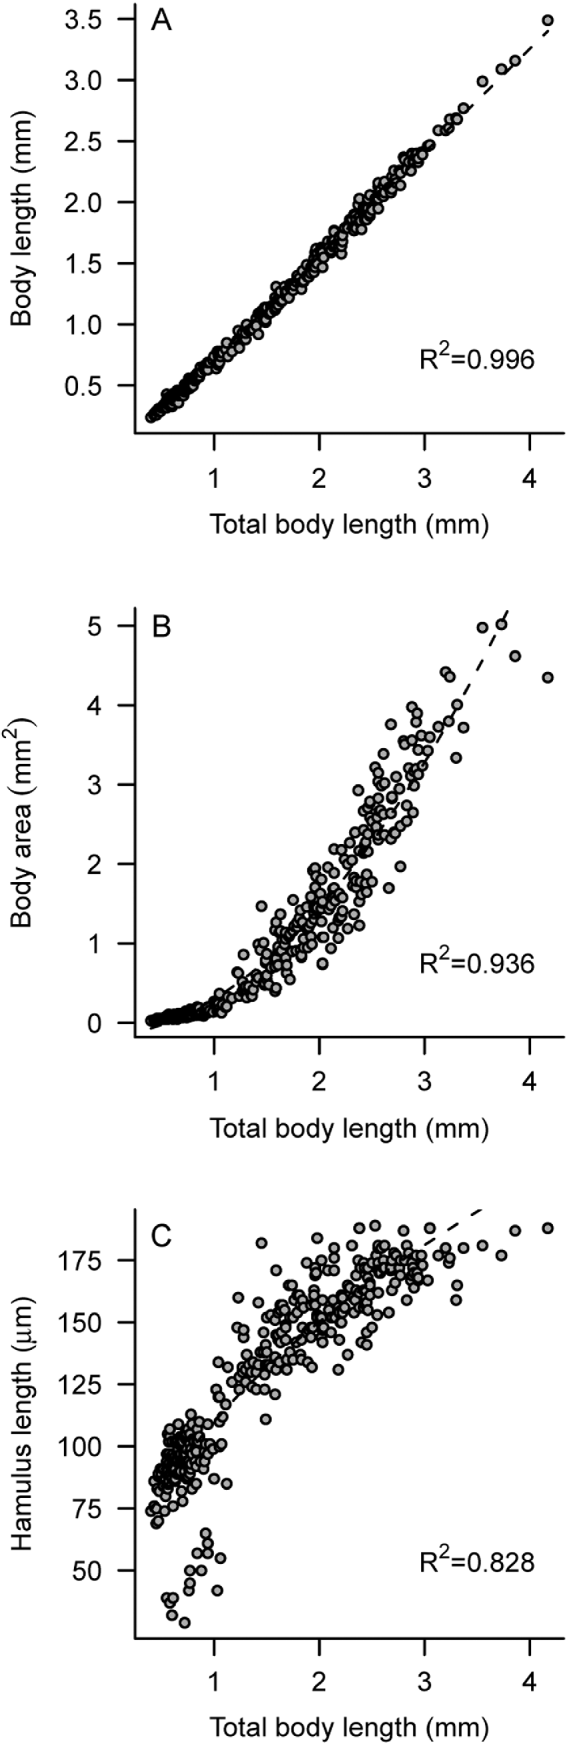
Protopolystoma xenopodis has an oval to lanceolate body (see Tinsley and Jackson, Reference Jackson and Tinsley1998). Parasite size was assessed using 4 metrics: total body length (including the haptor), body length (excluding the haptor), body area, and hamulus length. These measures were all correlated, but the nature of the allometric relationships between variables differed (Fig. 1). There was a tight linear relationship between total body length and body length (R 2=0·996) (Fig. 1A) confirming the effectiveness of standardizing the fixation procedures (see above) and the repeatability of results. Experience gained during fixation suggested that calculation of total body area would give an informative measure of differences in parasite size. In the case of the relationship between total body length and body area, including the square of total body length in a model to fit an accelerating quadratic curve was the best fit of the data (F(1,396)=2437, P<0·0001) (Fig. 1B). This reflects a progression in which juveniles in the host kidneys are thin and spindle-like (up to about 1 mm long) and begin to develop the rounded body at migration to the urinary bladder. In contrast, the rate of increase of hamulus size with total body length declined with increasing size and was best described by a decelerating curve fitted using the square root transformation of total body length (F(1,395)=107·7; P<0·0001) (Fig. 1C). This reflects a growth pattern in which the hamuli can reach maximum size in worms 2–3 mm long and show little or no further growth during continued expansion of the body (up to 4 mm total length in Fig. 1C). The hamuli are hard structures, not affected by fixation; their length measurement provided a sensitive indicator of growth differences that were not apparent from the soft-tissue measurements (see below).
Relationships of body size metrics in Protopolystoma xenopodis following development in Xenopus laevis for 105 days p.i. (combined data for infections at 15, 20 and 25°C; sample sizes 60 hosts, 396 parasites; lines are best fits from linear models). Parasite total body length (including haptor) is plotted against: (A) body length (excluding the haptor), (B) body area, (C) total hamulus length (see text for measurement criteria). Curved functions were significantly better fits than linear relationships in (B) and (C) (see text). In (C), note the group of points displaced below the curved relationship followed by the majority of the overall population: these represent worms stunted in development at 20°C (see text and Fig. 4).

Effects of environmental factors on parasite growth
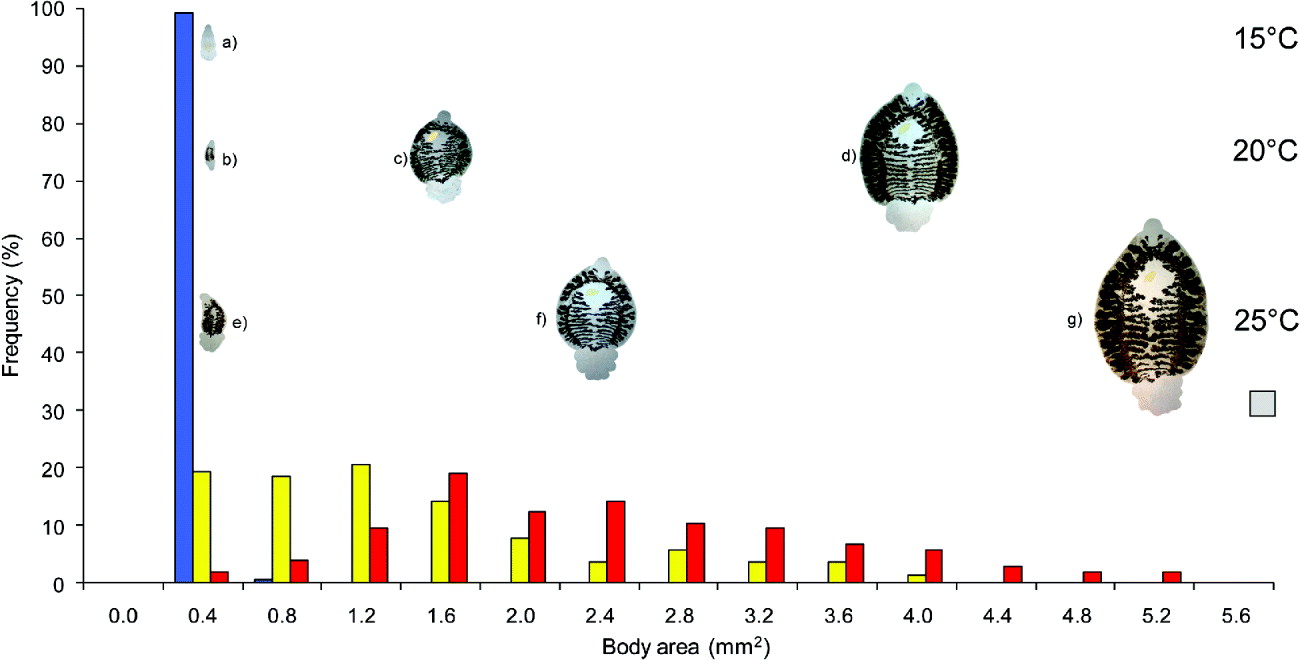
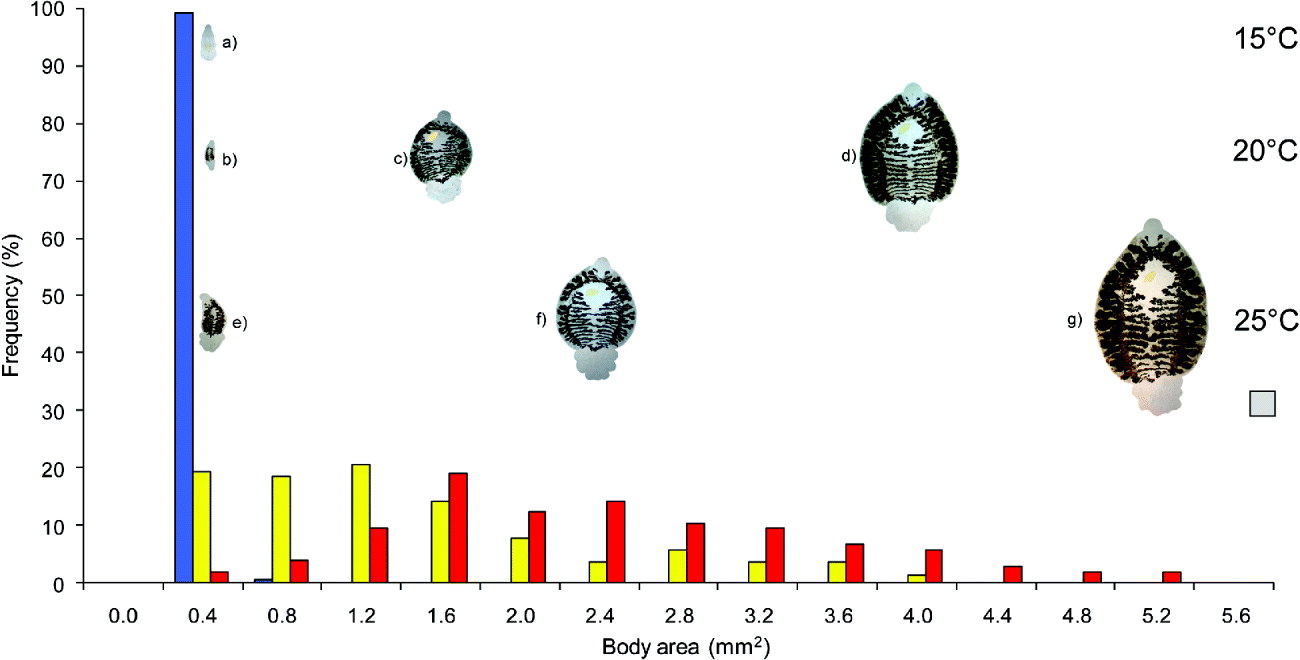
Parameter estimates from model outputs are shown in Table 1. Frequency distributions of body size metrics are illustrated in Figs 2, 3 and 4 with photographs of representative parasite individuals reproduced to scale to reflect developmental variation. (In a few cases of poor image quality of the worm of the specific size, the nearest worm to that size is shown.) Parasite body area varied from 0·02 mm2 to 5·02 mm2, with an overall mean of 1·04 mm2 (±0·058, n=403). Temperature had a major effect on body area; cooler temperatures significantly curtailed growth (Fig. 2, χ 2=11·91, d.f.=1, P<0·001). Parasites infecting hosts maintained at 15°C were very small: mean body area 0·103 mm2 (±0·005 s.e., n=160). The 5°C increase from 15 to 20°C resulted in more than a 10-fold increase in parasite size: mean area 1·22 mm2 (±0·080 s.e., n=138 at 20°C). The further increase from 20 to 25°C resulted in almost another doubling of body area: mean 2·24 mm2 (±0·106 s.e., n=105 at 25°C).
Histograms showing frequencies of body areas of Protopolystoma xenopodis developing in experimental infections of Xenopus laevis for 105 days p.i. at 15°C (blue bars), 20°C (yellow) and 25°C (red). Mean body area differed significantly between temperature treatments (see text). Images of worms are photomicrographs of formalin-fixed, unstained individuals selected to show representative sizes and positioned above the centre of their respective body area ranges. Worms with areas illustrating (a) the mean at 15°C, (b) minimum at 20°C and (e) minimum at 25°C show that individuals in this size class (⩽0·4 mm2) occur at all 3 temperatures; (c) mean, (d) maximum body area at 20°C; (f) mean, (g) maximum body area at 25°C. Sample sizes for 15, 20 and 25°C: 160, 138, 105 respectively. Scale box for all parasite specimens 0·25 mm2.
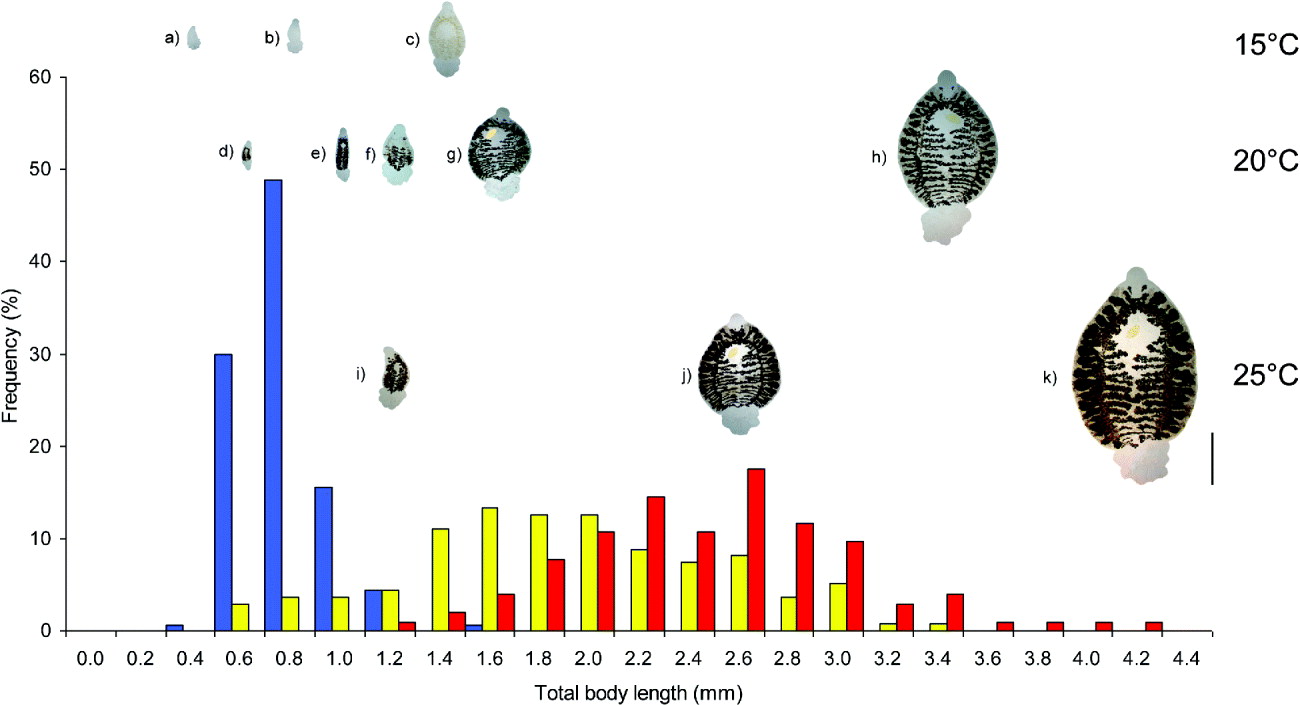
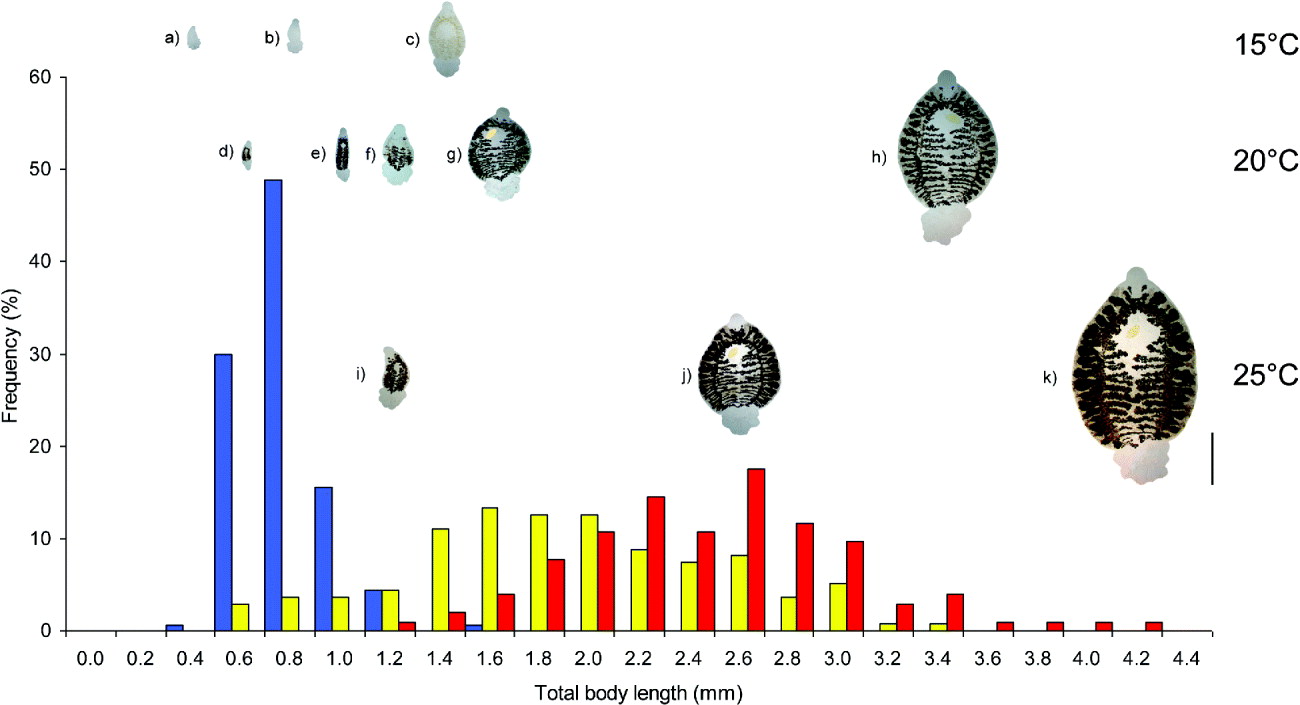
Histograms showing frequencies of total body lengths of Protopolystoma xenopodis developing in experimental infections of Xenopus laevis for 105 days p.i. at 15°C (blue bars), 20°C (yellow) and 25°C (red). Mean length differed significantly between temperature treatments (see text). Images of worms are photomicrographs of formalin-fixed, unstained individuals selected to show representative sizes and positioned above the centre of their respective length classes: worms with (a) minimum, (b) mean, (c) maximum total body length at 15°C (n=160); (d) mean, (e) maximum amongst a subset of the population at 20°C with stunted development (see text) (n=20); (f) minimum, (g) mean, (h) maximum amongst the majority of the population at 20°C with normal development (n=114); (i) minimum, (j) mean, (k) maximum at 25°C (n=103). Note pale intestinal contents in worms at 15°C compared with brown/black guts of all those at 20 and 25°C; the 2 largest worms at 20 (g, h) and 25°C (j, k) are sexually mature (single yellow egg visible in fore-body), others immature. Scale bar for all specimens=50 μm.
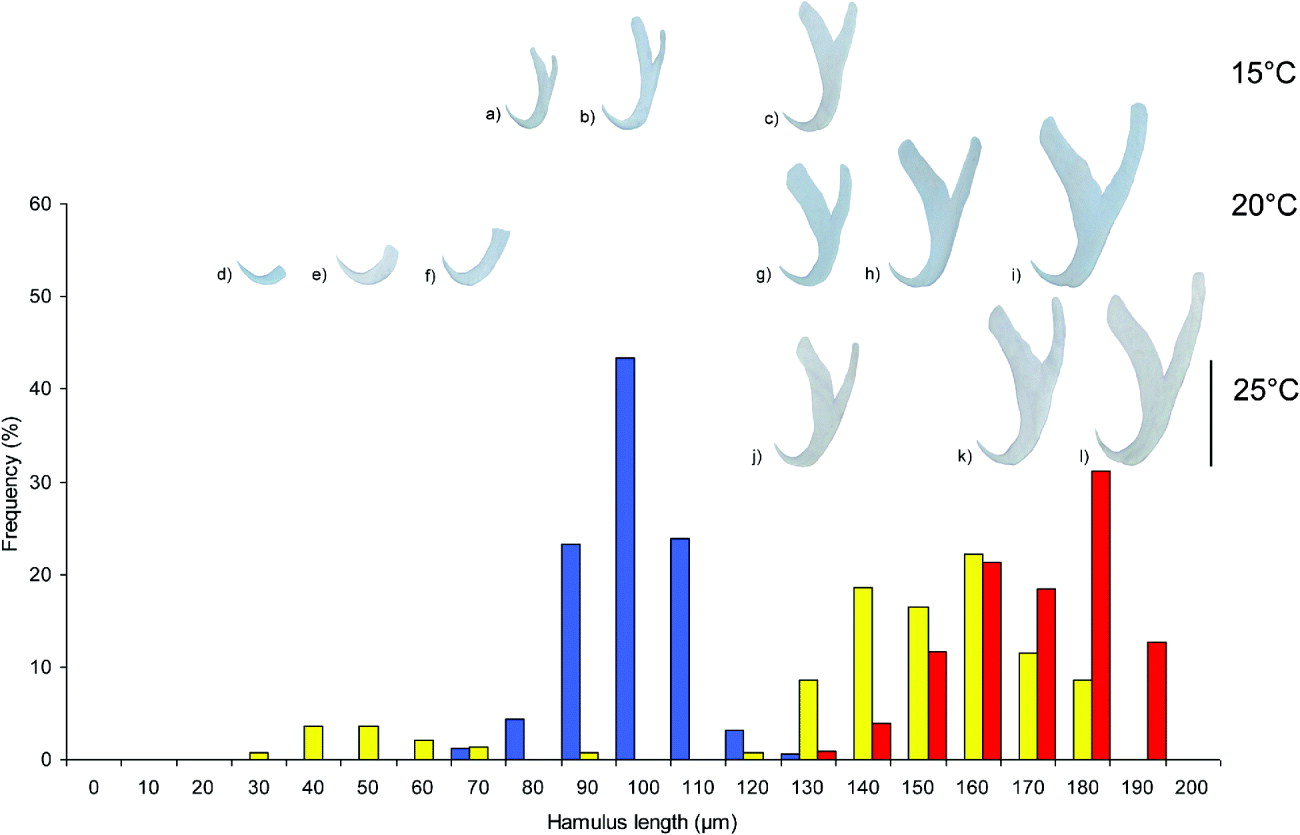
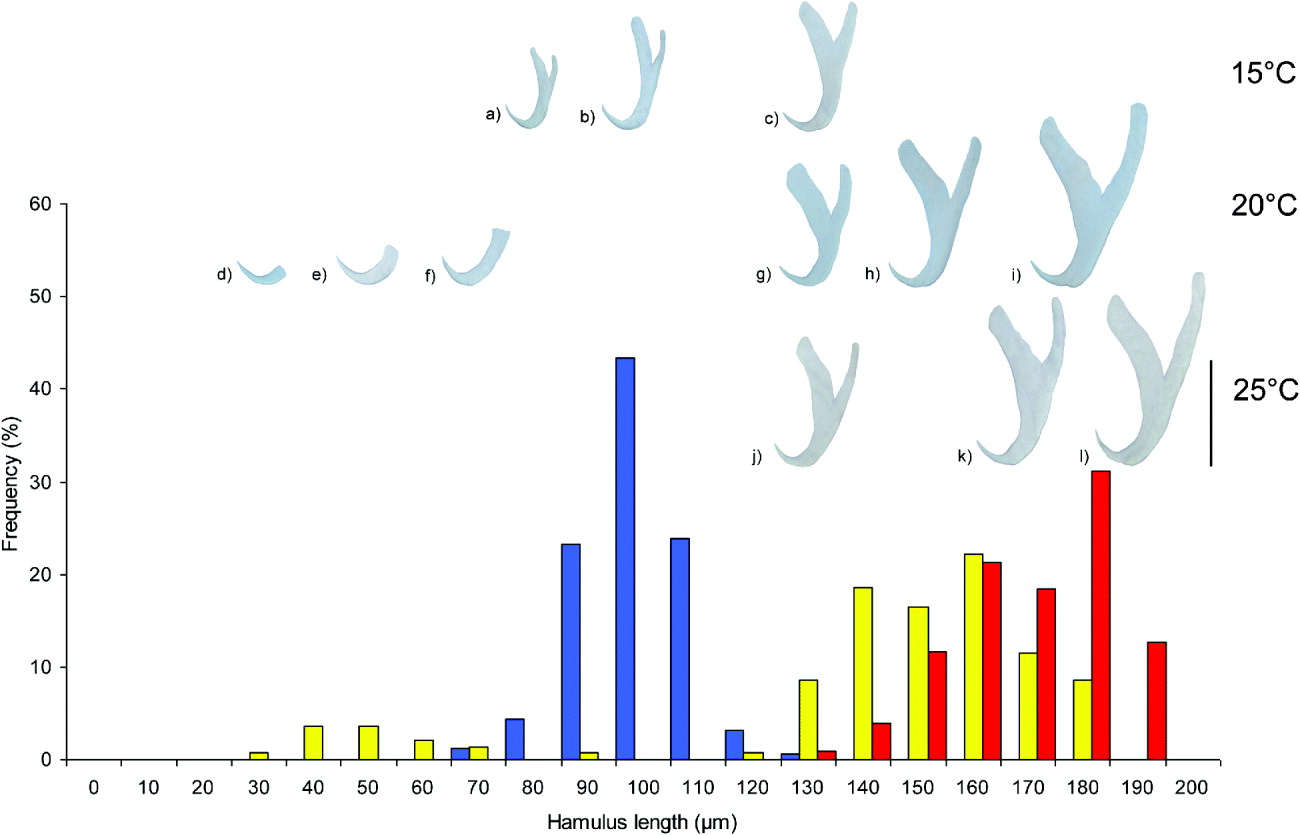
Histograms showing frequencies of total hamulus lengths in Protopolystoma xenopodis developing in experimental infections of Xenopus laevis for 105 days p.i. at 15°C (blue bars), 20°C (yellow) and 25°C (red). The distribution at 20°C is bimodal with a subset of worms having hamuli 29–85 μm long and others 120–180 μm long. Mean hamulus length differed significantly between temperature treatments (see text). Images of hamuli are taken from photomicrographs of formalin-fixed, unstained individuals selected to show representative sizes and positioned above their respective length classes. Hamuli illustrating (a) minimum, (b) mean, (c) maximum at 15°C (n=159); (d) minimum, (e) mean, (f) maximum amongst a subset of the population at 20°C with stunted development (n=20), and (g) minimum, (h) mean, (i) maximum with normal development at 20°C (n=118); (j) minimum, (k) mean, (l) maximum at 25°C (n=103). Hamuli of stunted worms at 20°C are distinguished by little growth proximal to the point and lack division of roots compared with all others that have bifid shafts and separate dorsal and ventral roots. Scale bar=100 μm.
Significant parameter estimates for correlates of parasite body size metrics

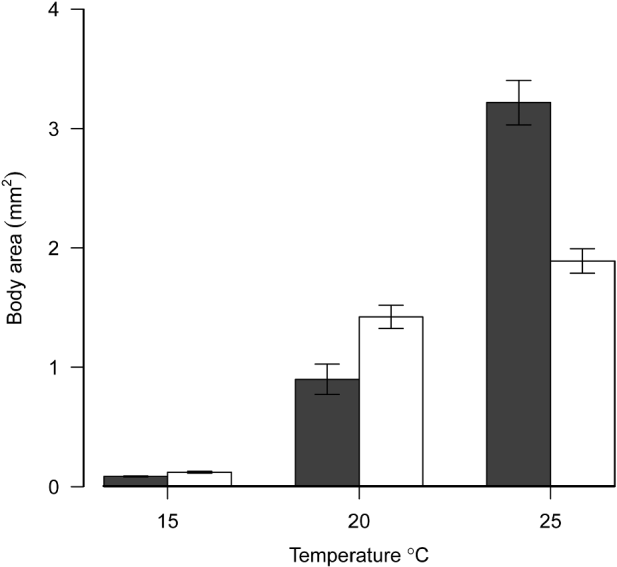
Host sex influenced parasite body area but the effect was inconsistent across the temperatures (Fig. 5). At 15 and 20°C, parasites in male hosts were larger than those in females, whereas at 25°C mean body area of parasites in males was less than that in females. Considering the data for each temperature separately, there was strong statistical support for these differences in parasite size between the host sexes (15°C, χ 2=8·31, d.f.=1, P=0·004; 20°C, χ 2=5·94, d.f.=1, P=0·015; 25°C, χ 2=5·52, d.f.=1, P=0·012). Nevertheless, due to the order of model simplification when analysing the whole data set, this differential effect of sex at the 3 temperatures was not significant across the entire experiment (Sex * Temperature interaction, χ 2=1·384, d.f.=1, P=0·240). The 25°C data were based on a skewed host sex ratio: 4 females, 16 males (gender was unknown at the time of exposure). The comparison, although statistically significant, could have been biased by the chance occurrence of a few very susceptible individuals. This aside, averaging all the data across the 3 temperatures, parasites infecting male hosts were 1·8 times larger than those in females (s.e. range: 1·46 to 2·14 times, χ 2=8·37, d.f.=1, P=0·004).
Variation in body size of Protopolystoma xenopodis according to host sex. Parasite size (expressed as area) after development of experimental infections for 105 days p.i. in male (light bars) and female (dark bars) Xenopus laevis at 15, 20 and 25°C. Bars show means ±s.e. of raw data. Between-sex differences at each temperature are significant (see text); worm/host sample sizes: 72/8♂, 87/10♀ at 15°C, 83/13♂, 51/9♀ at 20°C, 76/16♂, 27/4♀ at 25°C.

Parasite size was not significantly correlated with infection intensity per host (χ 2=0·872, d.f.=1, P=0·350). Host weight was positively correlated with parasite body area: parasites grew largest in heavier toads (χ 2=7·62, d.f.=1, P=0·006). The relationship was investigated between parasite growth (body area) and 2 indices of host condition: fat body weight and gonad weight. Hosts with heavier fat bodies had smaller parasites (χ 2=5·25, d.f.=1, P=0·022). In contrast, host gonad weight did not significantly co-vary with parasite body area (χ 2= 0·37, d.f.=1, P=0·543). However, fat body and gonad weight are correlated with host weight (r=0·89, r=0·69 respectively), making assessment of their individual effects on parasite growth difficult.
Equivalent analysis was extended to total body length and hamulus length as measures of parasite size (Figs 3, 4). Parameter estimates differed slightly, but the broad trends were consistent with those described above (Table 1). The only exceptions were that host body weight and fat body weight had only modest and non-significant effects on parasite hamulus length. The effect of temperature on these metrics concurred with that recorded for body area: thus, the 5°C difference from 15 to 20°C was accompanied by >300% increase in body length and total body length, but the further 5°C change from 20 to 25°C was accompanied by increase of only about 30% (mean total body length 0·65 (±0·24 s.d.) mm at 15°C, 1·94 (±0·51 s.d.) mm at 20°C, 2·38 (±0·56 s.d.) mm at 25 °C). Twenty parasites infecting 8 toads maintained at 20°C had unexpectedly small size; this was particularly obvious in the distribution of hamulus lengths (Figs 1C and 4). Removing these individuals from the above analyses did not qualitatively influence the parameter estimates nor the significance of model terms.
Within-population variation and growth retardation
Within each temperature group there was typically very wide morphometric variation: compare, for instance, the images of the smallest and largest worms at 25°C (Fig. 2e and g; Fig. 3i and k). Fig. 3 shows that the more-or-less normal distributions of total body lengths at 20 and 25°C span the major part of the entire range (although the curves are staggered by 0·8–1·0 mm and maximum size at 25°C exceeds that at 20°C by >20%). In Fig. 4, however, the variation in hamulus lengths at 20°C is bimodal with one subset having a mean and range about 100 μm shorter than the other. The smaller subset is identified in Fig. 1C (total body lengths ⩽1 mm, hamulus lengths mostly ⩽65 μm) as having a growth pattern that does not fit that of the rest of the experimental infections. Although body size is very small, this group is not distinguished in Fig 1A and B because of wide overlaps in length and area metrics. However, hamulus development provides unambiguous identification. Hamulus lengths in the small 20°C worms were typically around 30–45 μm with a few examples 60–85 μm (overall mean 48 μm) (Fig. 4d–f). Mean length amongst the major subset of worms at 20°C was 149 μm (range 121–180 μm) (Fig. 4g–i). Hamuli in the small 20°C worms were shorter even than in the population that developed at 15°C (mean 95 μm, range 69–123 μm, Fig. 4a–c)), and actually closer in size and developmental stage to those in worms at 10°C (mean 50 μm, see below).
The sequence of stages in Fig. 4d–f and a–c shows that hamulus length increase involves elongation of the shaft followed by divergence of dorsal and ventral roots. All worms that developed at 15 and 25°C and the subset of larger worms at 20°C had hamuli with well-developed separate dorsal and ventral roots (e.g. Fig. 4a–c and g–l) and differed from one another mainly by temperature-related size (compare means illustrated by Fig. 4b, h, k). The group of small worms at 20°C is distinctive in that hamulus shafts remained short without division of roots (Fig. 4d–f), reflecting a much earlier stage in development.
In the early stages of normal growth in the kidneys, the haptor develops 6 muscular suckers. These were present in all worms at 15°C but had not completed development in the small 20°C worms: in most cases, the 1st (posterior) pair was recently formed, the 2nd beginning to differentiate and the 3rd entirely undeveloped. This combination of characteristics of body size, hamulus length and shape, and sucker formation, suggests severe growth stunting in this subset of worms.
The stunted worms at 20°C differed from those of similar size that developed at 15°C in the appearance of their intestinal tracts. Digestion in P. xenopodis results in accumulation within the gut caeca of brown-black pigments, principally haematin, the products of intracellular breakdown of host blood (Tinsley, Reference Tinsley1973). In worms at 15°C (and also at 10 °C), the gut was typically cream-coloured or pale pink (Fig. 6A) suggesting reduced digestive activity at low temperatures. In the stunted worms at 20°C, the gut appearance (Fig. 6B) resembled that of the other worms at 20 (Fig. 6C) and 25°C with the red-brown digestive caeca lined by a haematin-laden gastrodermis reflecting active blood intake, digestive breakdown and accumulation and expulsion of residues.
Photomicrographs of Protopolystoma xenopodis in experimental infections of Xenopus laevis, showing longitudinal intestinal branches leading into transverse caeca lined by gastrodermal cells involved in intracellular digestion of host blood. Worms are unstained preparations in which body parenchyma appears light blue. In (A), following development at 15°C, the gut is pale with little accumulation in the lumen or gastrodermis of breakdown products of blood digestion. In (B), stunted worm developing at 20°C shows correlates of active digestion including intracellular accumulation of haematin; despite retarded growth, its gut activity resembles that of worms developing normally at 20°C (C) and at 25°C. Images show transverse width in the same mid-body region of the 3 worms at the same magnification (scale bar 0·1 mm); (A) and (C) are the worms with average body size for their groups (15 and 20°C) relative to the body width of the small stunted worm in (B).

The origin and host distribution of the parasites displaying the stunted phenotype was also distinctive. They were encountered only in hosts maintained at 20°C (and not in those at 15 and 25°C infected at the same time) and only from experimental infections using larvae of S. African origin. Almost exclusively, they were restricted to the progeny of a single pairing of S. African hosts (Sib 17). There were 3 exceptions: stunted worms were found in 2 hosts (one in each) of Welsh origin, and in 1 host (5 worms) from a different pair of S. African parents. With these exceptions, stunted worms were not found in over 160 experimental infections generated under identical conditions using larvae (20 per exposure) from the S. African ‘egg factory’ in other combinations of lab-raised Welsh or S. African hosts. Experimental infections using larvae hatched from an egg factory of Welsh X. laevis also never produced stunted worms (over 120 exposures, 20 larvae/host), including Sib 17 S. African hosts (20 exposures at 20°C).
Within the Sib 17 infections of S. African origin (the focus of this account), stunted worms were found in 8 out of 22 exposed hosts. In all cases, the stunted worms were recovered in the kidneys of host individuals that also carried normally developing worms in the urinary bladder. These latter had body areas at least twice, and as much as 10 times, larger than the stunted worms in the kidneys of the same host (see representative body areas in Fig. 2, also lengths in Fig. 3). So, the stunted worms formed a discrete group and in no case were they part of a continuum of sizes in which they were simply the smallest of a wide range.
Parasite growth and development at low temperatures
Parasites from hosts maintained at 10°C represented growth attained by 150–180 days p.i. Although development is not directly comparable with that at the higher temperatures (observed after a shorter period), the haptor remained at a very early juvenile stage: the smallest worms had no suckers (only the beginnings of sucker musculature forming around the marginal hooklets); other worms had the first pair of suckers developed, the second in early formation, and the third not yet visible; the largest had 2 pairs of suckers and the third developing. Hamulus lengths ranged from 15 μm (little extension anterior to the point) to 77 μm (in which the roots were just beginning to divide), mean 50 μm. The gut was branched but showed little haematin accumulation (reflecting low digestive activity).
Effects of temperature on time to patency
At the endpoint of the trial, microscope preparations showed that all worms at 15°C had immature reproductive systems. Experimental infections developed to the stage of egg production within the 105-day duration only at 25 and 20°C. The first host individual became patent at 51 days p.i. at 25°C compared with 73 days at 20°C. Median time to patency was 57·5 days at 25°C (n=17) and 91·0 days at 20°C (n=21). Survival analysis demonstrated a significant difference in the rate of progression to patency at the 2 temperatures (χ 2(df=1)=8·76; P=0·003).
At 25°C, 16 of the 20 hosts originally exposed had developed patent infections by the termination date and 1 surviving infection remained non-patent. The other 3 hosts were uninfected at dissection. At 20°C, only 13 of the exposed hosts (n=22) had developed patent burdens, and there were 8 hosts carrying infections that had not yet become patent; the remaining host was parasite-free.
DISCUSSION
General characteristics
As in all other parasites of ectotherm vertebrates, life-cycle processes of P. xenopodis are temperature dependent. This investigation, using host and parasite material derived from the field and maintained under controlled conditions in the laboratory, calibrates the dominant impact of temperature on a series of events. Tinsley et al. (Reference Tinsley, York, Everard, Stott, Chapple and Tinsley2011) showed that low temperatures inhibit egg development and extend hatch time; the present study demonstrates continuing in-host effects that retard post-larval development and the schedule of migrations, restrict body size and delay the onset of patency. From knowledge of basic biological functions, these thermal effects are predictable for an African parasite in a cool north temperate environment. However, the present study is distinctive in providing empirical data to quantify the constraints in an environmentally relevant context. Results also demonstrate a series of general features. (i) For all parameters measured, there is considerable within-population variation in schedules. For instance, amongst experimentally infected hosts maintained at 25°C, patency in the fastest developing burdens began at 7·5 weeks, but the slowest developing infection was still not patent after 15 weeks. (ii) The extent of variation in schedules increases with reduction in temperature. So, not only are events delayed at lower temperatures, the wider variation between individuals results in even longer delays for a proportion of the population. (iii) Relationships between temperature and certain life-history characteristics are non-linear. There is a threshold near to 10°C at which development is very slow (kidney to bladder migration not complete >1 year p.i.). From 15 to 25°C, there is a strong positive relationship with temperature, but body size characters show greater proportional increases between 15 and 20°C than between 20 and 25°C (e.g. body area increasing by 10× and 2× with these respective 5°C shifts, see above). (iv) Low temperature inhibition of parasite development imposes long interruptions on life-history schedules. Thus, worms unable to reach maturity by the end of the summer may be held in check until the following summer; larval invasion terminated by arrest of egg hatching in September does not resume until the next July (see Tinsley et al. Reference Tinsley, York, Everard, Stott, Chapple and Tinsley2011). (v) While temperature represents a dominant effect on life-cycle processes, operating – in this ectotherm vertebrate system – on parasite stages both external and internal to the host, the present experiments also indicate effects attributable to genetic variation in hosts and parasites and the interaction between the two.
The context of environmental conditions affecting infection
Temperature
Regarding (ii)–(iv) above, the temperature logger, located on the mud substrate, is likely to represent the minimum of the range actually experienced by parasites developing within infected hosts. Hosts occur on the pond bottom both when inactive and when feeding on benthic invertebrates (see Measey and Tinsley, Reference Measey and Tinsley1998), but internal body temperature may increase periodically when X. laevis are active in the surface water. The parasites benefit from their location within a mobile habitat for which host behaviour determines actual thermal environment. In ponds with a covering of vegetation, animals may ‘hang’ from the surface with nostrils exposed where they are hidden from aerial predators (Tinsley, Reference Tinsley, Hubrecht and Kirkwood2010). Their physiology (including digestion) – and the physiology of their parasites (including development) – is influenced by warmer conditions at these times. Spot-checks in mid-summer showed that P. xenopodis may experience temperatures near to and above 20°C at times when hosts move into surface water.
During winter there is typically limited thermal stratification and X. laevis show reduced activity in the bottom mud (Tinsley and McCoid, Reference Tinsley, McCoid, Tinsley and Kobel1996). Therefore, the records of low temperature periods at the pond are likely to represent closely the conditions experienced by both off-host and within-host parasite stages.
Host×parasite interactions
Regarding (i) and (v) above, experiments were carried out on a single sib-ship of hosts, laboratory raised from S. African hosts, in order to limit variation in host genotype effects on parasite survival and development. Data relate to infections using a single source of eggs of P. xenopodis from the same wild-caught population as the sib-ship parents. The infection protocol was designed to ensure first, that all animals were exposed under comparable conditions to produce equivalent initial parasite populations, and second, that hosts were transferred with minimum delay to their final temperature. This was intended to reduce the period for recognition and response by the host at the exposure temperature (and, potentially, the period for adaptation by the parasite) before experience of the immune environment characteristic of the test temperature. Despite this design, the data are characterized by considerable between-host and within-host variation.
Effects of temperature on parasite growth and development
The experimental infection data provide snapshots of the effects of temperature on migration from the kidneys, the site of initial development, to the urinary bladder where P. xenopodis reaches sexual maturity. In the present studies with a 15-week end-point, migration was complete at 25°C, almost complete at 20°C, and in mid-progress at 15°C. With further reduction to 10°C, progression to the point of migration may not begin until about 6 months p.i. and may still not be complete after more than 1 year. In laboratory infections maintained for 150–180 days p.i. at 10°C, most of the parasite population reached a stage where haptoral suckers were still not completely differentiated and the mean hamulus length was only about 50 μm; this equates to the development of worms 3–4 weeks p.i. at about 20°C (unpublished observations). So, P. xenopodis can survive for prolonged periods at low temperatures and development is not arrested, but life-cycle progress is disproportionately slow compared with that achieved at 5–10°C higher.
Effects of internal environmental factors on parasite growth and development
Host factors
There is wide-ranging evidence for host gender-related effects on parasites, including differences in infection levels (Krasnov and Matthee, Reference Krasnov and Matthee2010). In a meta-analysis of nematodes and cestodes, mainly in mammals, Poulin (Reference Poulin1996) identified a small but significant host gender difference in parasite size, with worms larger in male than in female hosts. The present data show the same overall effect in an amphibian/monogenean system but this is complicated by a significant reverse direction at 25°C. It is possible that chance differences in host susceptibility were responsible in the unbalanced sex ratio at 25°C. Alternatively, the gender effects may indeed change at the highest temperatures which enhance both reproductive activity and immune defences in this amphibian (Tinsley, Reference Tinsley, Hubrecht and Kirkwood2010). Nevertheless, in the entire data set of 60 hosts and over 400 parasites, the presence of significantly larger worms in male hosts (by a factor of 1·8) may have implications for differences in nutrient removal and, potentially, in pathogenic effects between the host sexes (see below).
Parasite factors
Given the very wide developmental variation within the 3 experimental populations, ecological theory would predict an effect of parasite density on growth rates. Indeed, worm burdens in these laboratory infections are high relative to those typically encountered in nature (see Tinsley, Reference Tinsley, Thomas, Renaud and Guégan2005): this should increase the rigor of tests of crowding effects on parasite size. However, the data demonstrate that density does not represent a significant factor contributing to variation in the parameters assessed.
Host×parasite interactions
For certain outcomes, the potential effects on parasite growth are best interpreted as interactions of host and parasite factors. Previous studies on this Protopolystoma – Xenopus system have demonstrated powerful influences of host genotype×parasite genotype interactions measured by host susceptibility/parasite infectivity (Jackson and Tinsley, Reference Jackson and Tinsley2003, Reference Jackson and Tinsley2005; Jackson et al. Reference Jackson, Pleass, Cable, Bradley and Tinsley2006). The present study extends evidence to morphometric effects.
The positive relationship in this system between host body weight and parasite size (measured as area) parallels the findings of Barber (Reference Barber2005) with experimental infections of Schistocephalus solidus in Gasterosteus aculeatus. For this cestode, faster growing hosts (assessed by body weight increase) supported a larger total weight of parasites. As in the present studies, Barber's experimental design aimed to reduce effects of genetic variation (including use of progeny of a single selfed parasite in infections of laboratory raised sticklebacks). Nevertheless, there was very wide between-host growth variation, with a 120-fold range in tapeworm mass at the end of the study. These differences were considered most likely to be due to differential host responses to infection (Barber, Reference Barber2005).
The negative relationship, in the present experiments, between host energy reserves and parasite size (hosts with heavier fat bodies had smaller parasites) may be interpreted in 2 ways, as effects of host immunity or parasite pathology. Hosts in superior condition (with surplus energy) may be better able to respond immunologically, compromising the growth of their parasites. Alternatively, parasites achieving larger size may impose a greater cost on their hosts, depleting host energy reserves. These alternative interpretations cannot be resolved in the present analysis.
Data recorded in Figs 2 and 3 emphasize the very considerable range of endpoints for growth within the respective populations at 15, 20 and 25°C. Since a series of potential external and internal environmental and parasite effects can be excluded (see above), a major influence on the growth (and size) differences at each temperature is likely to be variation at the level of infectivity/susceptibility of individual parasites and hosts (i.e. compatibility). A special case of this is represented by the cohort of worms showing stunted development at 20°C. This cannot be interpreted primarily as a general host effect: each host individual carrying stunted worms also carried others with a normal growth phenotype from the same experimental exposure, developing in the same host environment. Equally, this is not primarily a parasite effect: with very few exceptions, affected worms occurred only in a single sib-ship of host. So, it is likely that the phenomenon represents a genotype-specific interaction between host and parasite. It may have resulted from the presence of a parasite genotype in the wild parasite population sample (the egg factory) employed for the experimental infections that has poor compatibility with the genetic constitution of Sib 17 hosts. The existence of this parasite type within the original host population might predict that there were other host genotypes in that South African population in which the parasite could perform well. With very few exceptions, stunted worms did not appear in the limited number of other host sib-ships tested, but this could be explained by the opposite possibilities: either that they grew normally or that they died in these other host families.
Previous experimental studies of mixed species infections of Protopolystoma have recorded instances of extreme retardation of development and within-host migrations similar to those in the present stunted worms. These have been interpreted in terms of competitive effects (Jackson et al. Reference Jackson, Tinsley and Hinkel1998, Reference Jackson, Pleass, Cable, Bradley and Tinsley2006). Thus, amongst a series of different outcomes influenced by factors including host and parasite genetic variability, one species may remain in an arrested stage within the kidneys while the interacting (superior) species occupies the urinary bladder; in other circumstances, an incoming secondary infection may be associated with expulsion of existing parasites from that host. These and the present studies indicate that the Protopolystoma – Xenopus system provides a highly sensitive model for understanding micro-level controls on parasite infection.
The gut morphology of worms at 10 and 15°C was characterized by diffuse pale contents and a lack of brown/black pigment suggesting low metabolic activity. So, slow growth (small size at termination) is likely to be related to low temperature effects on food intake and digestion. By contrast, the guts of stunted worms at 20°C (of even smaller size than those at 15 °C) had correlates of active digestive function, including haematin-laden gastrodermal cells, comparable with those of worms showing more rapid growth at 20 and 25°C. It is possible, therefore, that poor growth in the cohort of stunted worms occurs in spite of high nutrient intake and reflects diversion of energy and products away from growth to other processes. In nematodes, a similar effect has been attributed to immune-mediated damage and the cost of repair in worms that show suboptimal performance in resistant hosts (Wilkes et al. Reference Wilkes, Thompson, Gardner, Paterson and Viney2004; Viney et al. Reference Viney, Steer and Wilkes2006). If applicable to P. xenopodis, this may indicate that part of the parasite population, infecting putatively incompatible hosts, experiences costs of infection that are greater than those imposed by a 5 or even 10°C decrease in temperature.
In genetically more diverse host and parasite populations in nature, it could be expected that developmental variation may be even greater than that shown in the present experiments. Parasite size, assessed here at a specific time point, may be correlated with pathogenic effects on the host (extent of tissue damage including blood removal), transmission schedules (including period to patency), contribution to parasite reproduction (including body size-related egg output rates). The variation recorded in these infections of full-sib hosts (for instance, body area of worms at 25°C differing by a factor of >10, see Fig. 2) provides a minimum indication of the heterogeneity that must exist in infection outcomes in the wild.
Effects of temperature on period to parasite maturation
In the present combination of host sib-ship and parasite isolate, no infections developed to maturity within the 15-week time frame at constant 15°C. The minimum time to patency at 20°C was about 10·5 weeks p.i., close to the minimum of 9 weeks recorded at the same temperature by Jackson and Tinsley (Reference Jackson and Tinsley2001). With a 5°C increase in temperature, minimum time to patency was reduced by about 30%. In these data, patent period relates to the onset of egg production by the first individual worm in the first patent host, but there was considerable between-host variation. Comprehensive consideration of reproductive performance, including times to maturity and rates of egg production, is included in a further paper (Tinsley et al. manuscript in preparation).
The limited data on development at 10°C (with migration still incomplete after >1 year p.i.) add to the evidence that the life cycle of P. xenopodis may operate over very extended time scales in cool climate regions.
There are strong parallels between the temperature effects documented here for the monogenean P. xenopodis and for the digenean Gorgoderina vitelliloba. This parasite of frogs, Rana temporaria native to northern temperate environments, initially invades the kidneys and then migrates to and matures in the urinary bladder. Development and migration are temperature dependent: at low temperatures, juvenile worms may remain in the kidneys for >5 months (Mitchell, Reference Mitchell1973).
Interpretation of life-cycle events in the natural habitat in Wales
Based on knowledge of reproductive biology (reviewed by Tinsley, Reference Tinsley2004, Reference Tinsley, Thomas, Renaud and Guégan2005), it is possible to calibrate a seasonal cycle of parasite transmission in the X. laevis population in Wales. Interpretation relates to the temperature record at this site and summarizes findings on egg development given by Tinsley et al. (Reference Tinsley, York, Everard, Stott, Chapple and Tinsley2011).
Egg production by P. xenopodis can continue throughout the year albeit at very low rates in winter. From about mid-October to late April, output is probably <1 egg/worm/day (the per capita rate <10°C); in summer, the mean maximum is probably about 9 e/w/d (Jackson and Tinsley, Reference Jackson and Tinsley1998; Tinsley et al. Reference Tinsley, York, Everard, Stott, Chapple and Tinsley2011).
The data of Tinsley et al. (Reference Tinsley, York, Everard, Stott, Chapple and Tinsley2011) show that all eggs produced between early August and early April die without hatching. The overall period during which egg production may actually contribute to transmission involves a maximum of 16 weeks. However, output at the beginning and end, in April and late July/early August, has limited impact so the effective duration of reproductive output is only about 10 weeks per year.
With the temperature cycle recorded in 2008, infective larvae may begin to hatch in early July and most invasions occur in the following 2 months until early/mid-September. There may be continuing invasion at a low level until late September but with decreasing viability of worms establishing at low temperatures. At most, host invasion is restricted to about 10 weeks each year (Tinsley et al. Reference Tinsley, York, Everard, Stott, Chapple and Tinsley2011).
For naïve individuals experiencing a primary infection (the design of the present experiments), the first infections to reach patency would require about 9 weeks (data of Jackson and Tinsley, Reference Jackson and Tinsley2001) or 10·5 weeks (this study) at constant 20°C. The field site records show only a few days of temperatures >18°C in 2007 and 2008, so the pre-patent period should typically be much longer. Laboratory infections failed to develop to patency within 15 weeks at 15°C and, although the pre-patent period was not determined at this temperature, all worms had immature reproductive systems indicating that it must be several weeks in excess of the endpoint of the experiments. The trials at 15°C correspond with summer temperatures on the pond bottom (close to the average of 15·5°C recorded for the 3 months June–August in 2008, see Tinsley et al. Reference Tinsley, York, Everard, Stott, Chapple and Tinsley2011). This evidence should exclude maturation of any infections during their first summer season. However, field studies have recorded that some natural infections can become egg producing in late September after invasion earlier in the summer (unpublished observations). These are likely to have originated from the earliest egg hatching, i.e. in early July, suggesting a period to patency of about 12 weeks. The difference between predicted and actual time scales may be related to the periodic movements of X. laevis into warmer surface water during periods of activity, permitting faster parasite development. These data may provide a measure of the impact of host behaviour on parasite life-cycle progress: host transport of parasites into areas of habitat where developmental rates are increased could improve the schedule to maturation by more than 1 month.
By the time these first invasions mature, water temperatures have fallen below 15°C and the pond surface would experience little diurnal warming; as a result, continuing development of worms from later invasions would be much slower. The final stages of maturation of worms invading in mid/late July could perhaps be completed by early/mid-October. All other invasions occurring in August and September will fail to complete development to maturity until temperatures increase again in summer of the following year.
Although it is possible for P. xenopodis to reach maturity within a single summer, all eggs produced by these adults during their first half year of patency will die. Production of eggs that actually contribute to transmission will not begin until the next spring, leading to the earliest invasions from these eggs in early July (i.e. exactly 1 year following host invasion).
These predictions are based on earliest recorded outcomes in experiments (‘best performance’), but a prominent feature of the life-history attributes is the wide variation in population data, including rates of development to maturity (considered in detail by Tinsley et al. manuscript in preparation). Thus, while the first of the experimental infections at 20°C began egg production at 10·5 weeks p.i., over one third of the exposed hosts had still not reached patency after a further 4·5 weeks (see above). With similar variation between individuals at field temperatures, some larvae invading even in early July would not become mature until the following mid-summer. Parasites taking 1 year or more to reach maturity have little or no time for production of eggs that will hatch before the next winter's ‘shutdown’, so their first contribution to onward transmission may be delayed for 2 years p.i. The schedule will be further extended for parasites invading hosts that have already experienced a primary infection. Jackson and Tinsley (Reference Jackson and Tinsley2001) recorded that, in comparison with primary infections, median pre-patent period in secondary infections was delayed by a factor of more than 2 (up to a maximum of 7 months p.i.) at constant 20°C. It is possible that worms showing similar retarded development after invading mid-summer in one year might not reach maturity until at least 2 years later (with their eggs contributing to transmission only after a further year).
These calculations show how the life cycle can be completed in the low temperate regime in Wales, but ‘windows’ of activity are very reduced, time scales for development very extended, and numerical characteristics of transmission very restricted. Parasite egg production rates comparable with those of P. xenopodis are rarely encountered in other host-parasite systems, and delays to maturity by 2 or more years are exceptional even amongst free-living invertebrates. Pre-reproductive mortality during such extended periods must inevitably reduce future transmission. Clearly, parasite life-cycle schedules with these characteristics also rely on relatively long host life span.
ACKNOWLEDGEMENTS
We thank the Thomas and Lewis families, Croescwtta Farm, Vale of Glamorgan, for access to the field site. We are grateful for assistance in the laboratory from Josie Richards, Andy Bond and Rob Pompey.
FINANCIAL SUPPORT
This project was supported by research grant BB/D523051/1 from BBSRC.