Introduction
Ni-based superalloys possess excellent mechanical properties and high resistance to creep and fatigue at high temperatures and are thus widely applied as the key high-temperature parts in aeroengine and turbine blades [Reference Rakoczy, Cempura, Kruk, Czyrska-Filemonowicz and Zielińska-Lipiec1, Reference Huo, Liu, Yang, Li, Hu, Su, Zhang and Fu2]. Hardness is the common index to evaluate the strength, abrasive resistance, and stiffness. Young’s modulus measures the difficulty of elastic deformation of materials. The magnitudes of hardness and Young’s modulus have significant effect on the stability of material in service. Therefore, the comprehensive studies on hardness and Young’s modulus are of great importance for the design of novel Ni-based superalloys [Reference Sun, Kothari and Sun3].
In the experimental aspect, nanoindentation is a common experimental technique to measure the hardness and Young’s modulus of materials in the micro-nano scale [Reference Sun, Kothari and Sun3, Reference Liu, Lin, Lu, Tieu, Zhou and Koseki4]. Thus, the static alloys, together with the nanoindentation technique, are usually utilized to determine the hardness and Young’s modulus in the target alloys [Reference Zhao, Jackson, Peluso and Brewer5, Reference You and Song6, Reference Hu, Zhou, Zhou, Yu and Zhang7, Reference Li, Tu, Liu, Song, Luo, Lei, Sun, Chen and Hu8]. However, it is really a time- and money-consuming process to obtain the composition-dependent hardness of Young’s modulus by using the discrete alloys. By contrast, the diffusion couple/multiple technique [Reference Zhao, Jackson, Peluso and Brewer5, Reference Wen, Tang, Zhong, Zhang, Du and Zheng9, Reference Chen, Zhang, Wang, Chen, Tang, Zhang and Du10] can form the continuous composition region over the diffusion distance after annealing at a certain temperature. Hence, by combining the diffusion couple technique with the nanoindentation technique, the hardness and Young’s modulus along the diffusion path can be effectively measured.
While in the theoretical aspect, first-principles calculations are also utilized to predict some mechanical properties. You and Song [Reference You and Song6] investigated the Young’s moduli of Ti–Nb–Zr alloys with the nominal compositions of Ti24Nb, Ti20Nb12Zr, Ti17Nb21Zr, Ti11Nb38Zr, Ti6Nb53Zr, and Ti70Zr by means of first-principles calculations. Hu et al. [Reference Hu, Zhou, Zhou, Yu and Zhang7] studied elastic properties and hardness of Ru–Ir alloys using first-principles calculations. Li et al. [Reference Li, Tu, Liu, Song, Luo, Lei, Sun, Chen and Hu8] investigated site preference and elastic properties of Ti–Ni–Nb alloys with various compositions by employing exact muffin-tin orbitals method in conjunction with coherent potential approximation. However, it is still challenging to obtain the composition-dependent various properties by using first-principles computations.
Since the pioneering work of Kaufman and Bernstein [Reference Kaufman and Bernstein11], the CALculation of PHAse Diagram (CALPHAD) approach has become a mature tool for establishing the thermodynamic and atomic mobility databases for a variety of commercial materials [Reference Kaufman and Bernstein11, Reference Zhang, Wang, Du, Hu, Nash, Lu and Jiang12, Reference Zhang, Du, Steinbach, Chen and Huang13, 14]. Recently, the CALPHAD approach has also been extended to establish the databases for different thermophysical properties, including elastic coefficient and molar volume [Reference Liu, Zhang, Ganeshan, Wang and Mathaudhu15, Reference Lu, Selleby and Sundman16, Reference Gheribi and Chartrand17, Reference Liu and Oikawa18]. In the spirit of CALPHAD approach, different properties of individual phase can be assessed as a function of composition, temperature, and/or pressure and can be also extrapolated into the metastable range [Reference Kaufman and Bernstein11, Reference Zhang, Stratmann, Du, Sundman and Steinbach19]. Thus, the CALPHAD approach can be applied to model the composition-dependent hardness and Young’s modulus and even develop the hardness and Young’s modulus databases for multicomponent alloys, which can be used for the subsequent material design.
Consequently, fcc Ni–X (X = Rh, Ta, W, Re, Os, and Ir) systems were chosen as the target in this paper. That is because Rh, Ta, W, and Re are the essential additions for the current-generation single crystal Ni-based superalloys, while Os and Ir are the potential substitutional elements for Re in next-generation single crystal Ni-based superalloys [Reference Chen, Zhang and Lu20, Reference Chen, Xiao, Zhang and Du21, Reference Lin, Wei, Li and Zhang22]. The major objectives of the present work are (i) to effectively measure the composition-dependent hardness and Young’s modulus of fcc Ni–X (X = Rh, Ta, W, Re, Os, and Ir) systems in Ni-rich region by using the diffusion couple technique and (ii) to obtain the CALPHAD-type descriptions for hardness and Young’s modulus of fcc Ni–X (X = Rh, Ta, W, Re, Os, and Ir) systems based on the experimental data.
Results and discussion
Experimental results
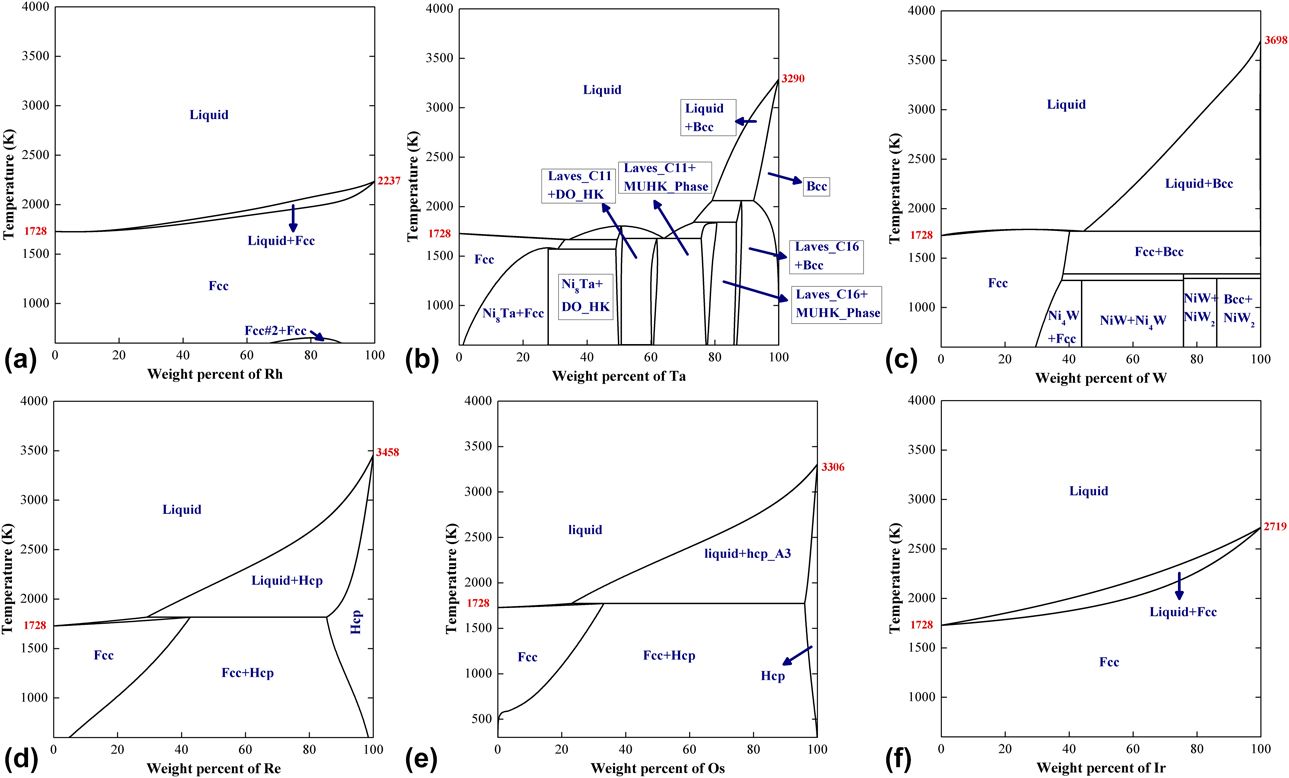
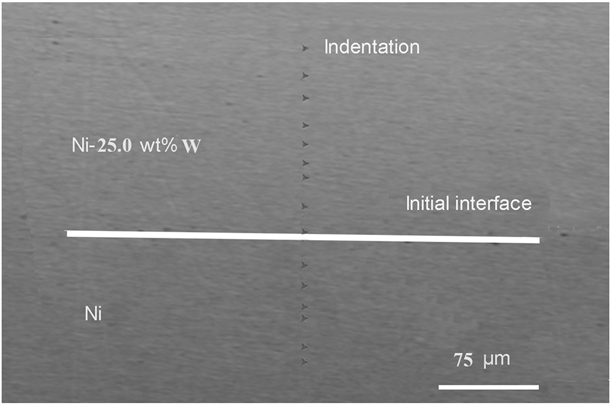
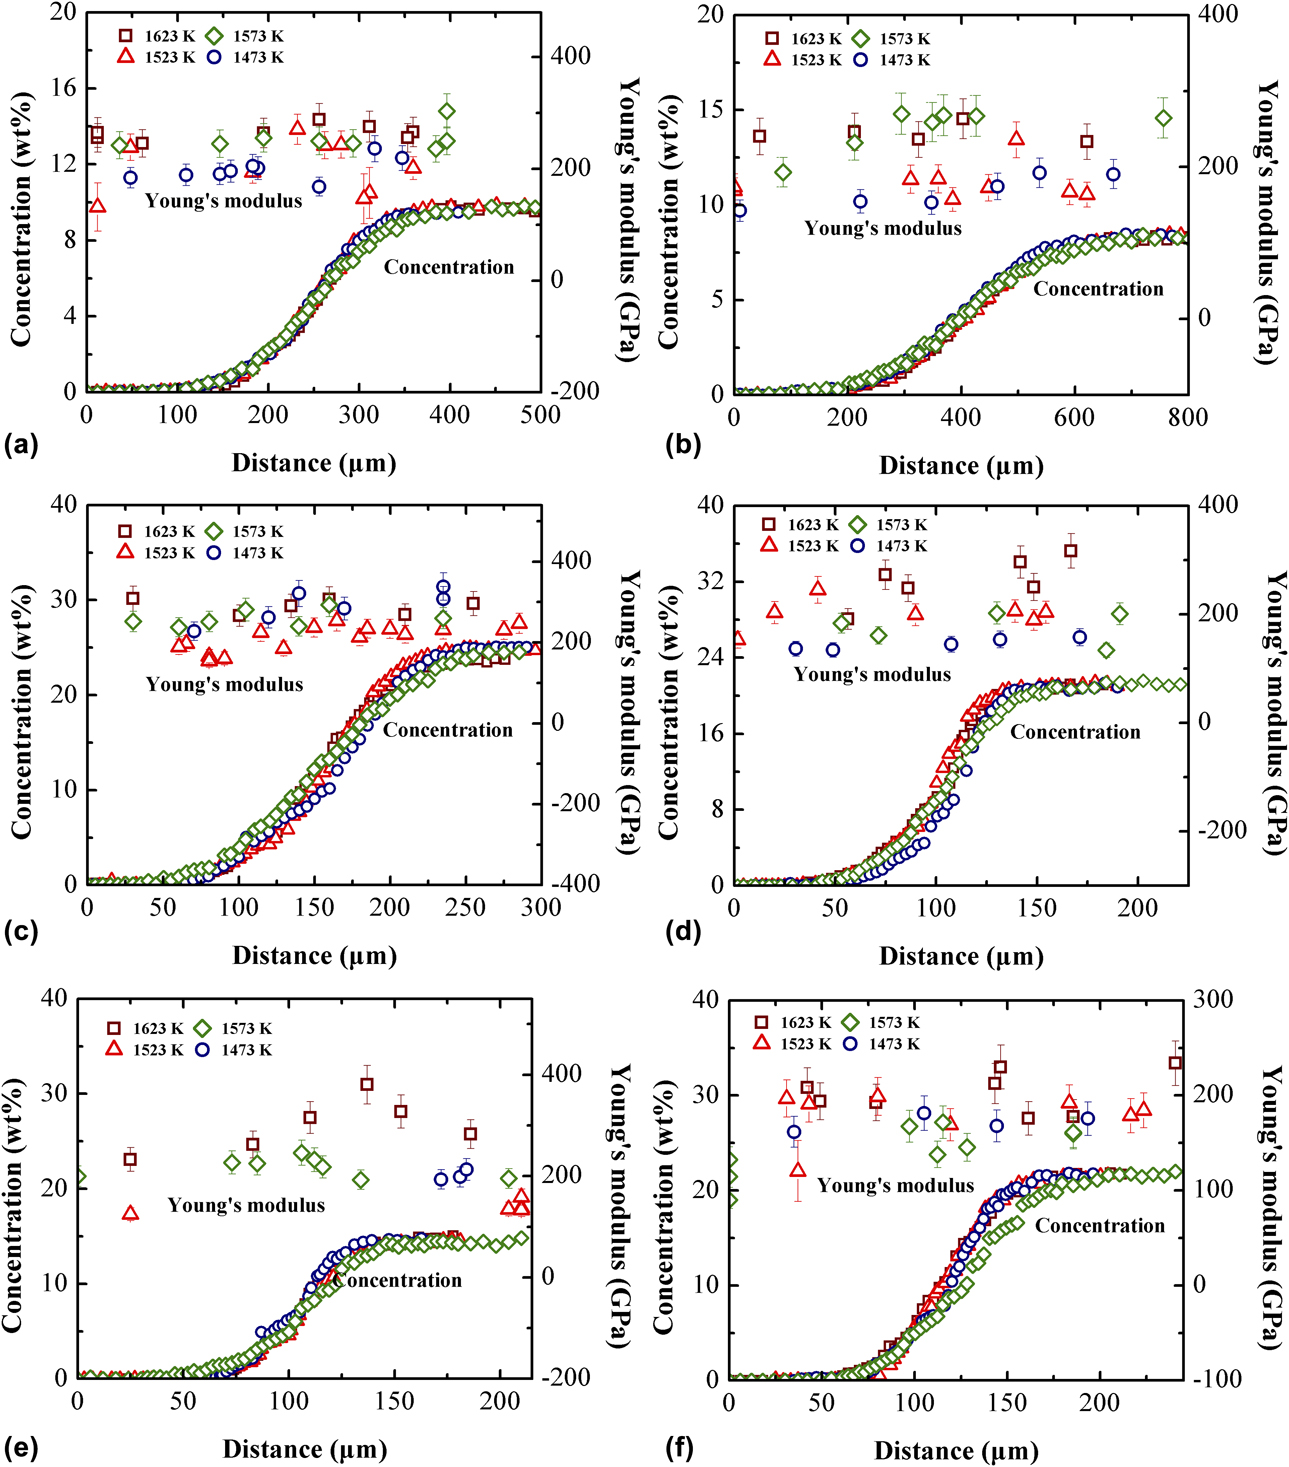
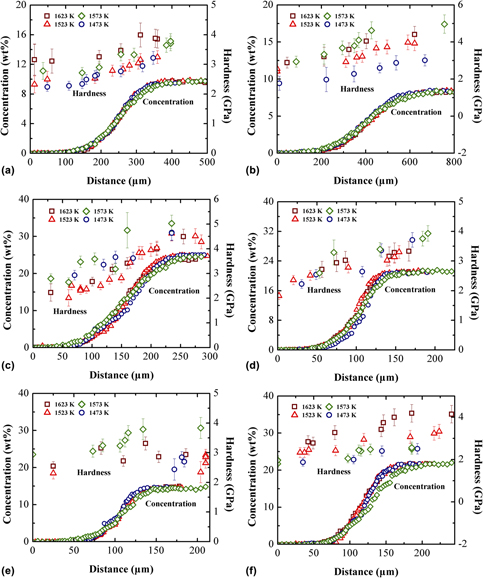
The thermodynamic descriptions for Ni–X (X = Rh [Reference Chen, Zhao, Zhang, Lu and Liu23], Ta [Reference Zhou, Wang, Chen, Liu and Napolitano24], W [Reference Gustafson25], Re [Reference Yaqoob and Joubert26], and Os [Reference Chen, Zhang, Wang, Chen, Tang, Zhang and Du10]) systems were directly taken from the literature reports. All the calculated phase diagrams of binary Ni–X (X = Rh, Ta, W, Re, Os, and Ir) systems are shown in Fig. 1. As can be seen in Fig. 1, fcc phase is stable over the entire composition range in the Ni–Rh and Ni–Ir systems, and it is only stable over a certain composition range in Ni–Ta, Ni–W, Ni–Re, and Ni–Os systems. It should be mentioned that all the prepared Ni/Ni–X diffusion couples locate in the range of stable fcc phases in the Ni–X systems. Hardness and Young’ moduli were measured along the diffusion paths of Ni/Ni–9.7 wt% Rh, Ni/Ni–8.4 wt% Ta, Ni/Ni–25.0 wt% W, Ni/Ni–21.4 wt% Re, Ni/Ni–12.4 wt% Os, and Ni/Ni–21.7 wt% Ir diffusion couples annealed at 1473–1623 K. Taking Ni/Ni–25.0 wt% W diffusion couples as an example, one typical backscattered electron image of indentation along diffusion path of Ni/Ni–25.0 wt% W diffusion couples annealed at 1523 K for 131.4 ks is shown in Fig. 2. The indentations locate along the vertical line of the initial interface. That is to say, hardness and Young’ moduli of alloys with continuously varying composition were determined. The measured concentration profiles, hardness, and Young’ moduli along the diffusion paths in Ni–X (X = Rh, Ta, W, Re, Os, and Ir) systems at 1473–1623 K are presented in Figs. 3 and 4. As can be seen, the hardness and Young’s moduli are clearly concentration dependent. Generally, the hardness increases gradually from the pure Ni region to the Ni–X (X = Rh, Ta, W, Re, and Ir) alloys region, except for Ni–Os system. As shown in Fig. 3, hardness of Ni–Os system seemly has no obvious regularity. In Fig. 4, Young’ moduli change slightly from the pure Ni region to all the Ni–X alloys regions. Besides, it is shown in Figs. 3 and 4 that diffusion annealing temperature has negligible influence on the hardness and Young’ moduli of alloys.
(a–f) Calculated phase diagrams of binary Ni–X (X = Rh, Ta, W, Re, Os, and Ir) systems according to the thermodynamic descriptions by Refs. 10, 23–26.

Backscattered electronic image of indentation along the diffusion path of Ni/Ni–25.0 wt% W diffusion couple annealed at 1523 K.

Concentration profiles and hardness along the diffusion paths of (a) Ni/Ni–Rh, (b) Ni/Ni–Ta, (c) Ni/Ni–W, (d) Ni/Ni–Re, (e) Ni/Ni–Os, and (f) Ni/Ni–Ir diffusion couples annealed at 1473–1623 K.

Concentration profiles and Young’s moduli along the diffusion paths of (a) Ni/Ni–Rh, (b) Ni/Ni–Ta, (c) Ni/Ni–W, (d) Ni/Ni–Re, (e) Ni/Ni–Os, and (f) Ni/Ni–Ir diffusion couples annealed at 1473–1623 K.

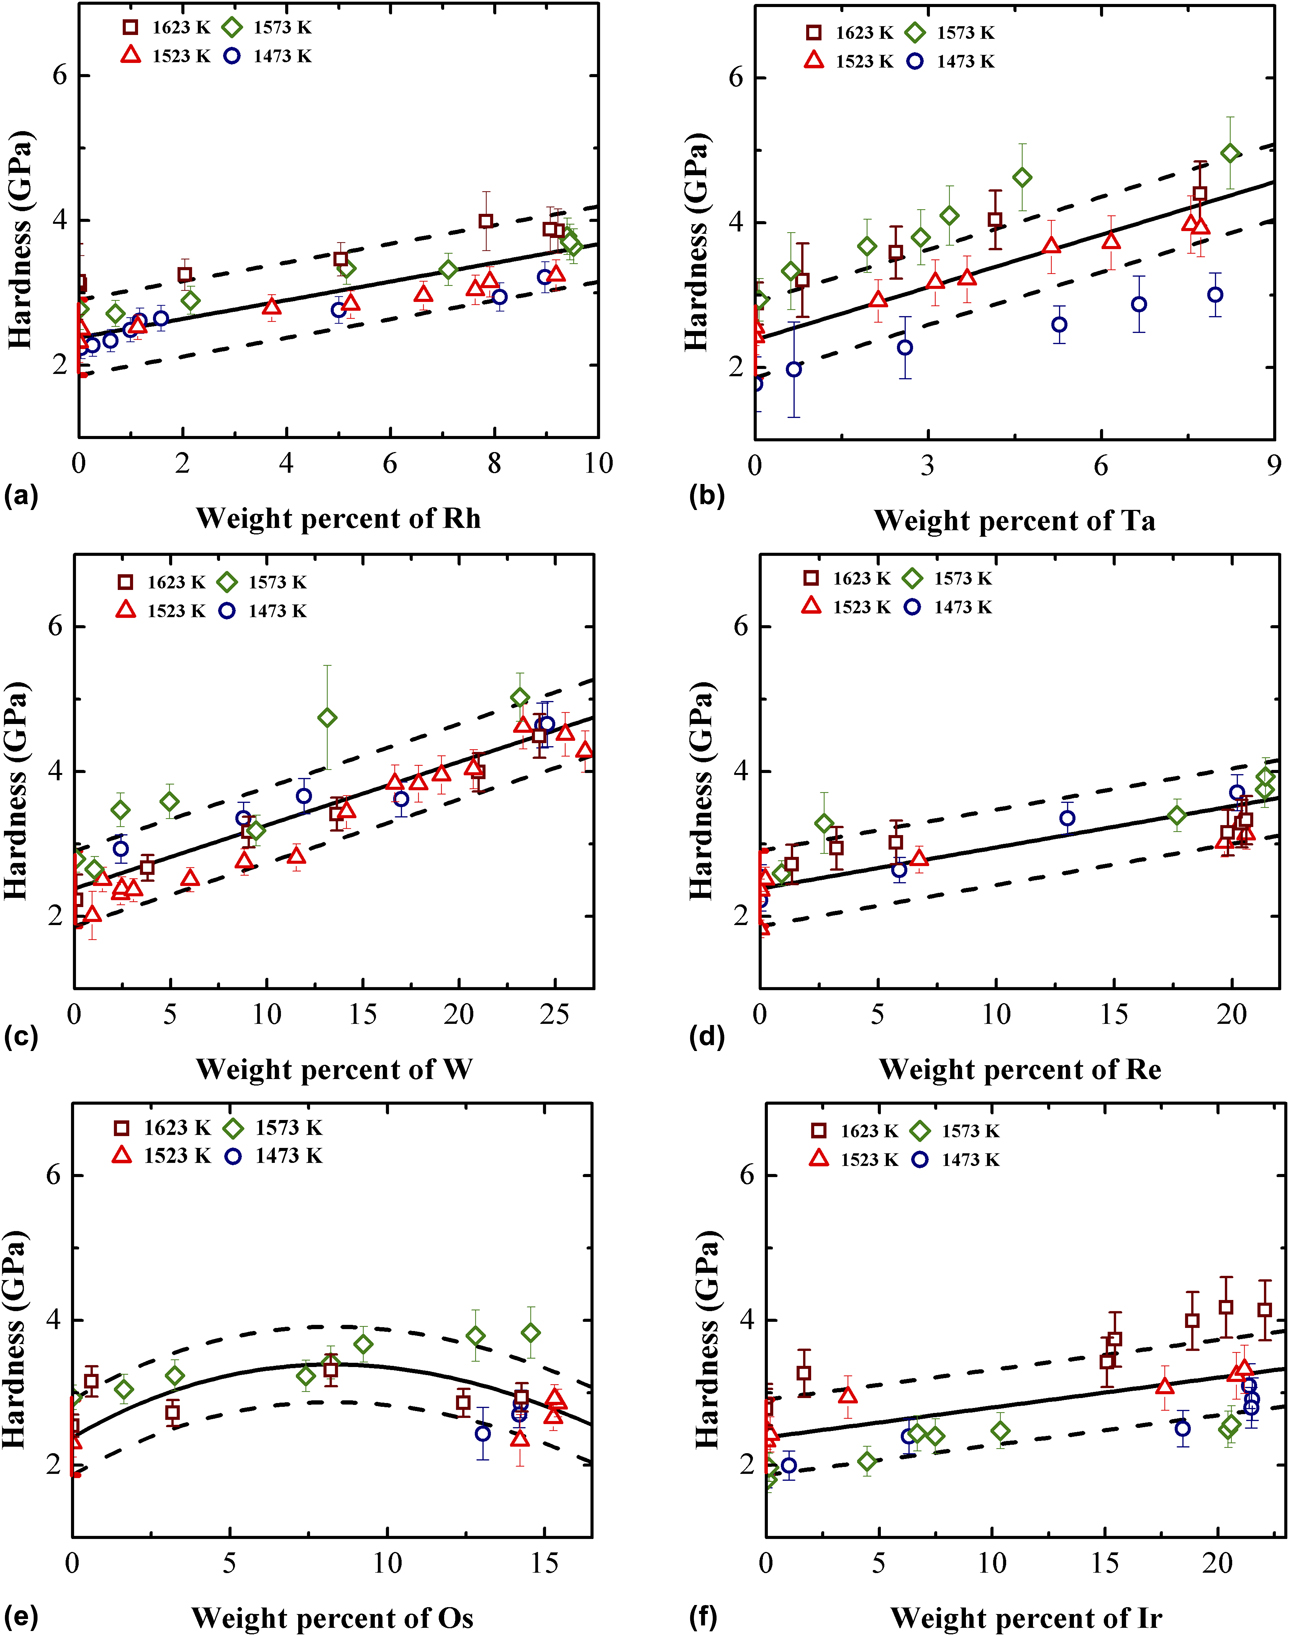
To further establish the direct relationship between the concentration and the hardness, and that between the concentration and the Young’s modulus, the composition-dependent hardness and Young’s modulus are plotted in Figs. 5 and 6 without consideration of the effect of annealing temperature. As can be seen in Fig. 5, the addition of the refractory elements (e.g., Rh, Ta, W, Re, and Ir) results in a linear increase in the hardness of the fcc Ni–X alloys. While the hardness of fcc Ni–Os alloys increases at first and decreases afterward as the addition of Os in fcc Ni. However, as shown in Fig. 6, the Young’s moduli of fcc Ni–X (X = Rh, Ta, W, Re, Os, and Ir) alloys are more scattered than the hardness values and do not show similarly clear variation with the additional X content in fcc Ni.
Model-predicted composition-dependent hardness of (a) Ni/Ni–Rh, (b) Ni/Ni–Ta, (c) Ni/Ni–W, (d) Ni/Ni–Re, (e) Ni/Ni–Os, and (f) Ni/Ni–Ir diffusion couples, compared with the experimental data in the present work.

Model-predicted composition-dependent Young’s modulus of (a) Ni/Ni–Rh, (b) Ni/Ni–Ta, (c) Ni/Ni–W, (d) Ni/Ni–Re, (e) Ni/Ni–Os, and (f) Ni/Ni–Ir diffusion couples, compared with the experimental data in the present work and Ref. Reference Shang, Kim, Zacherl, Wang, Du and Liu54.

Modeling results
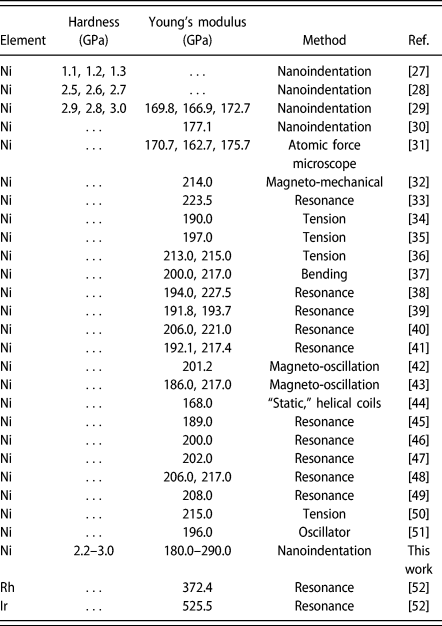
Table I summarizes the experimental hardness and Young’ s moduli of different stable pure fcc elements, i.e., Ni, Rh, and Ir, measured in the present work together with those from the literature.
Summary of hardness and Young’s moduli of stable fcc pure elements (i.e., Ni, Rh, and Ir) available in the literature and those measured in the present work.

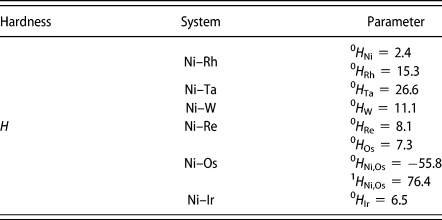
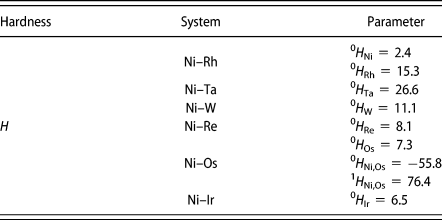
For the evaluation of CALPHAD-type hardness descriptions in fcc Ni–X, only the end members representing the hardness of fcc Rh, Ta, W, Re, Os, and Ir elements were optimized in the first step. The average experimental hardness value for pure fcc Ni from the present work and the literature [Reference Durst, Franke, Böhner and Göken27, Reference Schwaiger, Moser, Dao, Chollacoop and Suresh28, Reference Wang, Fang, Cheng, Chiang and Chao29] was utilized as the end member for the hardness of pure fcc Ni. The error for the hardness of pure fcc Ni was obtained based on the maximum and minimum experimental hardness in the literature [Reference Durst, Franke, Böhner and Göken27, Reference Schwaiger, Moser, Dao, Chollacoop and Suresh28, Reference Wang, Fang, Cheng, Chiang and Chao29] and was represented by the red lines in the ordinate in Fig. 5. Because there are no experimental or theoretical hardness values of fcc Rh, Ta, W, Re, Os, and Ir in the literature, the end members for the hardness of pure fcc Rh, Ta, W, Re, Os, and Ir were directly optimized on the basis of the experimental hardness of fcc Ni–X (X = Rh, Ta, W, Re, Os, and Ir) alloys. The end members were carefully chosen by iteratively fitting until the minimization of the error between the measured and calculated hardness was achieved. Then, whether the interaction parameters were needed or not depended on the fitting degree between the experimental and the model-predicted hardness values. If the experimental data were well reproduced when only the end members were introduced, no interaction parameter would be introduced. Otherwise, the interaction parameters should be added.
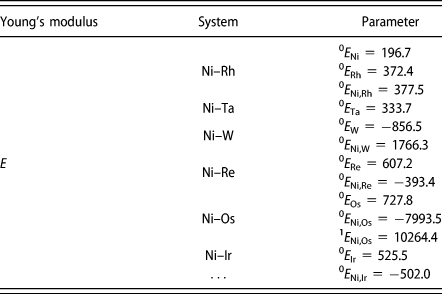
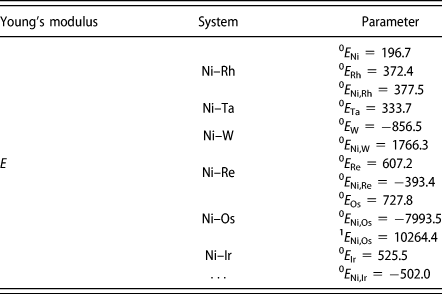
The similar way was used to assess the Young’ modulus of fcc Ni–X (X = Rh, Ta, W, Re, Os, and Ir) alloys. The Young’ modulus of pure fcc Ni was taken from the average experimental value of the Young’s moduli measured in the present work and from the literature [Reference Wang, Fang, Cheng, Chiang and Chao29, Reference Petley, Sathishkumar, Raman, Rao and Chandrasekhar30, Reference Kim31, Reference Hubert, Milhet, Gadaud, Tatat, Renault and Coupeau32, Reference Köster33, Reference Honda and Terada34, Reference Kurnakow and Rapke35, Reference Mudge and Luff36, Reference Jacquerod and Mügeli37, Reference Nakamura38, Reference Davies and Thomas39, Reference Engler40, Reference Kimura41, Reference Yamamoto42, Reference Yamamoto43, Reference Masumoto and Saito44, Reference Ledbetter and Reed45, Reference Pavlov, Kriutchkov and Fedotov46, Reference Hill, Shimmin and Wilcox47, Reference Tino and Maeda48, Reference Orlov and Fedotov49, Reference Faninger50, Reference Masumoto, Saitô and Sawaya51], and was donated as the end member representing the Young’ modulus of fcc Ni. The error for the Young’ modulus of pure fcc Ni was obtained on the basis of the maximum and minimum experimental Young’ moduli in the literature [Reference Wang, Fang, Cheng, Chiang and Chao29, Reference Petley, Sathishkumar, Raman, Rao and Chandrasekhar30, Reference Kim31, Reference Hubert, Milhet, Gadaud, Tatat, Renault and Coupeau32, Reference Köster33, Reference Honda and Terada34, Reference Kurnakow and Rapke35, Reference Mudge and Luff36, Reference Jacquerod and Mügeli37, Reference Nakamura38, Reference Davies and Thomas39, Reference Engler40, Reference Kimura41, Reference Yamamoto42, Reference Yamamoto43, Reference Masumoto and Saito44, Reference Ledbetter and Reed45, Reference Pavlov, Kriutchkov and Fedotov46, Reference Hill, Shimmin and Wilcox47, Reference Tino and Maeda48, Reference Orlov and Fedotov49, Reference Faninger50, Reference Masumoto, Saitô and Sawaya51], and was represented by the red lines in the ordinate in Fig. 6. Because fcc Rh and Ir are stable and their Young’ moduli were measured by Merker et al. [Reference Merker, Lupton, Töpfer and Knake52], the end members for Young’ moduli of pure fcc Rh and Ir can be fixed as the literature data [Reference Merker, Lupton, Töpfer and Knake52]. While for the metastable fcc Re and Os and unstable fcc Ta and W, no experimental data for their Young’ moduli was available in the literature. Thus, the end members for Young’ moduli of pure fcc Ta, W, Re, and Os were directly adopted from the first-principles calculation results by Shang et al. [Reference Shang, Saengdeejing, Mei, Kim, Zhang, Ganeshan, Wang and Liu53]. Finally, based on the fixed end members, the composition-dependent Young’ moduli of fcc Ni–X alloys were directly calculated and compared with the experimental data. Once the experimental data can be well reproduced when only the end members are introduced, no interaction parameter was needed, or the interaction parameter(s) should be carefully introduced.
Following the above strategies, an in-house code was developed. This code consists of two modules, i.e., “read-in” and “fitting-check”. In the “read-in” module, the measured hardness/Young’s moduli of composition dependence are first read in. In the “fitting-check” module, an optimal set of adjustable parameters such as 0ϕα and  ${}^n\phi _{i,j}^\alpha$ were carefully chosen by using the simulated annealing algorithm for iterative fitting to the experimental data until the minimization of the error between the measured and calculated hardness/Young’s modulus was achieved. The finally obtained end members and interaction parameters to describe the hardness and Young’s modulus in fcc Ni–X systems are listed in Tables II and III. The possible reason for negative Young’ modulus of fcc W is that fcc W is mechanically unstable.
Summary of the finally obtained end members and interaction parameters to describe the hardness of fcc Ni–X (X = Rh, Ta, W, Re, Os, and Ir) alloys.
Summary of the finally obtained end members and interaction parameters to describe the Young’s modulus of fcc Ni–X (X = Rh, Ta, W, Re, Os, and Ir) alloys.
The calculated composition-dependent hardness and Young’s moduli of fcc Ni–X alloys based on the above descriptions are depicted in Figs. 5 and 6, respectively. The dashed lines in Figs. 5 and 6 are the error values originated from the hardness/Young’s modulus of pure fcc Ni and thus represent the typical errors for the hardness/Young’s modulus of Ni–X alloys. The corresponding experimental data were also superimposed in the figures for direct comparison. As can be seen in Figs. 5 and 6, the calculated hardness and Young’s moduli of fcc Ni–X alloys agree with the experimental data in general. It is found in Fig. 5 that the values of hardness increase as the concentration of X (X = Rh, Ta, W, Re, and Ir) increases, while the values of hardness increase as the Os composition increases first, and when a maximum value is achieved, then decrease. As shown in Fig. 6, the Young’s modulus increases slightly with an increase in X (X = Rh, Ta, W, and Re), while with the increase in Os composition, the Young’s modulus first increases and then decreases. What’s more, the Young’s modulus decreases slightly with the increase in Ir content.
Shang et al. [Reference Shang, Kim, Zacherl, Wang, Du and Liu54] computed the elastic constants of pure Ni, Ni–5.35 wt% Rh, Ni–9.04 wt% Ta, Ni–9.18 wt% W, Ni–9.28 wt% Re, Ni–9.46 wt% Os, and Ni–9.55 wt% Ir alloys using the first-principles calculations. With the elastic constants in single crystals, two classic approaches can be used to calculate the polycrystal elastic properties. One is Voigt’s approach for the upper bound based on the uniform strain, while the other is Reuss’ approach for the lower bound based on the uniform stress [Reference Kim, Shang and Liu55]. According to Hill’s empirical average [Reference Merker, Lupton, Töpfer and Knake52], the bulk (B), shear (G), and Young’s (E) moduli can be evaluated using B = (B V + B R)/2, G = (G V + G R)/2, and E = (9BG)/(3B + G), with subscripts V and R representing Voigt’s and Reuss’ approaches, respectively. In the present work, Young’s moduli of pure Ni, Ni–5.35 wt% Rh, Ni–9.04 wt% Ta, Ni–9.18 wt% W, Ni–9.28 wt% Re, Ni–9.46 wt% Os, and Ni–9.55 wt% Ir alloys were calculated based on Hill’s empirical average [Reference Hill56] as well as the first-principles computed elastic constants by Shang et al. [Reference Shang, Kim, Zacherl, Wang, Du and Liu54], as superimposed in Fig. 6 for direct comparison with the present experimental and model-predicted ones. As shown in Fig. 6, the first-principles computed Young’s modulus of pure Ni by Ref. Reference Shang, Kim, Zacherl, Wang, Du and Liu54 is much larger than the experimental data. Moreover, the Young’s moduli of Ni–5.35 wt% Rh, Ni–9.04 wt% Ta, Ni–9.18 wt% W, Ni–9.28 wt% Re, and Ni–9.55 wt% Ir alloys reported by Ref. Reference Shang, Kim, Zacherl, Wang, Du and Liu54 are also much higher than the experimental values and locate outside the range of error. One exception is the first-principles calculated Young’s modulus of Ni–9.46 wt% Os alloy by Ref. Reference Shang, Kim, Zacherl, Wang, Du and Liu54, which lies within the range of error.
Conclusions
(1) The composition-dependent hardness and Young’s moduli of fcc Ni–X (X = Rh, Ta, W, Re, Os, and Ir) alloys were measured by combining the diffusion couple and nanoindentation techniques.
(2) The CALPHAD models for descriptions of the composition-dependent hardness and Young’s modulus were developed, and an in-house code for the parameter assessment was also realized. The CALPHAD-type descriptions for hardness and Young’s modulus in fcc Ni–X (X = Rh, Ta, W, Re, Os, and Ir) systems were then obtained. The model-predicted hardness and Young’s moduli of composition dependence agree with the experimental data in general.
(3) The presently obtained CALPHAD-type hardness and Young’s modulus descriptions, together with the previous thermodynamic and atomic mobility databases, can be used for the future alloy design of novel Ni-based superalloys.
Experimental procedure
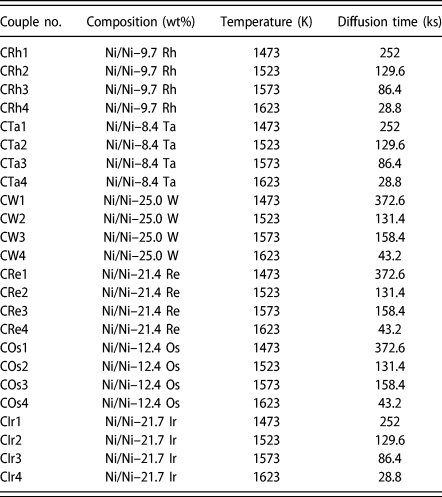
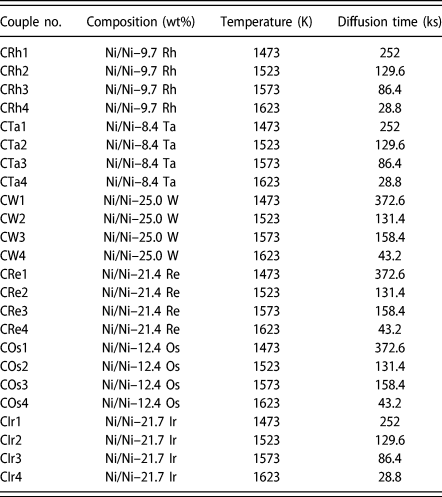
Ni (purity: 99.99 wt%), Rh (purity: 99.99 wt%), Ta (purity: 99.99 wt%), W (purity: 99.99 wt%), Re (purity: 99.99 wt%), Os (purity: 99.99 wt%), and Ir (purity: 99.99 wt%) ingots were used as the raw materials. Twenty-four groups of diffusion couples, as listed in Table IV, were prepared according to the following procedure. The actual compositions of all the alloys are also presented in Table IV. The Ni–Rh, Ni–Ta, Ni–W, Ni–Re, Ni–Os, and Ni–Ir alloys and pure Ni ingots were prepared in a high-purity argon atmosphere using an arc-melting furnace (WKDHL-1; Optoelectronics Co., Ltd., Beijing, China), which is equipped with a non-consumable tungsten electrode and a water-cooled copper anode. To ensure the refractory elements, such as Rh, Ta, W, Re, Os, and Ir, were completely dissolved in Ni, the strategy developed in our previous work [Reference Chen, Zhang, Wang, Chen, Tang, Zhang and Du10] was directly adopted here: first, the refractory elements and Ni of the same weight were melted, then the rest of Ni ingots were put together with the predecessors, and the mixtures were repeatedly melted for five times to improve the composition homogeneity. After that, the pure Ni and alloys ingots were sliced into the blocks with the dimension of 5 × 5 × 1 mm3, and those slices were annealed at 1573 K for 288 ks to further increase the grain size and improve their homogeneity in a high-temperature furnace (GSL1700X; Hefei Kejing Materials Technology Co., Ltd., Hefei, China). Subsequently, two polished slices for a diffusion couple were bounded by a Mo clamp and encapsulated in vacuum quartz tubes. All the diffusion couples were annealed in the condition given in Table IV in a high-temperature furnace (GSL1700X; Hefei Kejing Materials Technology Co., Ltd., Hefei, China). Finally, the diffusion couples were taken out of the furnace and directly quenched in cold water. All the diffusion couples were cut along the diffusion direction and then polished in a standard way. The concentration profiles of all the diffusion couples were characterized by electron probe microanalyzer (EPMA) (JXA-8100, JEOL, Tokyo, Japan) on the polished section.
List of terminal compositions of the diffusion couples in the present work.
Hardness and Young’s modulus were measured simultaneously using nanoindentation (CSM Ltd., Peseux, Switzerland) along the diffusion paths of diffusion couples. The experimental conditions of nanoindentation tests for all the diffusion couples are as follows: the maximum loading was 30 mN, the loading rate was 60 mN/min, and the holding time in the maximum loading was 15 s. Hardness (H) and Young’s modulus (E) were determined from the load–displacement curves according to the Oliver–Pharr method [Reference Oliver and Pharr57, Reference Oliver and Pharr58]. The definition of hardness is as follows [Reference Oliver and Pharr57, Reference Oliver and Pharr58]:
 $${\rm{HV}} = {{{P_{{\rm{max}}}}} \over A}\quad ,$$
where P max is the peak indentation load, while A is the projected area of the hardness impression. The reduced elastic modulus (E r), which is related to the Young’s modulus, is expressed as follows:
 $$S = {{{\rm{d}}p} \over {{\rm{d}}h}} = {2 \over {\sqrt \pi }}{E_{\rm{r}}}\sqrt A \quad ,$$
where S is the slope of the upper portion of the unloading curve. Then, Young’s modulus (E) of the specimen can be described as follows:
 $${1 \over {{E_{\rm{r}}}}} = {{\left( {1 - {\nu ^2}} \right)} \over E} + {{\left( {1 - \nu _{\rm{i}}^2} \right)} \over {{E_{\rm{i}}}}}\quad ,$$
where ν is Poisson’s ratio of the specimen, and E i and νi are the Young’s modulus and Poisson’s ratio of the indenter, respectively.
Eventually, the compositions of alloys along the direction perpendicular to the diffusion path in the positions very close to indentations were determined by EPMA. Thus, there exists a one-to-one relation between the concentrations of the alloys in the positions close to indentations and the hardness and Young’s modulus of the alloys in the indentations. The error for concentration measurements is within 0.5%, while the errors for the hardness and Young’s modulus measurements of different samples are diverse and automatically given by the nanoindentation measurements. The main error sources for the nanoindentation measurements are the shape of indenter tip, surface roughness of the samples, and uncertainty of zero position.
Computational methodology
In the spirit of CALPHAD approach, the hardness or Young’s modulus of phase α in a multicomponent system can be given by the following equation:
 $${\phi ^\alpha } = {}^0{\phi ^\alpha } + \Delta {\phi ^\alpha }\quad ,$$
where ϕα denotes either hardness or Young’s modulus of phase α. 0ϕα is the mechanical mixing term of component i:
 $${}^0{\phi ^\alpha } = \sum {{c_i}} {\;^0}\phi _i^\alpha \quad ,$$
while Δϕα is the excess contribution beyond the ideal mechanical mixing and can be described using the Redlich–Kister polynomial as:
 $$\eqalign{\Delta {\phi ^\alpha } = \sum\limits_i {\sum\limits_{j > 1} {{c_i}{c_j}} } \sum\limits_{n = 0} {{}^n\phi _{i,j}^\alpha {{\left( {{c_i} - {c_j}} \right)}^n}} \cr+ \sum\limits_i {\sum\limits_{j > 1} {\sum\limits_{k > j} {{c_i}{c_j}{c_k}{}^n\phi _{ijk}^\alpha } } } \quad ,$$
where  ${}^0\phi _i^\alpha$ is the hardness or Young’s modulus of component i in α phase, and
 ${}^n\phi _{i,j}^\alpha$ and
 ${}^n\phi _{ijk}^\alpha$ are the nth interaction parameters in binary and ternary systems, respectively. In the present work, only binary systems are treated, and thus no ternary interaction parameters are introduced. Moreover, because all the experimental data are not temperature-dependent here, no temperature terms will be introduced for
 ${}^0\phi _i^\alpha$ and
 ${}^n\phi _{i,j}^\alpha$. In addition, the configuration entropy term in the CALPHAD-type Gibbs energy formula is based on the number of possible arrangements of the constituents in the structure and assumes to be constant for the hardness and Young’s modulus. Therefore, there is no configurational term in Δϕα in the models of hardness or Young’s modulus.
Acknowledgments
The financial support from the Youth Talent Project of Innovation-driven Plan at Central South University (Grant No. 2019CX027), the Hunan Provincial Science and Technology Program of China (Grant No. 2017RS3002)—Huxiang Youth Talent Plan, Project Funded by China Postdoctoral Science Foundation (Grant No. 2018M640526), Jiangsu Planned Projects for Postdoctoral Research Funds (Grant No. 2018K073C) and Lvyangjinfeng Talent Program of Yangzhou are acknowledged. Lijun Zhang acknowledges the project supported by the State Key Laboratory of Powder Metallurgy Foundation, Central South University, Changsha, China.