

INTRODUCTION
The results of our recent investigations at Ceibal, Guatemala, as discussed in the papers of this special section, provide important insights into the social processes regarding the establishment of sedentary communities and the growth of centralized polities in the Maya lowlands during the Preclassic period. Important findings include: (1) Ceibal was founded as a formal ceremonial center at the beginning of its occupation around 1000 b.c. (Figure 1); (2) the architecture and ritual deposits suggest a close connection with the Grijalva basin in Chiapas; (3) some buildings at Ceibal reached a monumental scale between 850 and 775 b.c.; (4) by 700 b.c., the residents of Ceibal established an even more formalized spatial pattern which closely resembled those of centers in Chiapas; and (5) during the late Middle Preclassic period (700–350 b.c.), Ceibal maintained this formal plan but, in terms of construction methods and ceramics, the Ceibal residents strengthened affinity with the rest of the Maya lowlands.
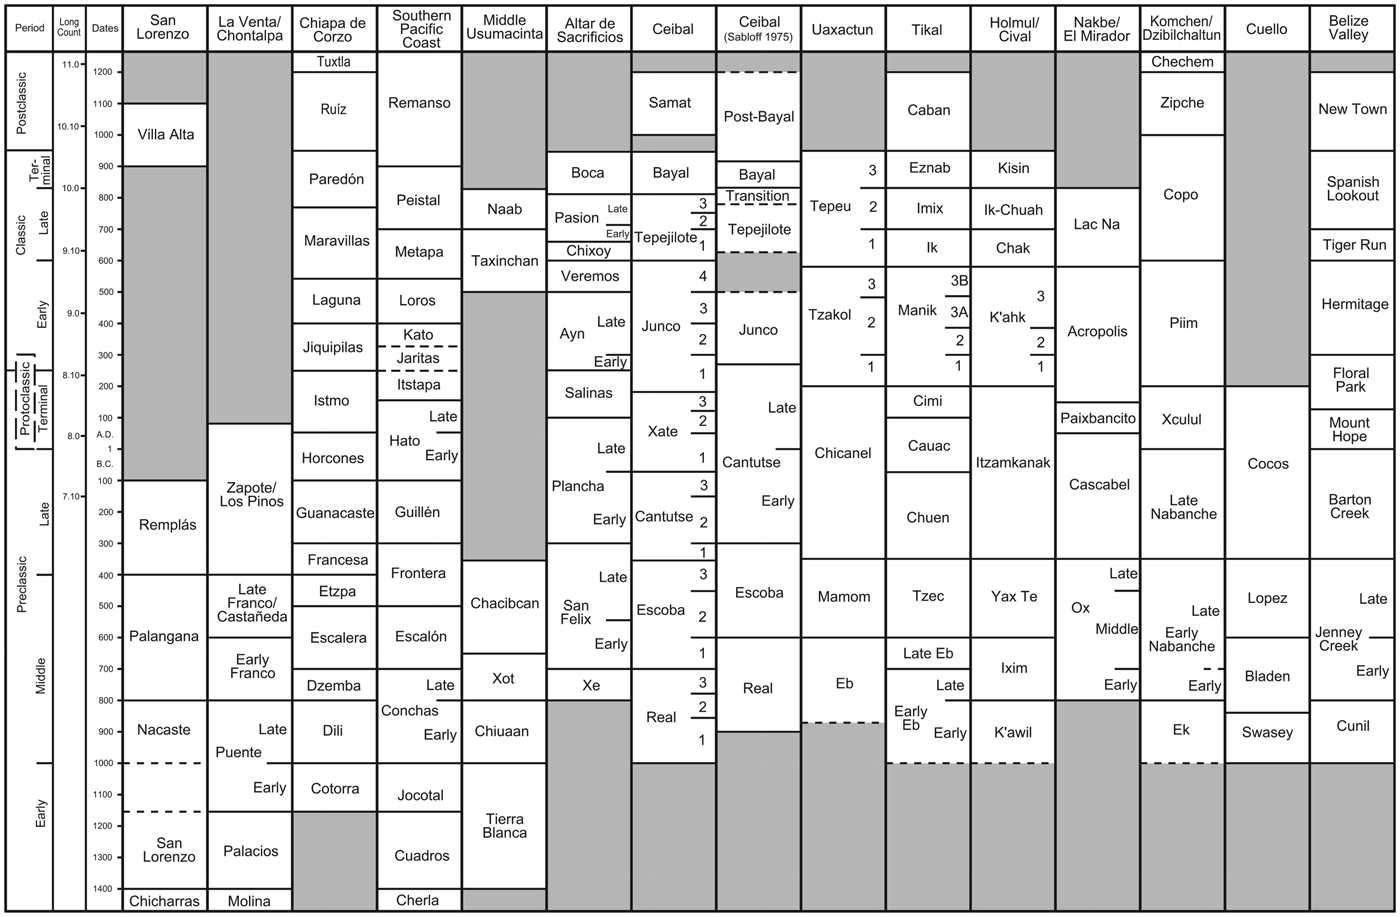
Chronological chart for the Maya lowlands and the surrounding areas. The chart represents the author's view of ceramic cross-dating rather than the original chronologies presented by researchers of individual sites.

Our investigations have demonstrated that the earliest versions of an E-Group assemblage (see Inomata et al. Reference Inomata, Triadan and Aoyama2017a, for the definition of the E-Group assemblage) and the A-24 platform were built at the beginning of occupation at Ceibal around 950 b.c., that is, the inception of the early Middle Preclassic period (Inomata et al. Reference Inomata, Triadan, Aoyama, Castillo and Yonenobu2013; Inomata et al. Reference Inomata, Pinzón, Manuel Palomo, Sharpe, Ortíz, Belén Méndez and Román2017b; Triadan et al. Reference Triadan, Castillo, Inomata, Manuel Palomo, Belén Méndez, Cortave, MacLellan, Burham and Ponciano2017). This represented a substantial social transformation. During the previous period, the area was either uninhabited or occupied sparsely by mobile horticulturalists who apparently did not use ceramics or substantial buildings. Instead of gradually transitioning from a small village to a more formalized spatial pattern, the residents of Ceibal built a formal ceremonial center as soon as they adopted a sedentary way of life. This spatial pattern is similar to that of the Chiapas centers, consisting of an E-Group assemblage and large platforms located along the north-south axis of the E Group (see Inomata et al. Reference Inomata, Triadan and Aoyama2017a), which Clark (Clark and Hansen Reference Clark, Hansen, Inomata and Houston2001) called the Middle Formative Chiapas (MFC) pattern. Similarities to neighboring regions are also seen in the construction methods. The early Ceibaleños constructed buildings by carving the natural marl and by placing additional clay. Subsequent early Middle Preclassic structures were built mainly of clay and earth. The use of clay and earth was common at contemporaneous settlements in Chiapas, as well as on the Gulf Coast, on the southern Pacific Coast, and in the Guatemalan highlands. In addition, the Ceibal residents deposited greenstone axe caches at the beginning of site occupation, which resembled later deposits at La Venta, San Isidro, and Chiapa de Corzo. It appears that interactions with central Chiapas and other neighboring regions were critical for this social transformation at Ceibal. Nonetheless, it is important to note that these early buildings at Ceibal were relatively small, and they appear to represent minimal elements of the MFC pattern. Ceibal still did not have a pyramid on the western side of the E-Group assemblage, and the north-south orientation typical of the fully developed MFC pattern with multiple platforms was not clearly manifested. In addition, it lacked a northeastern platform, a characteristic of later MFC sites (Clark and Hansen Reference Clark, Hansen, Inomata and Houston2001; Inomata et al. Reference Inomata, Triadan and Aoyama2017a). These observations suggest that the residents of Ceibal did not simply accept a spatial pattern developed elsewhere, but they actively participated in interregional interactions and contributed to the formalization of the MFC pattern.
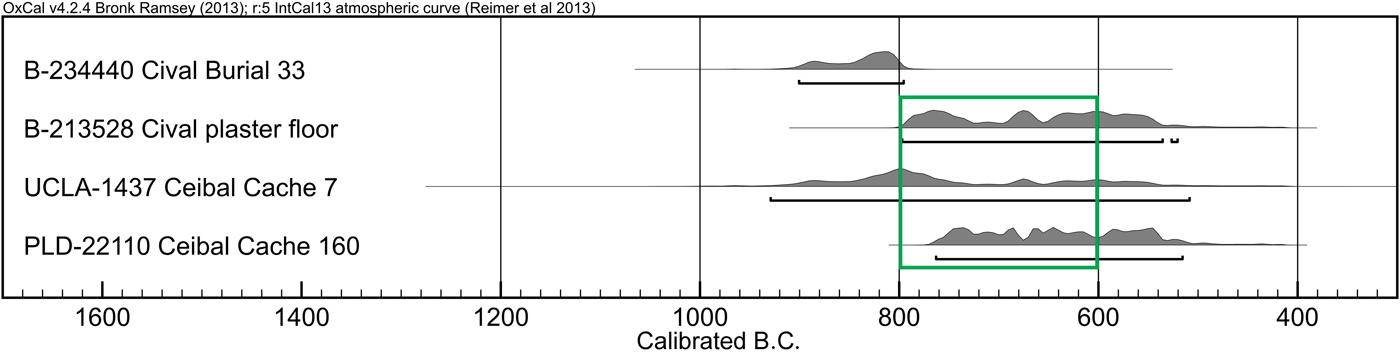
During the Real 2 phase (850–775 b.c.), some of the buildings at Ceibal reached a monumental scale. The expanded version of the western building of the E-Group assemblage (Structure B'ehom) appears to have taken a pyramidal shape. Platform Ch'och’ under the A-24 Platform also went through a series of renovations during this period, and reached a total fill thickness of 3.5 m in Op. 200B and roughly six meters in Op. 200A. It was during the following Real 3 phase (775–700 b.c.) that the northwestern platform, K'at, was added and a more developed form of the MFC pattern with multiple platforms was established. Ceibaleños continued to deposit greenstone axe caches, but the size of the axes tended to be smaller. The three cruciform caches with semi-translucent jade axes (Caches 7, 160, and 171) probably belong to this period.
In this paper, I attempt to situate these finds at Ceibal in the broader data set from the Maya lowlands and surrounding regions to develop a better understanding of social processes. For this purpose, chronological evaluations and correlations across different regions are critical. Building on important earlier syntheses (Andrews Reference Andrews, Harrison and Clancy1990; Cheetham Reference Cheetham and Powis2005), here I present my chronological reconstruction for the Maya lowlands and the surrounding regions based on available data on ceramic sequences and radiocarbon dates (Figures 1 and 2). All dates discussed in the paper are calibrated dates unless indicated otherwise. The chronological relations with the southern Gulf Coast, central Chiapas, and the southern Pacific Coast were discussed in detailed in a previous publication (Inomata et al. Reference Inomata, Triadan, Aoyama, Castillo and Yonenobu2013), and they are not repeated here.
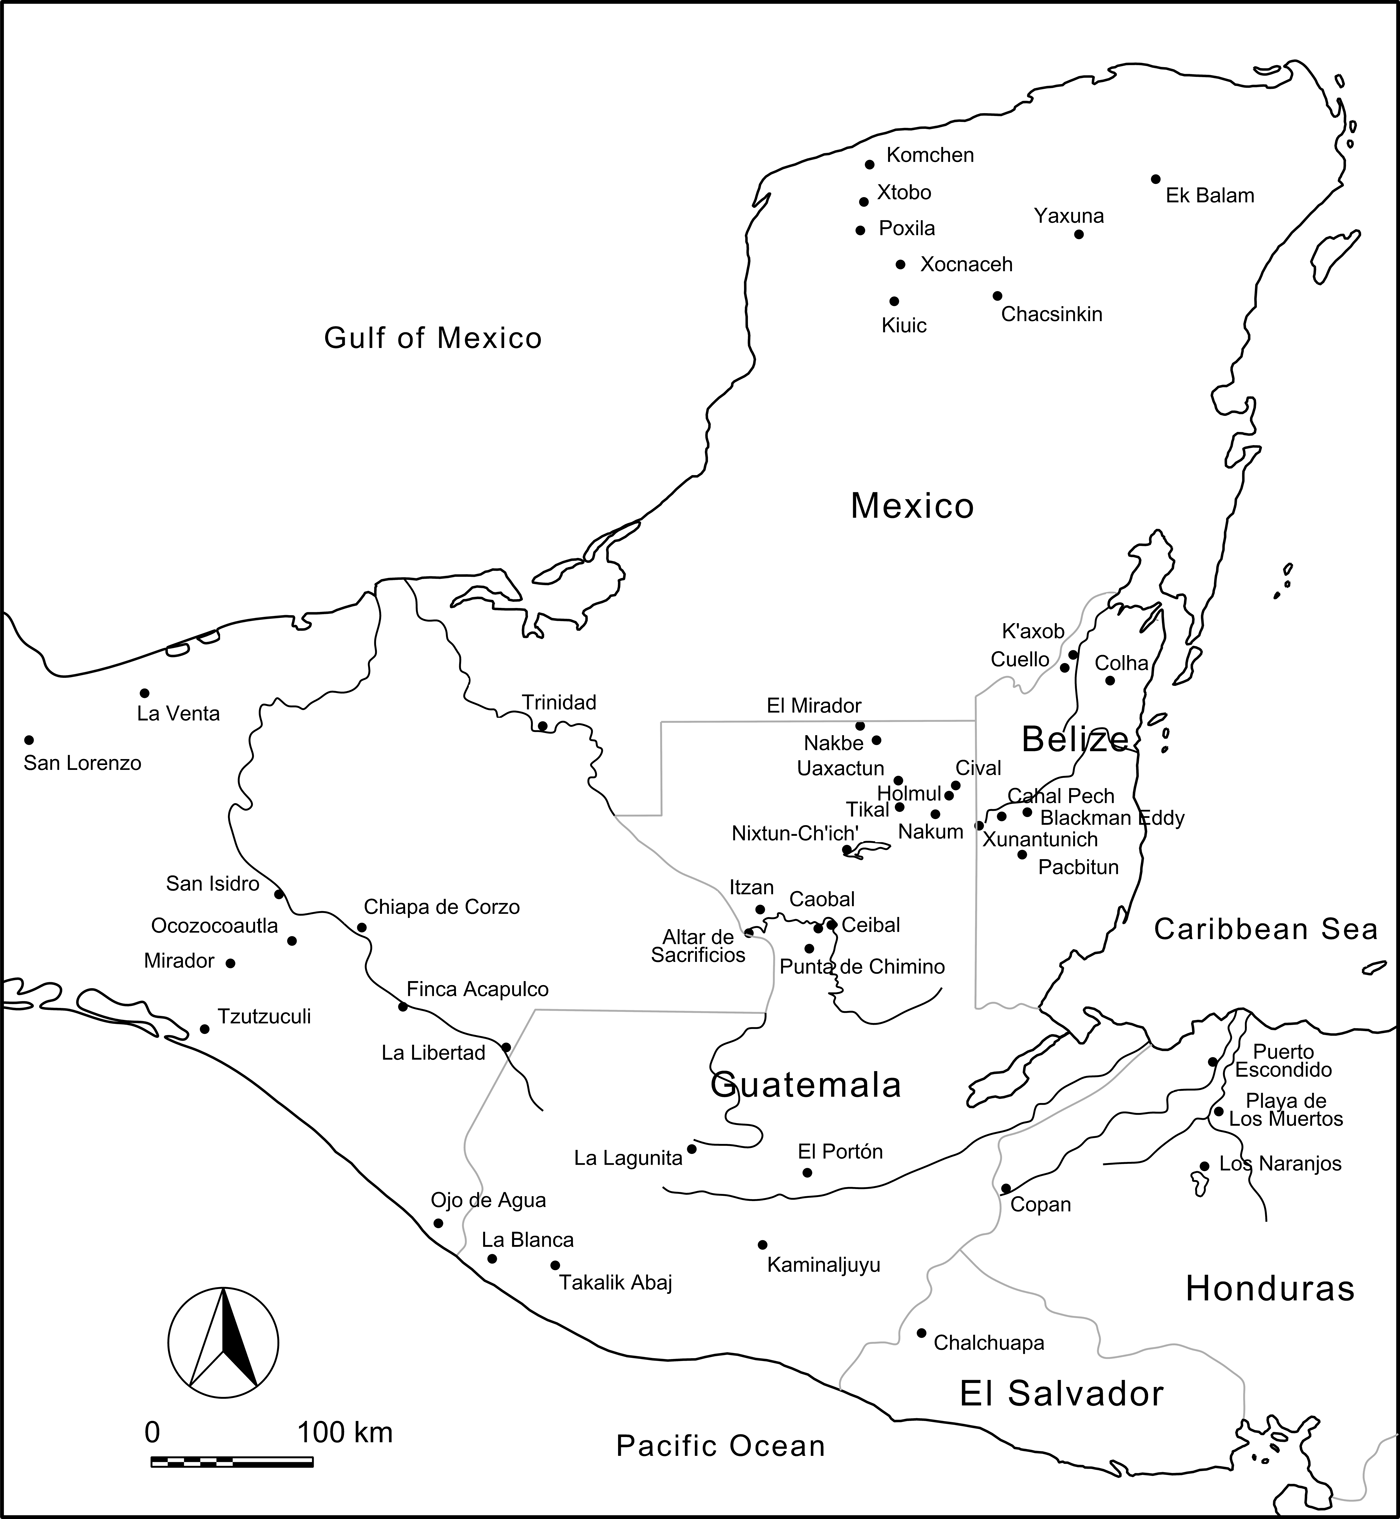
Map of the Maya lowlands and the surrounding areas with the location of the sites discussed in the text. Map by author.

CHRONOLOGY OF THE PASIÓN REGION
Ceibal Sequence
Detailed stratigraphic information obtained in our excavations allowed us to subdivide the ceramic phases originally proposed by Sabloff (Sabloff Reference Sabloff and Willey1975:229). We analyzed 73 radiocarbon dates from the Middle Preclassic contexts at Ceibal. The accelerator mass spectrometry (AMS) radiocarbon dates of those samples were obtained at the University of Arizona AMS laboratory (AA), Poznan Radiocarbon Laboratory, Poland (Poz), and Paleo Laboratory Co., Japan (PLD) (Inomata et al. Reference Inomata, Triadan, Aoyama, Castillo and Yonenobu2013:Table S1; Inomata et al. Reference Inomata, MacLellan and Burham2015b:Table S1). We applied Bayesian statistics to refine the radiocarbon dates. The Bayesian analysis of radiocarbon dates incorporates information on ceramic phases and stratigraphic relations to narrow down the probability distributions of calibrated dates for each radiocarbon measurement, and estimates the starting and ending dates of a given temporal phase. The analysis, however, does not rectify errors resulting from external factors, such as sample contamination, the lack of stratigraphic integrity, and old wood. Thus, outliers (dates found outside of expected ranges) should be excluded from models. Researchers need to build a model based on various assumptions about the radiocarbon dates that they analyze, including phases (time spans to which multiple samples belong to), sequences (temporal orders between radiocarbon samples or phases), and contemporaneity (onetime events/deposits to which multiple samples belong). For our analysis we used the OxCal 4.2 program with the IntCal13 calibration curve (Bronk Ramsey Reference Bronk Ramsey2013; Reimer et al. Reference Reimer, Bard, Bayliss, Beck, Blackwell, Ramsey, Buck, Cheng, Lawrence Edwards and Friedrich2013). Inomata et al. (Reference Inomata, Triadan, Aoyama, Castillo and Yonenobu2013:Supplement; Reference Inomata, MacLellan and Burham2015:Supporting Information; Reference Inomata, Triadan, MacLellan, Burham, Aoyama, Palomo, Yonenobu, Pinzón and Nasu2017c:Supporting Information) provides lists of radiocarbon dates and specifics of our Bayesian model.
To establish a sound chronology, we tried to eliminate or reduce potential errors in radiocarbon dating resulting from: (1) the contamination of samples and unreliable measurements; (2) the re-deposition of old materials; (3) old wood effects; and (4) marine and freshwater reservoir effects. In collecting samples, we mainly targeted primary depositional contexts, including on-floor deposits, on-floor burning remains, shallow middens, burials, and caches. Our second preferences were refuse dumps within construction fills consisting of nearly contemporaneous materials without substantial mixes of older or heavily weathered sherds. The Bayesian statistics help us identify outliers, that is, problematic dates resulting from re-deposition, contamination, or measurement errors. For the samples submitted to the Poznan Lab and Paleo Lab, Hitoshi Yonenobu examined wood materials and selected samples that were less likely to be old wood. In addition, we dated multiple samples from each ceramic phase to evaluate and reduce the effects of old wood. Within a range of dates obtained from contexts belonging to roughly the same time, we generally chose younger dates assuming that older dates may have resulted from old wood or re-deposition of older materials.
Freshwater reservoir effects present another problem. The prevalent limestone bedrock in the Maya lowlands appears to contribute substantially to freshwater reservoir effects on radiocarbon dates (Ascough et al. Reference Ascough, Cook, Church, Dugmore, McGovern, Dunbar, Einarsson, Friðriksson and Gestsdóttir2007; Cook et al. Reference Cook, Bonsall, Hedges, McSweeney, Boronean and Pettitt2001; Culleton Reference Culleton2006; Keaveney and Reimer Reference Keaveney and Reimer2012; Philippsen Reference Philippsen2013). It is estimated that freshwater organisms from central Peten lakes, such as shell and fish, show measurements 1400 to 1800 radiocarbon years older than those of terrestrial plants, and those from lakes in the northern Yucatan Peninsula around 1200 radiocarbon years older (Curtis and Hodell Reference Curtis and Hodell1996; Curtis et al. Reference Curtis, Brenner, Hodell, Balser, Islebe and Hooghiemstra1998; Hodell et al. Reference Hodell, Curtis and Brenner1995; Islebe et al. Reference Islebe, Hooghiemstra, Brenner, Curtis and Hodell1996). Some researchers favor human bones for radiocarbon dating because they are less likely to represent re-depositions of older materials. Nonetheless, the freshwater reservoir effect causes older radiocarbon date measurements of human bones proportional to the consumption of freshwater organisms in relation to other food sources. Currently we do not have enough data with which to evaluate offsets resulting from freshwater reservoir effects. Although we measured radiocarbon dates of some human bones, we did not include these dates in our Bayesian model.
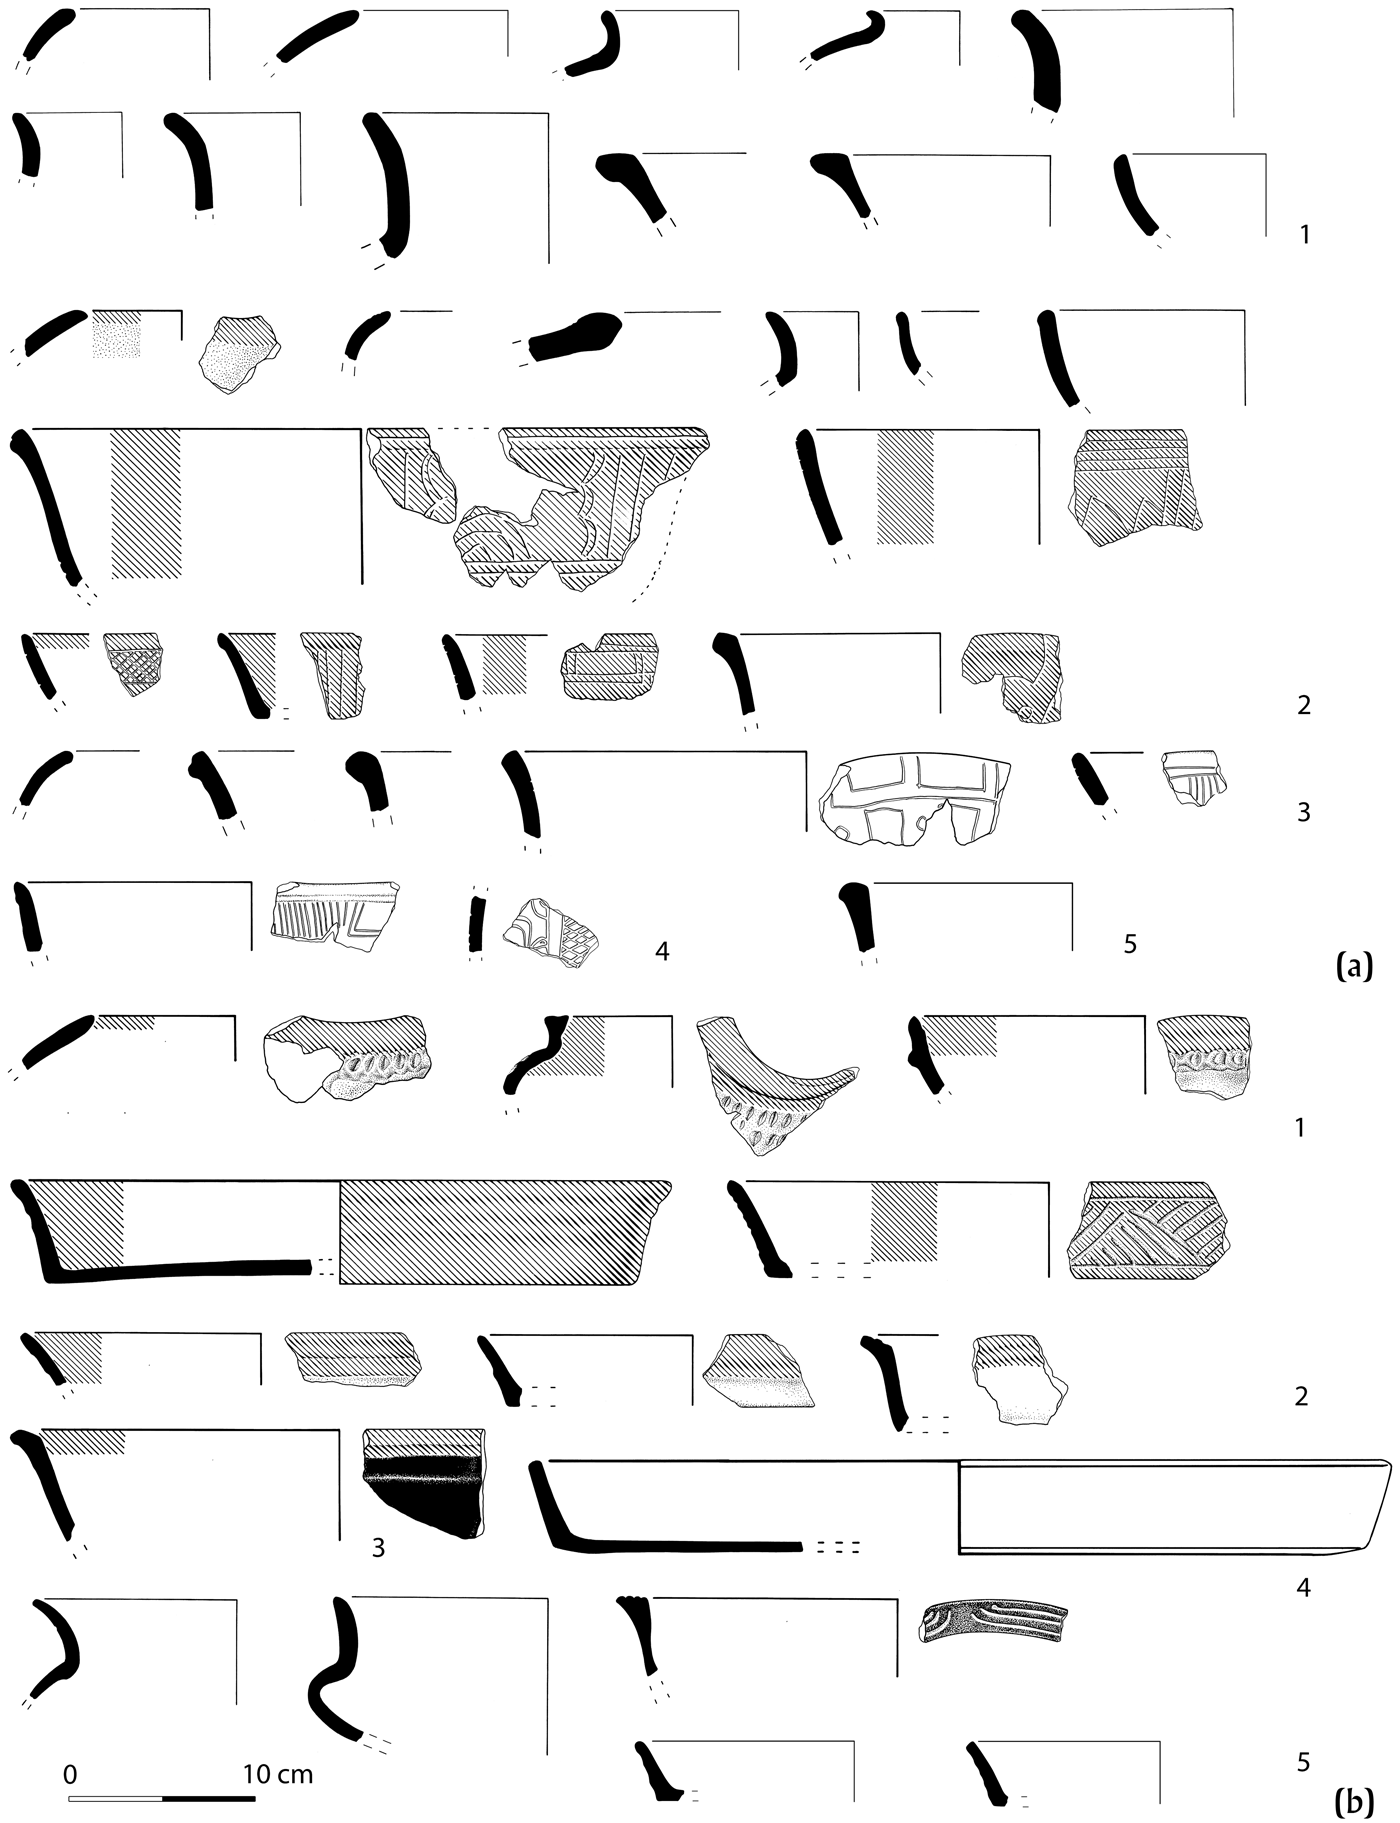
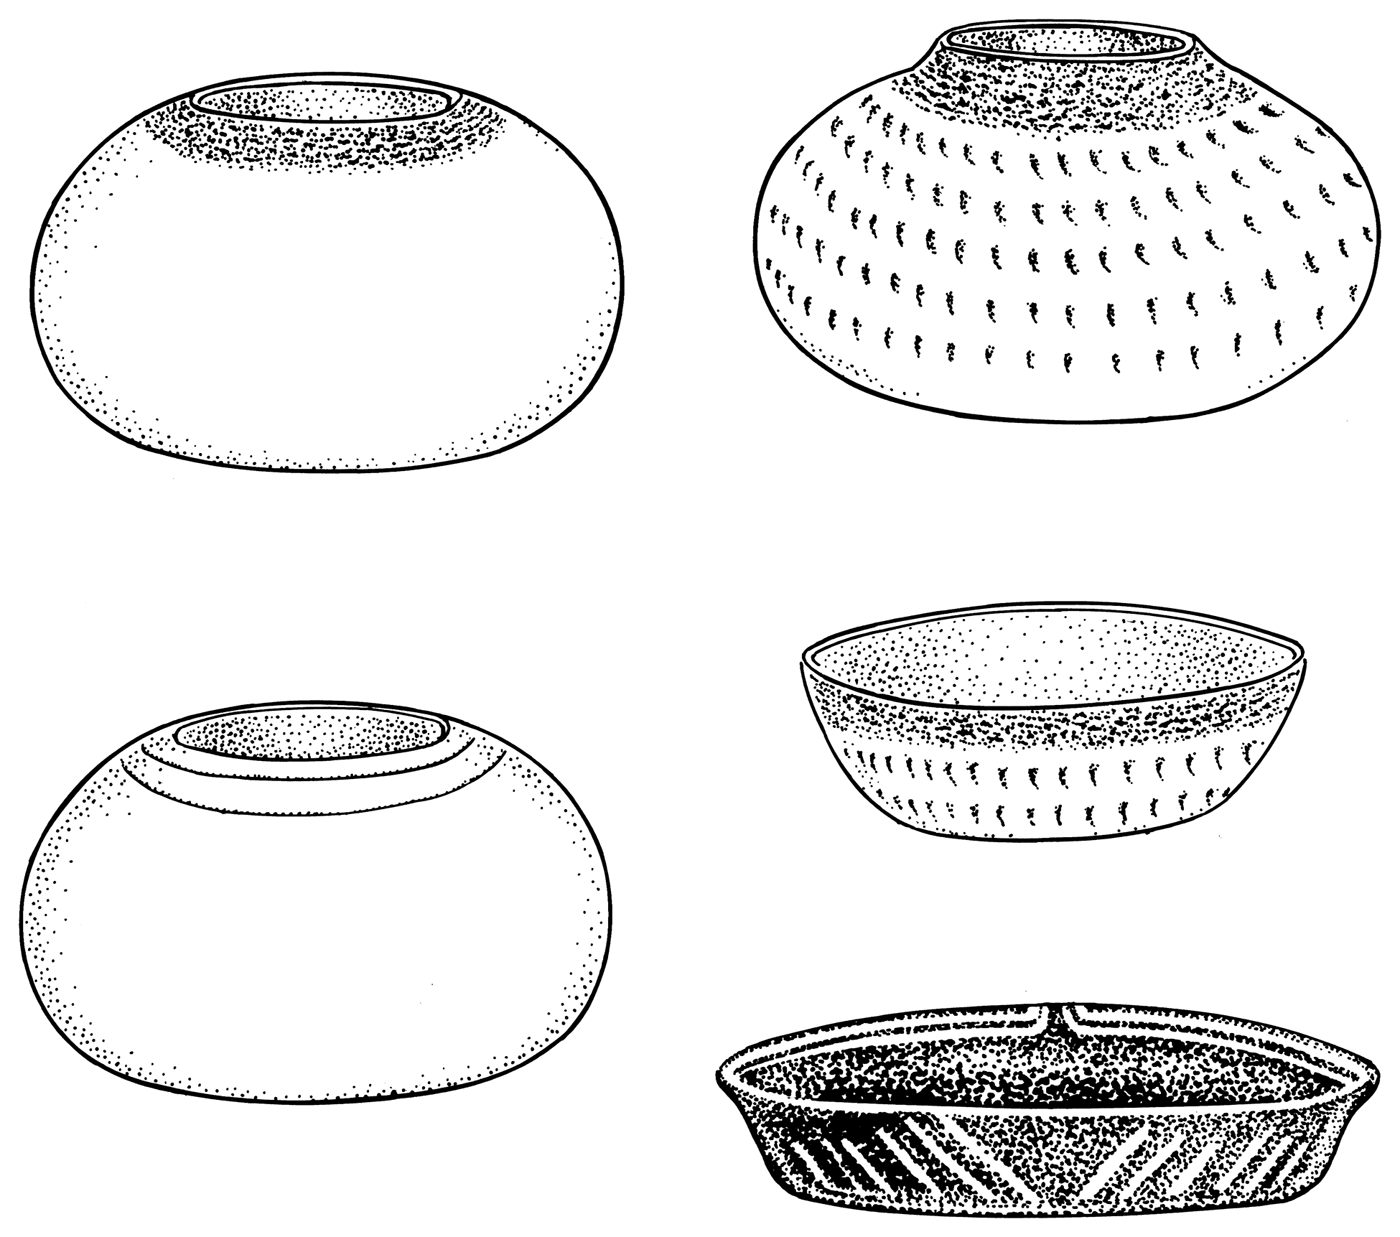
Real 1 phase (1000–850 b.c.) ceramics are characterized by the common presence of dull white-slipped vessels (Huetche White), as well as those with matte red slips (Abelino Red) (Figure 3). Postslip incisions are common, but most of them are simple hatching or curved lines, and specific symbolic motifs like those seen in the Cunil ceramics are rare. Common vessel forms include tecomates, jars with flaring necks, and bowls with direct or exterior-folded or exterior-thickened rims. Ten radiocarbon dates associated with the earliest buildings—the initial constructions of Structures Ajaw and Xa'an, and Platform Sulul (including those on maize grains)—concentrate around 950 b.c. with an approximate error range of ± 50 years, whereas those associated with subsequent construction episodes of those structures range between 950 and 850 b.c. I consider the three samples ranging between 1100 and 1000 b.c. to be old wood. The presence of ceramics in the fills of the earliest building stages suggests that the use of ceramics started slightly earlier than these constructions. Although the time span between the initial ceramic use and these buildings may be shorter than 50 years, I chose 1000 b.c. as the beginning date of the Real 1 phase to avoid a false sense of precision.
Ceramics from Ceibal. (a) Real 1-2 phases (1000-800 BC): (a1) Achiotes Unslipped; (a2) Abelino Red and Pico de Oro Incised, with postslip incisions; (a3–a4) Huetche White and Comistun Incised, with postslip incisions; (a5) Crisanto Black. (b) Real 3 (800-700 BC) and Escoba 1 (700-600 BC) phases: (b1) Yalmanchac Impressed; (b2) Abelino/Juventud Red and Pico de Oro/Guitarra Incised (preslip incisions); (b3) Ditale Dichrome; (b4) Huetche White; (b5) Crisanto/Chunhinta Black and Chompipi/Deprecio Incised, with preslip incisions. Achiotes Unslipped jars and bowls with direct rims continue into the Real 3 and Escoba 1 phases. Many characteristic shapes and decorations of the Real 3 phases continue into the Escoba 1 phase, but the latter is defined by the predominance of waxy slips and the appearance of Tierra Mojada Resist. Drawing by Alfredo Román.

Most traits of the Real 1 ceramics continued into the Real 2 phase (850–775 b.c.), but the ratio of white slipped vessels to red slipped ones gradually declined and that of thicker vessels increased. A handful of large horizontally everted rims appear to date to this phase. Although Clark and Cheetham (Cheetham Reference Cheetham and Powis2005; Clark and Cheetham Reference Clark, Cheetham and Parkinson2002) suggest that this type of rim is a horizon marker of pre-Mamom ceramics, their frequency is extremely small at Ceibal. We obtained eleven dates from Real 2 levels of Platform Ch'och’, consisting of a series of thin, superimposed floors. Most of these floors were burned, and we assume that most of our carbon samples derived from on-floor burning. It is unlikely that they represent re-deposited old carbon. This stratigraphic information, along with three additional dates from other areas and the steep slope of the radiocarbon calibration curve, made the Bayesian analysis highly effective, resulting in a tight date range of 850 to 775 b.c. These high-precision dates provide a solid basis for our argument that the residents of Ceibal built monumental architecture by 800 b.c.
During the Real 3 phase (775–700 b.c.), postslip incisions were largely replaced by preslip grooves. Shallow plates became a characteristic form of this period, and some of them were decorated with chamfering, small horizontally everted rims, or grooved double-line-breaks. Other markers of the Real 3 phase include the increased importance of black slips (Crisanto Black) and dichromes (Toribio Red-and-cream and Muxanal Red-and-cream), and plain or partially red-slipped composite silhouette bowls and jars with fingernail-like impressions (Baldizon Impressed, Yalmanchac Impressed). Bowls with exterior-thickened rims nearly disappear. Mamom-like ceramics with waxy slips began to appear in small quantities during this phase. Because of the flattening of the calibration curve, it is difficult to determine the end of this phase precisely. I arbitrarily assigned an end date of 700 b.c.
Pasión Region
The relative chronology of the Xe ceramics at Altar de Sacrificios and the Real ceramics from Ceibal has long been a point of debate. Sabloff (Reference Sabloff and Willey1975:229) and Willey (Reference Willey and Willey1990:195) originally suggested that the Altar de Sacrificios materials are similar to those from upper layers of the Real contexts at Ceibal and Adams (Reference Adams1971:117, 146) also noted that the Xe ceramics corresponded to the late part of the Real ceramics. Andrews (Reference Andrews, Harrison and Clancy1990), however, suggested that the Xe and Real ceramics derived from those in Chiapas or the northern Guatemalan highlands, and that the Altar materials, located closer to Chiapas, were earlier than the Ceibal ceramics. Our Real chronology firmly supports the former view, and I correlate the Xe phase of Altar de Sacrificios to our Real 3 phase. My observations of Altar ceramic samples stored at the Instituto de Antropología e Historia in Guatemala City confirmed that the Xe ceramics showed relatively glossy slips similar to some of the Real 3 materials. The report of the Altar ceramics (Adams Reference Adams1971) also shows typical Real 3 markers, including double line breaks and other grooved motifs, shallow plates with chamfering or small horizontally everted rims, bowls with fingernail-like impressions, and the prominence of black slip and dichromes. The Xe ceramics at Altar de Sacrificos were found in a small number of deposits without internal stratigraphic sequences comparable to those at Ceibal (Adams Reference Adams1971:79–84). This pattern probably reflects a shorter duration of the Xe occupation at Altar than that of Real.
Outside of Ceibal and Altar de Sacrificios, sporadic occurrence of pre-Mamom ceramics has been reported in the Pasión region. At Punta de Chimino, Bachand (Reference Bachand2006, Reference Bachand2007) uncovered Xe-corresponding materials, which he named Colonia ceramics. This complex is also characterized by Real-3 markers. At Itzan, Johnston (Reference Johnston2006:Figure 11) found a small quantity pre-Mamom ceramics, which most likely correspond to the Real 3 phase. At the minor settlement of Caobal in the periphery of Ceibal, Munson and Pinzón G. (Reference Munson and Pinzón2017) unearthed a small amount of Real ceramics. Some of them clearly belong to the Real 3 phase although the occupation may have started during the Real 2 phase. No buildings on raised platforms or mounded structures dating to the Real phase have been found at any of these sites beside Ceibal.
It appears that for a few centuries Ceibal was the only settlement, or one of a few, in the Pasión region with substantial architecture and the use of ceramics. Much of the region probably continued to be inhabited by mobile groups who maintained the traditional, preceramic lifeway without the use of ceramics and substantial architecture (Inomata et al. Reference Inomata, MacLellan, Triadan, Munson, Burham, Aoyama, Nasu, Pinzon and Yonenobu2015a, Reference Inomata, MacLellan and Burham2015b). Lohse (Reference Lohse2010) has also suggested the co-existence of sedentary and mobile populations in other parts of the Maya lowlands, and Arnold (Reference Arnold, Skibo and Feinman1999, Reference Arnold, Clark and Pye2000, Reference Arnold2009) and Rosenswig (Reference Rosenswig2010, Reference Rosenswig and Lesure2011) have pointed out similar situations on the southern Gulf Coast and the Pacific Coast during the Early Preclassic. At Ceibal, we have not found any Real-1 structures that can be confirmed to have been residential. The only potential exception is Platform Sulul under the A-24 Platform, but it is not clear whether this broad platform was used for communal, ritual, or residential purposes (Triadan et al. Reference Triadan, Castillo, Inomata, Manuel Palomo, Belén Méndez, Cortave, MacLellan, Burham and Ponciano2017). The excavation of the Karinel Group (Platform 47-Base) located next to Group A by MacLellan (Reference MacLellan, Aguilar and Inomata2012) revealed artifact deposits and a burial dating to the Real 2 and 3 phases, but occupation during the Real 1 phase has not been confirmed. The Excavations and survey by the Harvard team showed that Real remains are concentrated in Groups A and C, and Tourtellot (Reference Tourtellot and Willey1988) estimated that the population of Ceibal during the Real phase was less than 500 people. Given the findings from our excavations, much of the remains found by Harvard researchers may date to the Real 2 and 3 phases. The earliest building at Ceibal that can be reasonably interpreted as a dwelling is Platform K'at, found under the East Court, which dates to the Real 3 phase and probably served as a residential complex for the emerging elite (Triadan et al. Reference Triadan, Castillo, Inomata, Manuel Palomo, Belén Méndez, Cortave, MacLellan, Burham and Ponciano2017).
I suggest that a significant portion of the Ceibal community maintained relatively mobile lifeways during the Real phase (see Inomata et al. Reference Inomata, MacLellan, Triadan, Munson, Burham, Aoyama, Nasu, Pinzon and Yonenobu2015a, Reference Inomata, MacLellan and Burham2015b for more detailed discussion). These mobile groups may have visited Ceibal for construction projects and public rituals organized by the emerging elite, who may have adopted the sedentary way of life earlier than the rest of the community. There is a growing understanding among archaeologists across the world that the construction of ceremonial complexes does not necessarily require the presence of sedentary agriculturalists. Some of the earliest monumental ceremonial complexes in various parts of the world, including the pre-pottery Neolithic shrines at Göbekli Tepe in Turkey, preceramic temples in the Andes, and monumental mounds in the southeastern United States, were built by hunter-gatherers, those practicing mixed subsistence, or mobile horticulturalists (Burger and Rosenswig Reference Burger and Rosenswig2012; Clark and Knoll Reference Clark, Knoll and White2005; Izumi and Sono Reference Izumi and Sono1963; Schmidt Reference Schmidt2010; Shady Solis et al. Reference Shady Solis, Haas and Creamer2001). While this possibility has rarely been discussed in the Maya area, relevant data should be further explored.
EARLY LOWLAND MAYA CERAMICS
Early Middle Preclassic ceramics from the Maya lowlands outside of the Pasión region include the followings: (1) the Swasey and Bladen complexes and related materials reported from Cuello (Kosakowsky Reference Kosakowsky1987; Kosakowsky and Pring Reference Kosakowsky and Pring1998), Colha (Valdez Reference Valdez1987), K'axob (López Varela Reference López Varela and McAnany2004), San Estevan (Cruz Alvarado and Rosenswig Reference Cruz Alvarado and Rosenswig2009; Rosenswig Reference Rosenswig, Morris, Jones, Awe and Helmke2008), and Ka'Kabish (Haines et al. Reference Haines, Gomer, Sagebiel, Morris, Awe, Badillo and Thompson2014); (2) the Cunil and Early Jenney Creek complexes and related materials from Cahal Pech (Awe Reference Awe1992; Cheetham Reference Cheetham and Powis2005; Healy et al. Reference Healy, Cheetham, Powis, Awe and Garber2004b; Sullivan et al. Reference Sullivan, Kathryn Brown, Awe, Morris, Jones, Awe, Thompson and Helmke2009), Blackman Eddy (Brown and Garber Reference Brown, Garber and Powis2005; Garber et al. Reference Garber, Kathryn Brown, Awe, Hartman and Garber2004a, Reference Garber, Kathryn Brown, David Driver, Glassman, Hartman, Kent Reilly, Sullivan and Garber2004b), Pacbitun (Healy Reference Healy1990; Healy et al. Reference Healy, Hohmann, Powis and Garber2004a; Powis et al. Reference Powis, Healy, Hohmann, Morris, Jones, Awe, Thompson and Helmke2009), Xunantunich (LeCount and Mixter Reference LeCount and Mixter2016), Actuncan (LeCount and Mixter Reference LeCount and Mixter2016), and Holmul (Callaghan and Neivens de Estrada Reference Callaghan and Neivens de Estrada2016; Estrada-Belli Reference Estrada Belli, Burger and Rosenswig2012; Neivens de Estrada Reference Neivens de Estrada and Braswell2014); (3) the Eb complex from Tikal (Culbert Reference Culbert1977; Laporte and Valdés Reference Laporte and Antonio Valdés1993), Uaxactun (Cheetham Reference Cheetham and Powis2005), Nakum (Źrałka et al. Reference Źrałka, Koszkul, Hermes, Helmke and Źrałka2012), and the Ah Pam complex or Eb-related materials from the Peten Lake region (D. Rice Reference Rice1976; P. Rice Reference Rice1979, Reference Rice2009, Reference Rosenswig, Pearsall, Masson, Culleton and Kennett2015); (4) the Chiuaan complex from the Middle Usumacinta region (Rands Reference Rands, Rice and Sharer1987, Reference Rands2002); and (5) the Ek complex and related materials from Komchen and Kiuic (Andrews et al. Reference Andrews, Bey and Gunn2008) (see Figure 2). Among them, Cuello, Cahal Pech, and Blackman Eddy provide a substantial number of early radiocarbon dates, and have been foci of chronological discussion. For those sites, dates of 1200 to 1100 b.c. have been suggested as the beginning of ceramic use (Cheetham Reference Cheetham and Powis2005; Garber et al. Reference Garber, Kathryn Brown, Awe, Hartman and Garber2004a; Hammond Reference Hammond1991; Healy et al. Reference Healy, Cheetham, Powis, Awe and Garber2004b), but I agree with the recent assessment by Lohse (Reference Lohse2010) that there are no reliable radiocarbon dates indicating sedentary occupation and ceramic use in the Maya lowlands prior to 1000 b.c. Although some scholars prefer to place these ceramics in the Early Preclassic period (Brown Reference Brown2007; Garber and Awe Reference Garber, Awe, Morris, Jones, Awe, Thompson and Helmke2009), I believe that it make more sense to call the period after 1000 b.c. the Middle Preclassic and to characterize these ceramics as Middle Preclassic materials as well. Significant economic and political changes took place around 1000 b.c. across southern Mesoamerica (Rosenswig Reference Rosenswig2010), and the emergence of lowland Maya ceramics can also be understood in this broader context, as discussed below.
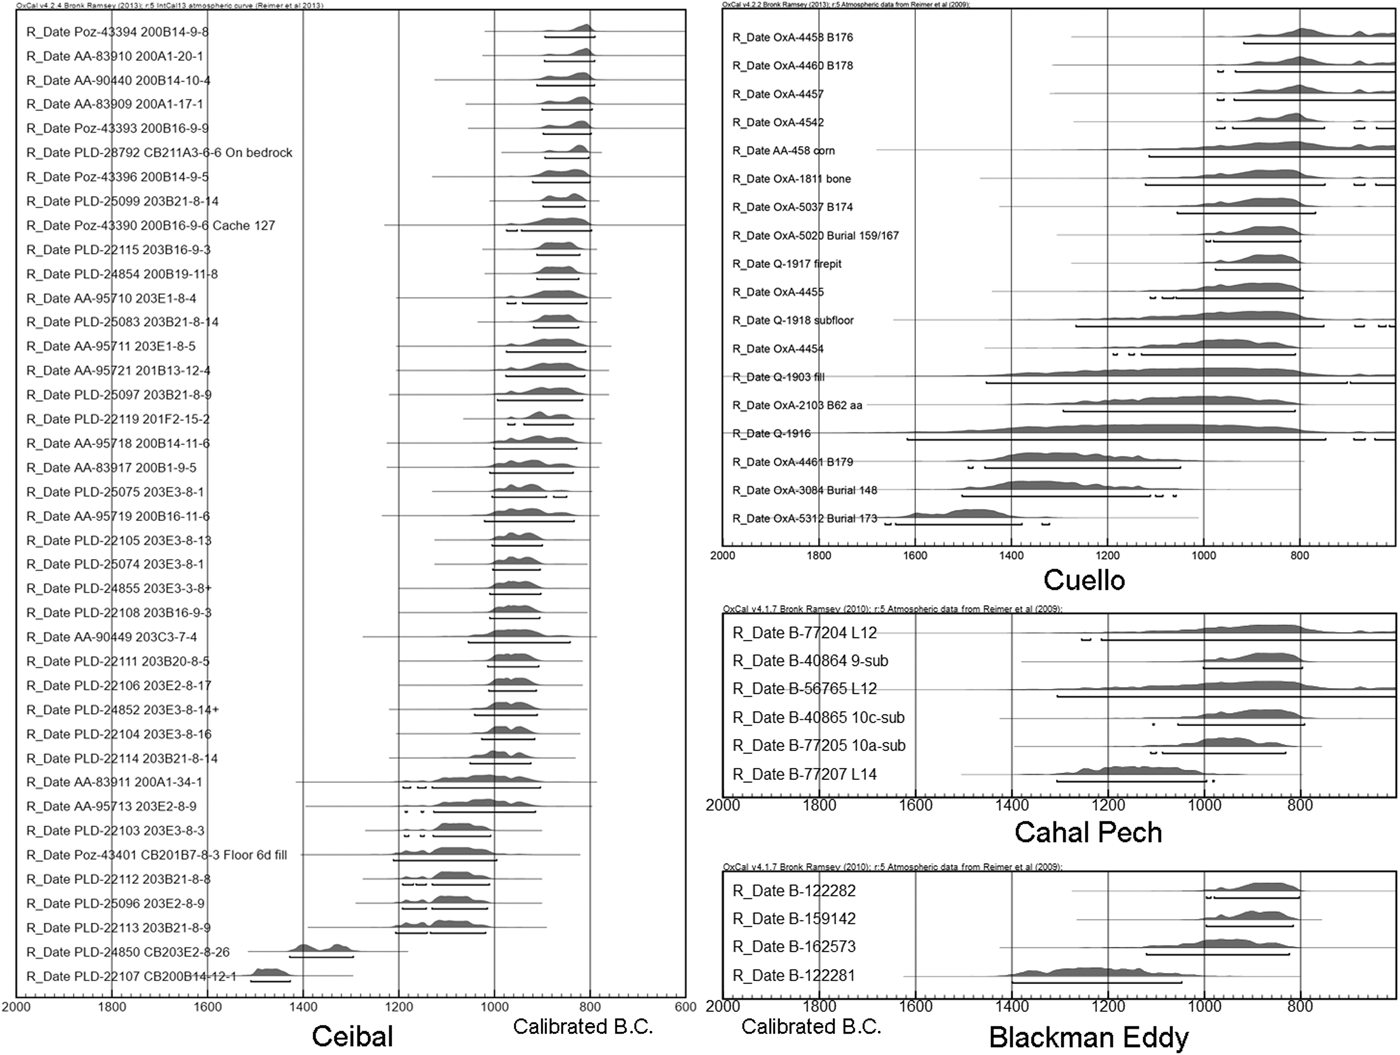
My estimated date of 1000 b.c. for the beginning of occupation at Ceibal, as opposed to 1200–1100 b.c. proposed for Cuello, Cahal Pech, and Blackman Eddy, does not result from the lack of early radiocarbon dates but from our conservative evaluation of them. This pattern should be clear when we compare the age-ordered distributions of radiocarbon dates from these sites (Figure 4). This figure does not include dates from Ceibal older than 1500 b.c. that are obviously unreliable possibly because of the small amount of carbon (less than 0.5 mg). The figure shows that at Ceibal we have six or seven radiocarbon dates with a range nearly completely falling before 1000 b.c. (the specific number depends on whether we reject PLD-22107 as natural-origin carbon included in soil used for construction fill), whereas Cuello has three and Blackman Eddy has one radiocarbon date with a range nearly completely predating 1000 b.c. (for Cuello, problematic dates for samples collected before 1976 are excluded; see Andrews and Hammond Reference Andrews and Hammond1990; Hammond Reference Hammond2002). At Cahal Pech, more recently obtained dates show pre-1000 b.c. dates (1120–910 b.c., 1280–1010 b.c., 1360–1350 b.c., and 1310–1050 b.c.) (Sullivan and Awe Reference Sullivan, Awe and Aimers2013), but their conventional radiocarbon dates and specific stratigraphic information have not been published, and they are not included in Figure 4.
Probability distributions of calibrated radiocarbon dates from Ceibal, Cuello, Blackman Eddy, and Cahal Pech. Only radiocarbon dates older than 2600 are shown. For Ceibal, unreliable date measurements due to small amount of carbon (less than 0.5 mg) are excluded. The bars under the probability distributions represent 95.4 percent probability ranges.

The application of Bayesian statistics allows us to evaluate the radiocarbon dates from these sites more rigorously. The following discussion is based on radiocarbon dates, stratigraphic sequences, and ceramic chronologies as reported for Cuello (Bronk Ramsey et al. Reference Bronk Ramsey, Higham, Owen, Pike and Hedges2002:91–92; Hammond Reference Hammond1991; Hammond et al. Reference Hammond, Donaghey and Clarke1995), Blackman Eddy (Brown Reference Brown2001, Reference Brown2007; Brown and Garber Reference Brown, Garber and Powis2005; Garber et al. Reference Garber, Kathryn Brown, Awe, Hartman and Garber2004a), and Cahal Pech (Awe Reference Awe1992; Healy and Awe Reference Healy and Awe1995; Healy and Awe Reference Healy and Awe1996; Healy et al. Reference Healy, Cheetham, Powis, Awe and Garber2004b; Sullivan and Awe Reference Sullivan, Awe and Aimers2013). Lohse (Reference Lohse2010) also lists most of those dates.
Northern Belize
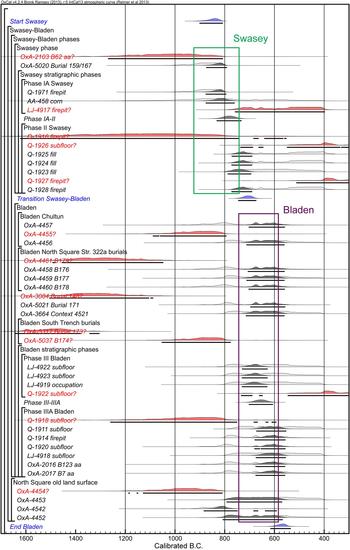
The detailed stratigraphic description of excavations of Platform 34 at Cuello (Hammond Reference Hammond1991) provides a solid basis for Bayesian modeling (Figure 5). The Swasey phase consists of Phases 0, I, and II in terms of the stratigraphic sequence, whereas the stratigraphic positions of the North Square old land surface (OxA-4452, 4453, 4454, and 4542) from the 1993 excavation are not clear. Two measurements from Phase IA, as well as Burial 159/167, exhibit ranges roughly between 900–800 b.c., which may reflect the span of the Swasey phase. An evaluation of possible outliers is critical for the assessment of whether the Swasey ceramics started before 1000 b.c. Carbon sample Q-1916 (2895 ± 200) was collected from a fire pit from Phase II and its date, substantially earlier than those from Phase I, is clearly out of sequence. In addition, its wide range of uncertainty makes this date problematic, and it is best excluded from the model.
Bayesian-modeled calibrated radiocarbon dates from Cuello (from Hammond Reference Hammond1991; Hammond et al. Reference Hammond, Donaghey and Clarke1995; Bronk Ramsey et al. Reference Bronk Ramsey, Higham, Owen, Pike and Hedges2002). Although the figure only shows dates for the Swasey and Bladen phases, the Bayesian model included dates from the Lopez-Mamom phase to narrow down the transition date between the Bladen and Lopez phases. The possible ranges for the Swasey and Bladen phases are based on ceramic cross-dating in addition to the radiocarbon dates. Outliers excluded from the Bayesian model are indicated by ”?” at the end of the sample names. The premodeled distributions of calibrated date probabilities are indicated by light shadows, whereas the modeled (after the application of Bayesian statistics) distributions of calibrated date probabilities are shown by solid fills. Dates measured by Beta Analytic were indicated by a shortened lab code (B).

Two dates taken from human bones found in Burials 62 and 179 are particularly important for this discussion: 2840 ± 100 (OxA-2103; bone) and 3040 ± 80 (OxA-4461; bone) (Hammond et al. Reference Hammond, Cartwright Gerhardt, Donaghey and Hammond1991a:31). Lohse (Reference Lohse2010) has suggested that these two burials without ceramic offerings are probably from preceramic occupation. I suspect, however, that they are more likely from the Swasey or Bladen phases and these dates should probably be rejected as unreliable measurements. Burial 62 was found in a bedrock cleft, and its stratigraphic position is not clear (Hammond et al. Reference Hammond, Cartwright Gerhardt, Donaghey and Hammond1991a:31). The investigators originally obtained a date of 2460 ± for this bone, which they considered unacceptable. Problems derive from the fact that bones from this burial were treated with consolidants, polyvinyl acetate (PVA) and polyvinyl alcohol (PV-OH). As petroleum-based materials, PVA/PV-OH would give an older date than the real age. Re-measurement of this skeleton through a standard pretreatment (the extraction of crude collagen) yielded a date of 3750 ± 70 (OxA-1648) (Hammond et al. Reference Hammond, Cartwright Gerhardt, Donaghey and Hammond1991a:31). Law et al. (Reference Law, Housley, Hammond and Hedges1991) applied subsequent treatments to the samples, which improved the measurements. The extraction of crude gelatin (this still contains a portion of PVA/PV-OH) OxA-1649 yielded a date of 3000 ± 60, considered adequate by the excavators (see Hammond et al. Reference Hammond, Cartwright Gerhardt, Donaghey and Hammond1991a:32). Samples OxA-2103 and OxA-2166, amino acids from ion-exchanged gelatin, yielded dates of 2840 ± 100 and 2830 ± 70 (Law et al. Reference Law, Housley, Hammond and Hedges1991:311), respectively. The most reliable date should be the one on extracted amino acids that falls around 1000 b.c., not the one on crude gelatin that completely predates 1000 b.c. Even for the date on extracted amino acids, Law et al. (Reference Law, Housley, Hammond and Hedges1991:314) note that “the four 14C dated burials from Cuello (7, 10, 62, 123) [which have been treated with PVA/PV-OH], should be considered with some caution.” Thus, Burial 62 most likely does not substantially predate 1000 b.c. I suggest that these contaminated samples should be excluded from chronological consideration.
Burial 179, a female placed with an infant (Burial 180), was found in the 1993 excavation of the North Square, along with three other burials (Burials 176, 177, and 178) all placed within a small area some 2 meters across. The investigators consider the fact that the burials were tightly clustered together, but did not intrude upon each other, and reason that they were interred within a short period, possibly under an earth-floored precursor of Bladen-phase Structure 322a. Burial 178 contained two Bladen-phase bowls, and their Bladen dates are generally consistent with radiocarbon dates from bones, OxA-4458 (2600 ± 75) from Burial 176, OxA-4459 (2545 ± 70) from Burial 177, and OxA-4460 (2620 ± 75) from Burial 178 (Hammond et al. Reference Hammond, Donaghey and Clarke1995:124). The excavators suggest that Burial 179 belongs to a period before 1000 b.c. and that the other interments were placed later under the same building (Hammond et al. Reference Hammond, Donaghey and Clarke1995:127). It is highly unlikely, however, that one structure continued to serve as a burial place with an interval of roughly five centuries between interments. Most importantly, the excavators note that “the grave floors were just above bedrock, but the shafts were cut from a higher, albeit undetermined, level” which indicates that Burial 179 does not belong to the earliest phase in the stratigraphic sequence (Hammond et al. Reference Hammond, Donaghey and Clarke1995:126). The contextual information implies that Burial 179 is more likely contemporaneous with the nearby Bladen-phase burials, and its radiocarbon date is probably unreliable.
In addition, human bones from Burials 148 and 173 have yielded old radiocarbon dates. Burial 148 was cut into the floor of Structure 315b in the North Square that was associated with Lopez Mamom ceramics (Hammond et al. Reference Hammond, Clarke and Robin1991b:355). The excavators originally dated this burial to the Lopez Mamom phase because of its association with Structure 315b and the presence of a Pital Cream vessel as a grave good (Hammond et al. Reference Hammond, Clarke and Robin1991b:358), but in the publication of its radiocarbon date they placed it in the Bladen phase (Bronk Ramsey et al. Reference Bronk Ramsey, Higham, Owen, Pike and Hedges2002:92). Its contextual information makes its Mamom date more likely. Even when we accept its Bladen placement, its radiocarbon date (3070 ± 80) is substantially older than most Swasey and Bladen dates, and should be rejected. Burial 173 found in the South Trench contained a Consejo Red Estrella variety of the Bladen phase (Hammond et al. Reference Hammond, Donaghey and Clarke1995:122). The excavators suggest that its radiocarbon date (3215 ± 65) is too old (Bronk Ramsey et al. Reference Bronk Ramsey, Higham, Owen, Pike and Hedges2002:92). Burial 174 located nearby may have been coeval to Burial 173. Its radiocarbon date, (2715 ± 75), is older than most other Bladen dates. These data indicate that a considerable number of radiocarbon dates on human bones from Cuello tend to show dates significantly older than the expected ranges. Various factors may have contributed to the old dates on Burials 62, 179, 148, 173, and 174, including contaminations, measurement errors on small amounts of carbon, and freshwater and marine reservoir effects resulting from the consumption of riverine and marine organisms.
A possibly early date based on charcoal is OxA-4454 (2800 ± 70) found in the 1993 excavation of the North Square. This sample was collected from a 1 × 1 m test block excavated in six five-centimeter arbitrary levels down to bedrock. OxA-4454 came from the fourth level from bedrock whereas another sample, OxA-4453 (2485 ± 70) originated in the fifth level. In the North Square, two other samples from comparable levels show ages younger than OxA-4454: OxA-4452 (2540 ± 70) and OxA-4542 (2650 ± 60). It appears that OxA-4454 is old wood or re-deposited old material. Two samples with date ranges around 1000 b.c. were collected from Bladen-phase contexts: OxA-4455 (2745 ± 75) and OxA-1918 (2750 ± 110). They are significantly older than samples from the same contexts and should be considered as old wood or re-deposited materials (Hammond et al. Reference Hammond, Donaghey and Clarke1995:124).
After excluding these outliers, the Bayesian model exhibits a relatively tight date distribution for each phase (Figure 5). The Swasey phase IA dates range from 900–780 b.c., the Swasey phase II from 780–700 b.c., and the Bladen phase from 700–600 b.c. Many of the radiocarbon dates from Cuello were obtained in the late 1970s and early 1980s when measurements were less accurate and less precise than today, and this chronology may change when more additional dates from northern Belize are collected. Still, it is reasonable to say that reliable evidence of ceramic use before 1000 b.c. at Cuello is lacking in the current data set. Joyce and Henderson (Reference Joyce and Henderson2001) argue for the Early Preclassic date of the Swasey phase by referring to the presence of pattern-burnish decorations (Patchchacan Pattern-burnished) in the Swasey ceramics and the Chotepe complex at Puerto Escondido, Honduras, which they date to 1100–900 b.c. The pattern burnish technique, however, continues into the Middle Preclassic period in Honduras, including the Chilcal complex at Yarumela (Joesink-Mandeville Reference Joesink-Mandeville, Henderson and Beaudry-Corbett1993), the Achiote complex in the Naco valley (Urban et al. Reference Urban, Schortman and Ausec2002), and the Sula complex at Playa de los Muertos (Kennedy Reference Kennedy1981:136). Thus, the presence of pattern burnishing at Cuello does not necessarily indicate Early Preclassic dates.
For the Bladen phase, I see little evidence to support its beginning date of 900 b.c. suggested by the excavators of the site (Hammond Reference Hammond1991). Most acceptable Bladen dates have unmodeled date ranges of 800–400 b.c.; in the case of a few samples the earliest end of the 95.4 percent probability range barely reaches 900 b.c. Cudjoe Composite in the Bladen complex with a band of fingernail impressions and partial red slip closely resembles Yalmanchac Impresses at Ceibal, which is a good temporal marker for the Real 3 (775–700 b.c.) and Escoba 1 (700–600 b.c.) phases. I suspect that the Bladen phase is largely contemporaneous with those phases at Ceibal. Comparison of ceramics from Cuello and Cahal Pech has suggested to Kosakowsky (Laura Kosakowsky, personal communication 2013) that the Bladen phase corresponds to the late part of the Cunil phase and the Early Jenney Creek phase, reflected mainly in the presence of Tower Hill Red on Cream vessels in the two regions (Ball and Taschek Reference Ball and Taschek2003). This observation puts the Bladen phase roughly between 800 and 600 b.c. If so, the Swasey phase may be roughly contemporaneous with the early part of the Cunil phase, dating to 1000–800 b.c.. Although my view of the Cuello chronology is somewhat different from that of its excavators, I should note that such a re-evaluation was only possible because of the systematic application of radiocarbon dates and the exemplary reports of contexts and stratigraphy by Hammond and his team.
Belize River Valley
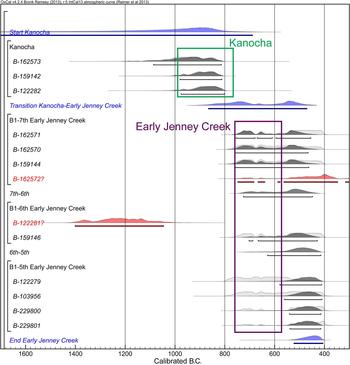
The excavators of Blackman Eddy date the Kanocha phase, which is closely tied to the Cunil complex, to 1100–900 b.c., the Early Jenney Creek phase to 900–700 b.c., and the Mamom-corresponding Late Jenney Creek phase to 700–350 b.c. (Garber et al. Reference Garber, Kathryn Brown, Awe, Hartman and Garber2004a). The claim of the pre-1000 b.c. occupation at Blackman Eddy is largely based on a single date, 2990 ± 60 (Garber et al. Reference Garber, Kathryn Brown, Awe, Hartman and Garber2004a:29), which is substantially earlier than the other Kanocha-phase dates. Although some publications report that this sample was collected from a pit dug directly into bedrock, Brown (Kathryn Brown, personal communication 2013) confirmed that it was taken from a pit cut into a plaza floor associated with Structure B1–6th (see Garber et al. Reference Garber, Kathryn Brown and Hartman2001:Figure 10). Thus, the deposit does not belong to the earliest level in the construction sequence of this site and is out of sequence. This date should probably be excluded from chronological consideration as an outlier (Figure 6). The three other samples obtained from Kanocha contexts have date ranges falling largely between 1000–800 b.c. Thus, there is no clear evidence that sedentary occupation with ceramic use began at Blackman Eddy before 1000 b.c. Likewise, there is little evidence to support the argument that the Early Jenney Creek phase started at 900 b.c. The date of 900 b.c. corresponds to the highest probability of the three Kanocha-context samples, and the 95.4 percent probability range of all the samples from the Early Jenney Creek contexts fall squarely in the period between 800–400 b.c. Early Jenney Creek pottery shares temporal markers with the Real 3 ceramics, including shallow plates and preslip grooves (Ball and Taschek Reference Ball and Taschek2003; Gifford Reference Gifford1976). The Early Jenney Creek phase likely dates to 800–700 b.c., contemporaneous with the Real 3 phase.
Bayesian-modeled calibrated radiocarbon dates from Blackman Eddy (from Garber et al. Reference Garber, Kathryn Brown and Hartman2001, Reference Garber, Kathryn Brown, Awe, Hartman and Garber2004a). Although the figure only shows dates for the Kanocha and Early Jenney Creek phases, the Bayesian model included dates from the Late Jenney Creek phase to narrow down the transition date between the Early and Late Kanocha phases. The possible ranges for the Kanocha and Early Jenney Creek phases are based on ceramic cross-dating in addition to the radiocarbon dates.

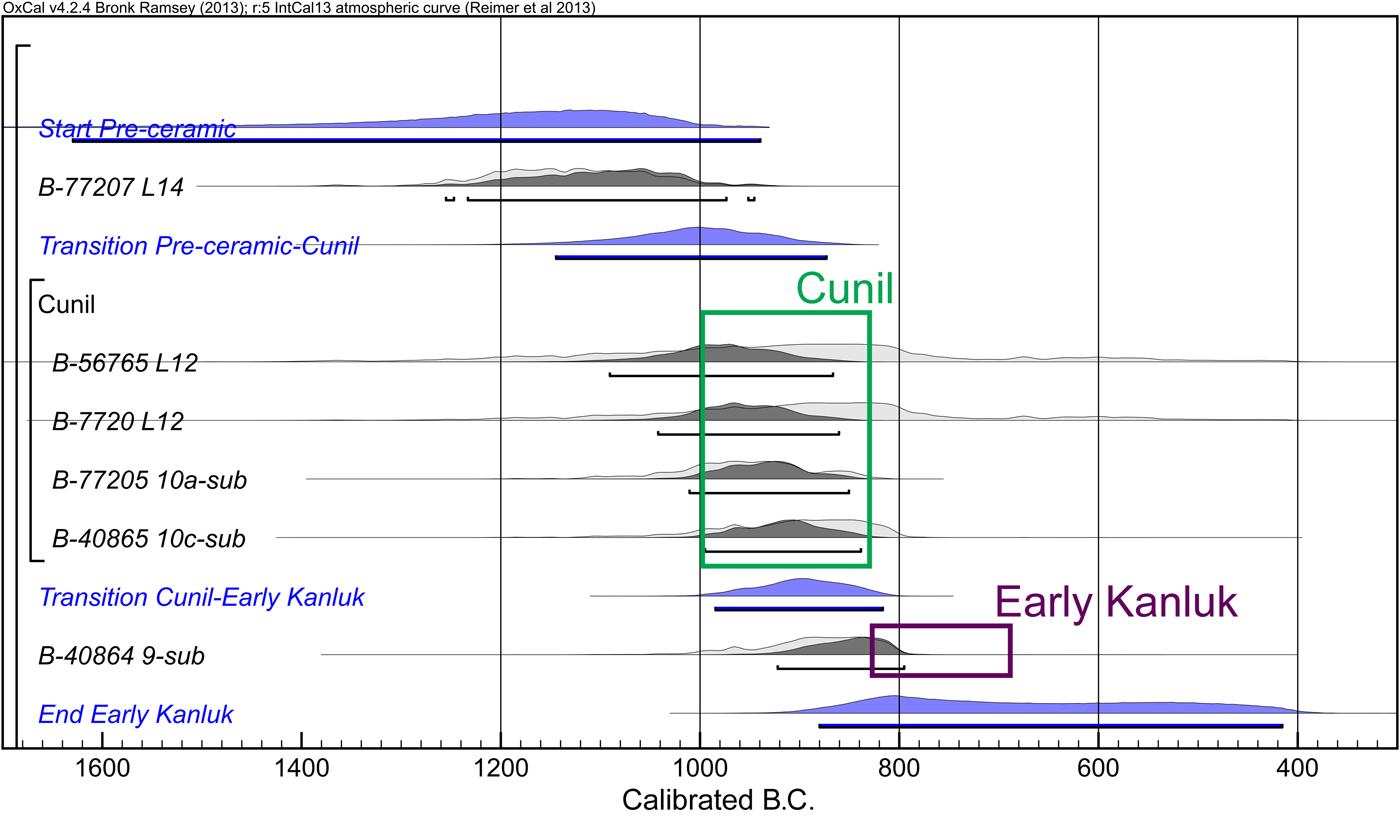
The excavations of Plaza B and Structure B4 at Cahal Pech yielded four radiocarbon measurements predating 1000 b.c. (Healy and Awe Reference Healy and Awe1995; Sullivan and Awe Reference Sullivan, Awe and Aimers2013). Three of them came from Level 12 or below under Structure B4; in Level 13 of this area excavators found abundant chert debitage but no ceramics. Cheetham (Reference Cheetham, Healy and Awe1995:27; see also Healy et al. Reference Healy, Cheetham, Powis, Awe and Garber2004b) suggests that this layer may correspond with a preceramic occupation. If so, we need to consider the possibility that the samples from Level 13 represent the dates of the preceramic occupation and the one from Level 12 was re-deposited from this earlier period (Lohse Reference Lohse2010). Other dates with a clearer association with the Cunil ceramics fall around 1000 b.c. or later, corresponding fairly well with the Real 1 phase (Figure 7). The single Early Kanluk phase (corresponding to the Early Jenney Creek phase) date from Cahal Pech completely overlaps with the Cunil dates, and is likely old wood or a re-deposited material. The Early Kanluk phase is better placed after 800 b.c., as indicated by the dates of the equivalent Early Jenney Creek phase from Blackman Eddy.
Bayesian-modeled calibrated radiocarbon dates from Cahal Pech (from Healy and Awe Reference Healy and Awe1995). Although the figure only shows dates for the possible preceramic, Cunil, and Early Kanluk phases, the Bayesian model included dates from the Late Kanluk phase to narrow down the transition date between the Early and Late Kanluk phases. The possible ranges for the Cunil and Early Kanluk phases are based on ceramic cross-dating in addition to the radiocarbon dates.
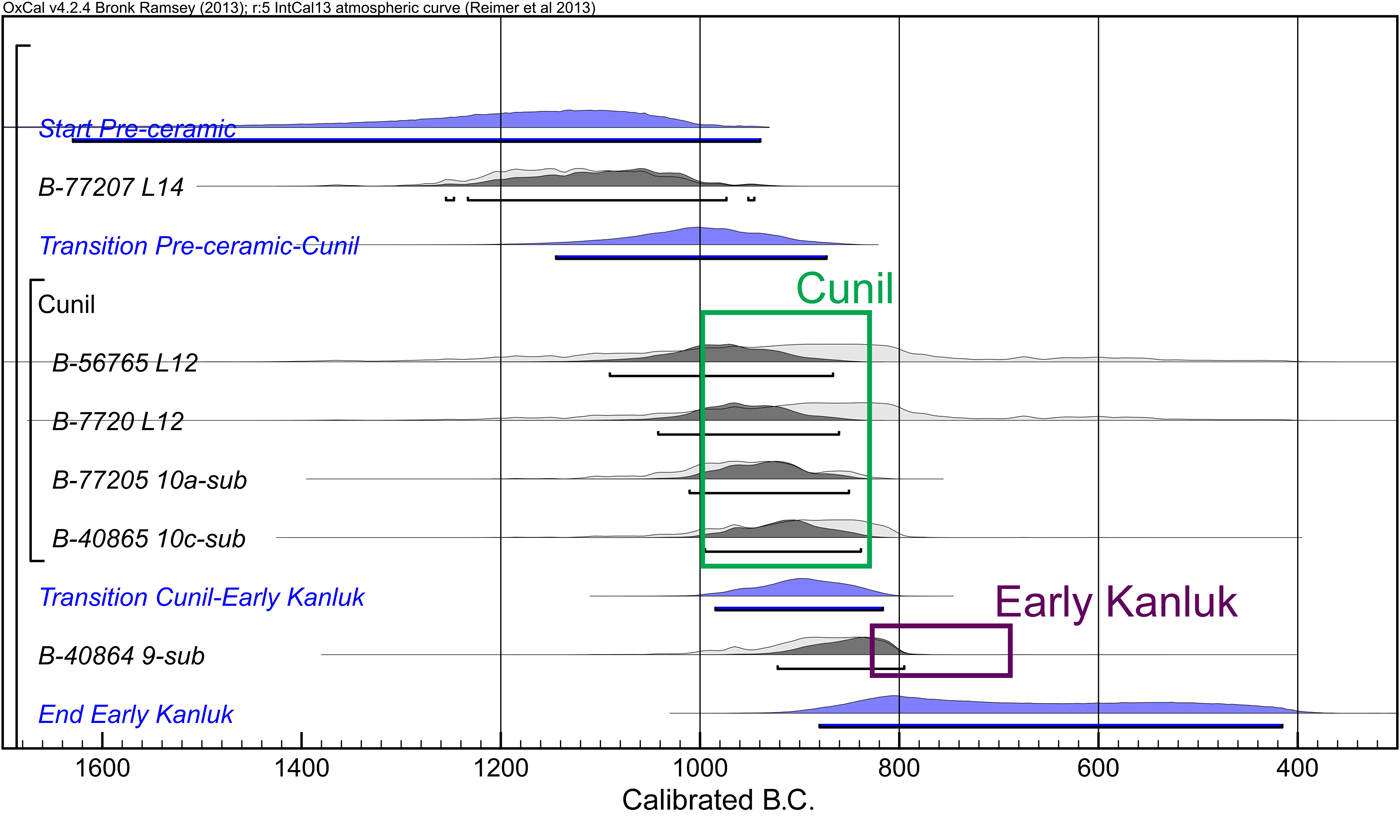
Until more radiocarbon dates with unequivocal association with ceramics are obtained, I concur with Lohse (Reference Lohse2010) that the Cunil complex should be placed in the period after 1000 b.c., contemporaneous with the Real ceramics. I thus disagree with those researchers who have suggested that the Cunil ceramics belong to the Early Preclassic period (Brown Reference Brown2007; Garber and Awe Reference Garber, Awe, Morris, Jones, Awe, Thompson and Helmke2009). The cross-dating of Cunil and other lowland ceramics with those of the surrounding regions is difficult because the transition from the Early to Middle Preclassic ceramics is gradual in many areas, and the ceramic chronologies of most regions do not have sufficient temporal resolution and precision. Still, various lines of evidence favor the placement of the Cunil pottery in the Middle Preclassic rather than in the Early Preclassic. First, in the Early Preclassic complexes of many regions before 1000 b.c., including the Chiapas-Guatemalan coast, the northern Maya highlands, and the southern Gulf Coast, tecomates were predominant, whereas necked jars were rare or absent. During the Middle Preclassic after 1000 b.c., necked jars became increasingly common, although tecomates also continued (Bryant et al. Reference Bryant, Clark and Cheetham2005; Clark and Cheetham Reference Clark, Cheetham, Meino Carrión and García Cook2005; Coe and Flannery Reference Coe and Flannery1967; Sharer and Sedat Reference Sharer and Sedat1987; von Nagy Reference von Nagy2003). The predominance of necked jars in the Cunil complex over tecomates (Sullivan et al. Reference Sullivan, Kathryn Brown, Awe, Morris, Jones, Awe, Thompson and Helmke2009:163) suggests their Middle Preclassic, that is, post-1000 b.c. date. Second, the Cunil ceramics apparently lack characteristic Early Preclassic modes, including rocker-stamping and carved or scraped designs that are present on the southern Gulf Coast, on the Chiapas-Guatemalan Coast, in central Chiapas, and in the northern highlands (Baudez and Bequelin Reference Baudez and Bequelin1973; Bryant et al. Reference Bryant, Clark and Cheetham2005; Clark and Cheetham Reference Clark, Cheetham, Meino Carrión and García Cook2005; Coe and Flannery Reference Coe and Flannery1967; Love Reference Love2002; Lowe Reference Lowe, Lowe and Pye2007; Sharer and Sedat Reference Sharer and Sedat1987).
Third, characteristic Cunil forms, bowls with large horizontally everted rims, are found in a small number during the Real 2 phases (850–775 b.c.) of the Middle Preclassic period at Ceibal. This form may have been adopted later at Ceibal than in the Belize River valley, but it is unlikely that there exists a substantial temporal gap in the appearance of this characteristic mode in the two areas. Fourth, the published figurines from Cahal Pech and Blackman Eddy are ones with punched eyes (Garber et al. Reference Garber, Kathryn Brown, Awe, Hartman and Garber2004a:Figure 3.3; Healy et al. Reference Healy, Cheetham, Powis, Awe and Garber2004b), a characteristic temporal marker of the Middle Preclassic period after 1000 b.c. across wide areas (see Pinzón González Reference Pinzón González2011; Rosenswig Reference Rosenswig2010, Reference Rosenswig2012). The pan-Mesoamerican Olmec style with slit eyes of the Early Preclassic period is apparently lacking (Rosenswig Reference Rosenswig2010, Reference Rosenswig2012) although figurines were rare during the Cunil phase and the apparent absence of Early Preclassic figures does not preclude the possibility of Early Preclassic dates. Fifth, although it has been suggested that various iconographic motifs by postslip incisions belong to a pan-Mesoamerican symbolic system of the Early Preclassic period (Cheetham Reference Cheetham1998, Reference Cheetham and Powis2005; Garber and Awe Reference Garber, Awe, Morris, Jones, Awe, Thompson and Helmke2009), such incised motifs continued into the Middle Preclassic period and do not serve as tight horizon markers. Postslip incised motifs become common after 1200 b.c. on the Chiapas-Guatemalan coast and in central Chiapas (Clark and Cheetham Reference Clark, Cheetham, Meino Carrión and García Cook2005; Coe and Flannery Reference Coe and Flannery1967) and possibly earlier in central Mexico and Oaxaca (Flannery and Marcus Reference Flannery and Marcus1994; Niederberger Reference Niederberger1976), but they continue in the Middle Preclassic complexes after 1000 b.c. (for example, Arroyo and Paiz Reference Arroyo, Paiz and Arroyo2010:Figures 6.15–6.16, 6.28, 6.34 and, 6.43; Clark and Cheetham Reference Clark, Cheetham, Meino Carrión and García Cook2005:Figure 42a; Coe and Diehl Reference Coe and Diehl1980:Figures 178d and 178q; Love Reference Love2002:Figures 77c–77e, 78k, 80h, and 84b). The presence of horizontally everted rims in the Real 2 phase at Ceibal indicates that incised motifs on such rims and on associated vessels at Cahal Pech most likely belong to the Middle Preclassic. At Ceibal most incised patterns are simple lines and cross-hatching and the specific iconographic motifs reported from Cahal Pech are less common. This divergence most likely resulted from regional variations in aesthetic preferences, not from a temporal difference.
These observations suggest to me that the Real phase of Ceibal and the Cunil phase of the Belize River valley are largely contemporaneous, although I do not dismiss the possibility that the emergence of ceramics was slightly earlier in Belize than at Ceibal. There is substantial evidence that Archaic populations without ceramic use were well established in Belize in the period before 1000 b.c. (Iceland Reference Iceland1997; Lohse Reference Lohse2010; Lohse et al. Reference Lohse, Awe, Griffith, Rosenswig and Valdez2006; Rosenswig et al. Reference Rosenswig, Pearsall, Masson, Culleton and Kennett2014), whereas comparable evidence is currently absent at Ceibal. It is possible that the well-established Archaic populations in Belize facilitated the earlier adoption of ceramics there. The difference in timing of ceramic adoption in Belize and at Ceibal, however, if it existed, was likely fairly small.
Central and Northern Peten
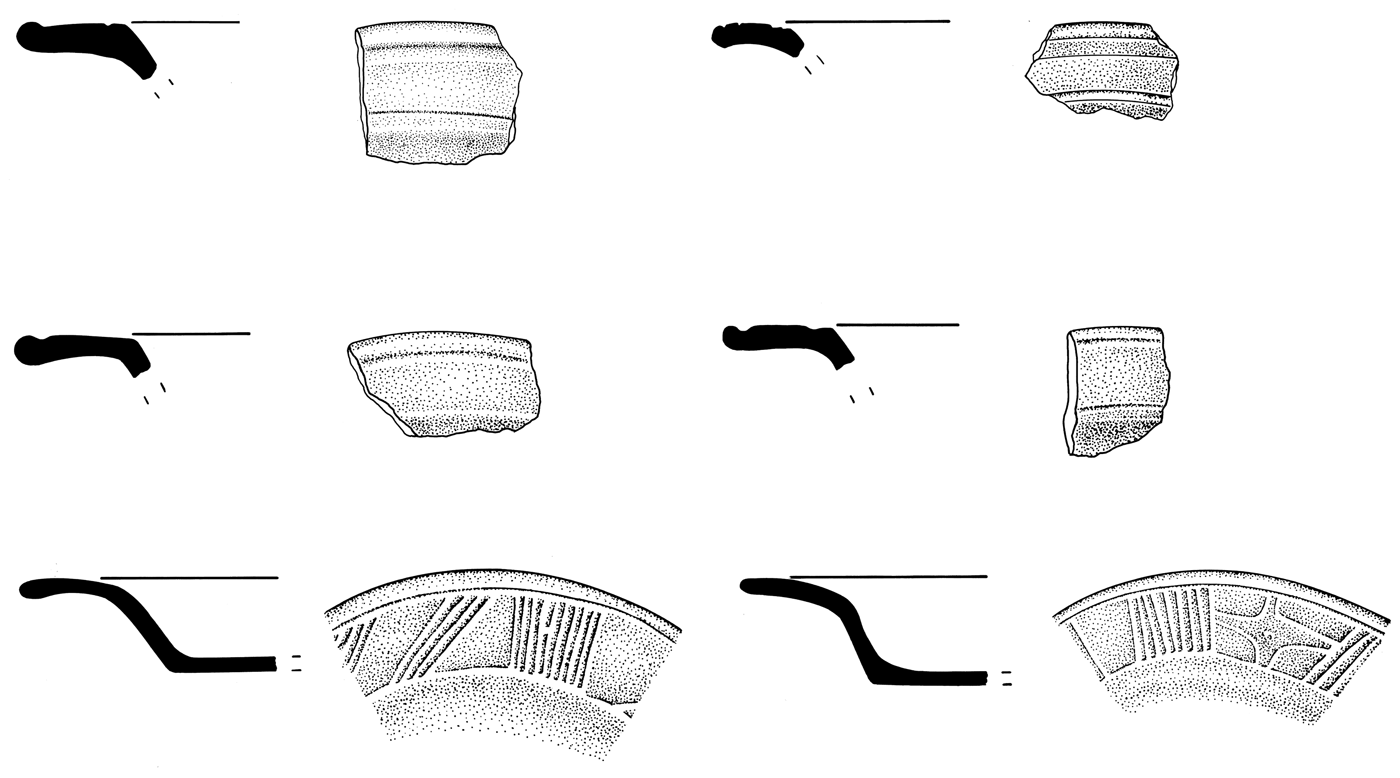
The Eb complex from Tikal and the closely related Ah Pam ceramics from around Lakes Yaxha and Sacnab do not have reliable radiocarbon dates, but their early facet share similarities with the Real and Cunil ceramics. My observation of the Eb ceramic collections at the University of Arizona and at Tikal gave me the impression that Calam Buff, along with Bil White, from Tikal exhibit similarities to Huetche White from Ceibal. Although many of Calam Buff vessels lack white slip (though some may have weak white wash), their self-slip derived from a fine cream paste gives an appearance similar to that of Huetche White. Bowls with exterior thickened or nearly everted rims represent a predominant form for Calam Buff and other types in the Early Eb complex, a characteristic shared by the Real 1–2 ceramics from Ceibal. Huetche-like white-slipped vessels and exterior folded rims are also present in the Ah Pam complex (P. Rice Reference Rice1979:Figures 4a–4d). Unslipped short-necked jars with smooth neck-wall juncture are similar to those from Ceibal, although the Ceibal Real collection includes medium-necked jars as well. Tikal's relation with the Belize River valley is reflected in the considerable frequency of horizontally everted rim bowls/plates and the common use of soft, fine pastes, some with volcanic ash temper. Tikal's examples of horizontally everted rims, however, typically have angled junctures with the wall, circumferential grooves, and lips slightly thickened into round profiles, which are different from the Belizean ones with smooth junctures and postslip incisions (Cheetham Reference Cheetham and Powis2005:Tables 3.3 and 3.4; Culbert Reference Culbert1977; Laporte and Valdés Reference Laporte and Antonio Valdés1993; P. Rice Reference Rice1979:Figures 4w, 4cc, 4dd, 5a, and 5c). A small number of everted rims found at Ceibal closely resemble Tikal examples (Figure 8). These observations suggest that the Early Eb complex involves a mix of traits shared with the Belize River valley and the Pasión region. Unique Tikal characteristics include jars with striations covering the exterior and interior of the neck and Cob Impressed with zoned impressions of small semi-circular instruments and red slip, which are sometimes referred to as fish-scale impressions or reed impressions. Figurines from the Early Eb phase exhibit the punched eyes characteristics of the Middle Preclassic (Laporte and Fialko Reference Laporte and Fialko1995:Figure 5).
Horizontally everted rims of bowls or plates from Ceibal (top), Tikal (middle), and the Belize River valley (bottom). Cahal Pech example redrawn by Alfredo Román from Awe Reference Awe1992:Figures 56 and 57.

An evaluation of the Late Eb ceramics is difficult because the specific proveniences of most samples stored at the University of Arizona and at Tikal are not clear. These Late Eb collections include a substantial number of sherds with Mamom-like glossy/waxy slips, however, as well as Tierra Mojada Resist that clearly belong to the Escoba-Mamom phase at Ceibal. A fair number of Mars Orange ware sherds probably originating in the Belize River valley are present, but nearly all of them seem to be of late forms dating to the later part of the Early Jenney Creek phase or the Mamom-corresponding Late Jenney Creek phase, including complex shapes and elaborate decorations with grooves. Early forms dating to the early part of the Early Jenney Creek phase, such as bowls/plates with outcurving walls-rims with unslipped exteriors, are almost absent. These observations suggest that the Late Eb complex is closer to early Mamom ceramics than to the Real 3 complex. Hermes (Bernard Hermes, personal communication 2013) also suggests that the Late Eb ceramics correspond to early Mamom. If so, the Early Eb phase may be divided into the early facet corresponding to the Real 1–2 phase (1000–775 b.c.) and the late facet contemporaneous with the Real 3 phase (775–700 b.c.), and the Late Eb complex should be aligned with the early part of the Escoba-Mamom complex (700–600 b.c.). In this regard, ceramics from Operation 27B of the University of Pennsylvania Project (Culbert Reference Culbert1977) include a substantial number of sherds with dull slips, but the early traits, including horizontally everted rims and exterior folded rims, are rare or absent. Bowls with outflaring walls and direct rims appear to be common in this collection, and typical Real 3-phase traits, such as shallow plates and chamfering, are present. These materials, classified as part of the Early Eb complex, may represent the Real-3 corresponding phase at Tikal. Although the Tikal chronology needs to be refined further with more stratigraphic information and radiocarbon dates, I would tentatively date the Early Eb phase to 1000/900–700 b.c. and the Late Eb phase to 700–600 b.c.
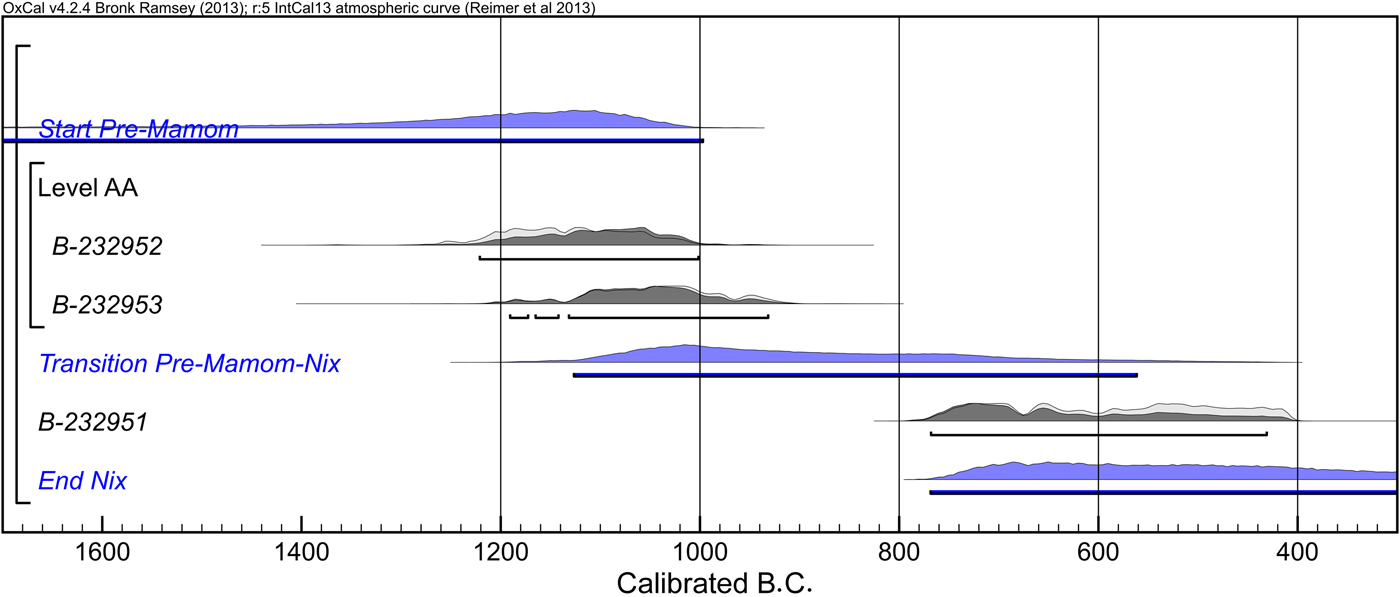
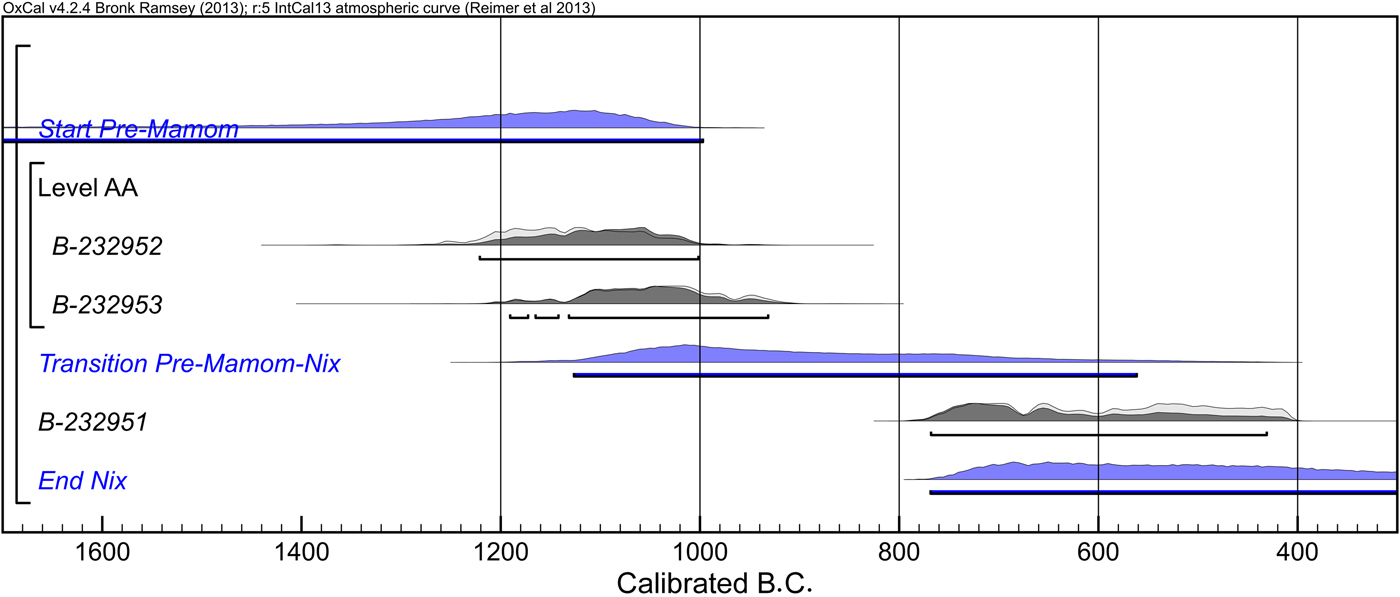
In the western part of the Peten Lake region, the excavation of Nixtun-Ch'ich’ by Prudence Rice (Reference Rice2009, Reference Rice2015) revealed related materials. The earliest level of this excavation (Level AA) contained 45 unslipped sherds, which Rice (P. Rice Reference Rice2009:406) describes as much cruder than other pre-Mamom pottery in the lowlands such as Cunil and Swasey. Two charcoal samples from this level provided radiocarbon measurements: 2930 ± 40 and 2870 ± 40, with the highest probability falling around 1100 to 1050 b.c. (Figure 9; Rice Reference Rice2009:408). These samples may possibly represent the earliest lowland Maya ceramics, dating slightly earlier than 1000 b.c. Nonetheless, this assemblage includes necked jars with outcurving rims, which tend to characterize Middle Preclassic ceramic complexes dating after 1000 b.c. in southern Mesoamerica. In addition, the following stratigraphic level, Platform ZZ1-sub-8, appears to date to pre-Mamom-Mamom transition (P. Rice Reference Rice2009:408; and my personal observation), which I would place around 700 b.c. It would be odd to have a temporal gap of more than 300 years between these stratigraphic levels. When we consider the possibility of old wood, it appears more likely that these ceramics date to the early Middle Preclassic between 1000–700 b.c. rather than to a pre-1000 b.c. period. For the ceramics of the pre-Mamom-Mamom transition period, Prudence Rice (Reference Rice2015) emphasizes dissimilarities to ceramics from the eastern part of the Peten Lake Region. The presence of cream/white slipped vessels in a significant number and of Tierra Mojada Resist suggests that the western region of the lake area had closer connection with the Pasión region than their eastern counterparts did.
Bayesian-modeled calibrated radiocarbon dates from Nixtun-Ch'ich’ (P. Rice Reference Rice2009).
It is necessary to comment on ceramics from Nakbe. The earliest ceramics, the Ox complex, at this northern Peten site are characterized by glossy/waxy slips and other characteristics of the Mamom ceramic sphere (Forsyth Reference Forsyth1993). Hansen (Reference Hansen and Powis2005) argues that the Early Ox phase dates to around 1000 b.c., based on a series of radiocarbon dates with six of them showing ranges around 1400–1000 b.c. The possible presence of Mamom-like ceramics at this early date has puzzled researchers (Clark et al. Reference Clark, Hansen, Pérez Suárez, Manzanilla and Luján2000:501). Since the stratigraphic contexts of the radiocarbon samples from Nakbe have not been reported, Bayesian statistics would not be of much help. According to Hansen (Reference Hansen and Powis2005:Figure 5.5), the Early Ox ceramics were found extremely sparsely. Hansen notes the presence of red-rimmed tecomates; similar neckless jars with a red band on the rim represent a long tradition in Mesoamerica dating back to the Early Preclassic period (Figure 10). Red-rimmed tecomates, however, are also present in the Real 3 complex (775–700 b.c.) at Ceibal, and they do not serve as a good temporal marker. Other characteristic vessels of the Early Ox phase that he shows include red-rimmed restricted vessels with fingernail-like impressions and black bowls/plates with double-line-break incisions/grooves. These are diagnostic modes of the Real 3 phase in the Ceibal sequence. Fingernail-like impressions are present during the Early Preclassic in central Chiapas and the Soconusco region, but the specific vessel forms and arrangements of impressions that Hansen illustrates and that I observed in his lab are nearly identical to those of Yalmanchac Impressed found at Ceibal and Caobal (see Munson and Pinzón G. Reference Munson and Pinzón2017:Figure 9), which are good temporal markers of the Real 3 (775–700 b.c.) and Escoba 1 (700–600 b.c.) phases. In addition, the published Early Ox figurines have the punched eyes characteristic of the Middle Preclassic (Hansen Reference Hansen and Powis2005:Figure 5.7). Although a more detailed evaluation of the Early Ox ceramics has to wait for their full publications, the currently available evidence strongly suggests that they date to 800–700 b.c. Forsyth (Don Forsyth, personal communication 2013), the ceramicist of the Mirador project, has also reached the same conclusion regarding the chronological placement of the Early Ox ceramics. The presence of maize pollens in lake cores dating before 1000 b.c. (Wahl et al. Reference Wahl, Byrne, Schreiner and Hansen2007, Reference Wahl, Byrne and Anderson2014, Reference Wahl, Hansen, Byrne, Anderson and Schreiner2016) suggests that the northern Peten was inhabited by Archaic populations before the adoption of ceramics. I suspect that the pre-1000 b.c. radiocarbon dates from Nakbe represent materials from preceramic occupations, as well as old wood.
Early Ox ceramics from Nakbe. Redrawn by Alfredo Román from Hansen Reference Hansen and Powis2005:Figure 5.5.

Hansen (Reference Hansen and Powis2005) dates the subsequent Middle Ox complex to 800–600 b.c. It is characterized by typical Mamom types with waxy slips, including Desvario Chamfered and Ajal Resist closely related to Tierra Mojada Resist of the Pasión region (Don Forsyth, personal communication 2013). At Ceibal, Tierra Mojada Resist starts in the Escoba-Mamom 1 phase (700–600 b.c.). This type is closely related to the Nicapa Orange Resist ware in central Chiapas, and resist decorations are far more common in the Pasión region than in the central and northern Peten. It is unlikely that a resist type appears at Nakbe earlier than at Ceibal. Moreover, chamfered plates are characteristic of the Escoba 1 phase at Ceibal although they are also present during the Real 3 phase. I suggest that the Middle Ox complex should be placed between 700–600 b.c., contemporaneous with the Escoba 1 phase.
Middle Usumacinta Region
Investigations at Tierra Blanca, Trinidad, Zapatillo, and other sites by Rands (Reference Rands, Rice and Sharer1987, Reference Hammond, Donaghey and Clarke2002; see also Englehardt Reference Englehardt2011) recovered a significant amount of Preclassic materials. Olmec-style figurines found at Tierra Blanca (Rands Reference Rands and Adams1977:Figures 7.1a–7.1b) indicate the presence of Early Preclassic occupation in this area with possible connections with the Gulf Coast Olmec, but the contents of related ceramic assemblages are not clear. The Chiuaan complex includes tecomates, incised vessels, and white-slipped bowls similar to Huetche White, some with exterior-thickened rims similar to Real ceramics. The importance of black slips and the presence of differentially fired white-rimmed black vessels indicate affinity with the southern Gulf Coast. The Chiuaan complex probably corresponds to the Real 1 and 2 phases (1000–775 b.c.). The following Xot complex includes matte red slips similar to Abelino Red of the Real complex. Although waxy slips are apparently absent, cloudy resist orange rounded bowls show similarities to Tierra Mojada Resist of the Escoba complex and the Nicapa Orange Resist of central Chiapas. The Xot complex may correspond to the Real 3 phase (775–700 b.c.) and the beginning of the Escoba 1 phase (700–600 b.c.). Alternatively, the Xot phase may correspond to the middle to late parts of the Escoba 1 phase when the residents of the Middle Usumacinta region might have begun to adopt some modes of Chiapas and the Maya lowlands and incorporated them with local types of slip. The Chacibcan complex is characterized by waxy slips typical of the Mamom sphere. In sum, the Middle Usumacinta region appears to have maintained affinity with both the Pasión region and the southern Gulf Coast during the early Middle Preclassic period, and was incorporated in the lowland Maya ceramic sphere during the late Middle Preclassic.
Northern Maya Lowlands
A re-evaluation of ceramics excavated at Komchen and new finds from Kiuic have led Andrews et al. (Reference Andrews, Bey and Gunn2008, Reference Andrews, Bey, Gunn, Kathryn Brown and Bey2017) to re-define the Ek complex, which is characterized by postslip incisions common in pre-Mamom ceramics. Ek ceramics were found in construction fills of substantial platforms at Komchen, and related materials have been identified at Kiuic and other sites. After examining early ceramics from Cuello, Cahal Pech, Tikal, and Ceibal, Andrews et al. (Reference Andrews, Bey, Gunn, Kathryn Brown and Bey2017) have concluded that the closest similarities are found with the Real 2 ceramics. Ceballos Gallareta and Robles Castellanos (Reference Ceballos Gallareta and Robles Castellanos2012), however, argue that the Ek types belong to the Mamom-corresponding Early Nabanche complex and date the beginning of the Early Nabanche phase to 1000 b.c., citing the comparable date for the Early Ox complex of Nakbe. As noted above, this chronology for Nakbe is unlikely. In addition, a small number of pre-800 b.c. radiocarbon dates from the northern lowlands that Ceballos and Robles cite have wide ranges of uncertainty, and their reliability is questionable.
During my initial observation of Ek ceramics, I received an impression that they are close to Real 3-phase materials at Ceibal because (1) their slips are relatively glossy and (2) there appear to be no other materials in the Komchen sequence corresponding to Real 3 ceramics of Ceibal. After examining the extensive Komchen collection at the INAH ceramoteca in Mérida, however, I am more inclined to agree with Andrews and Bey in that they are contemporaneous with the Real 2 phase or even with the Real 1 phase. I now agree with Andrews and Bey that the common use of postslip incisions on Ek vessels potentially aligns them with Real 1 or 2 ceramics (1000–775 b.c.) and contemporaneous complexes, such as Cunil and Eb. The relatively glossy appearance of Ek ceramics may be due to their preservation conditions. Ek ceramics are fairly well fired, which, along with the drier condition of Yucatan, probably contributed to their better preservation. Some of the slipped Real 1 and 2 ceramics also show glossy or lustrous appearance immediately after they are unearthed, but they quickly turn dull as they dry. In other words, many of the Ek and Real 1–2 slipped ceramics (and possibly other related ceramics from the southern Maya lowlands) originally had comparable glossy surfaces, but archaeological samples of Real materials show dull or matte appearance because of poor firing and poor preservation. Eroded Ek ceramics appear similar to Real 1–2 materials.
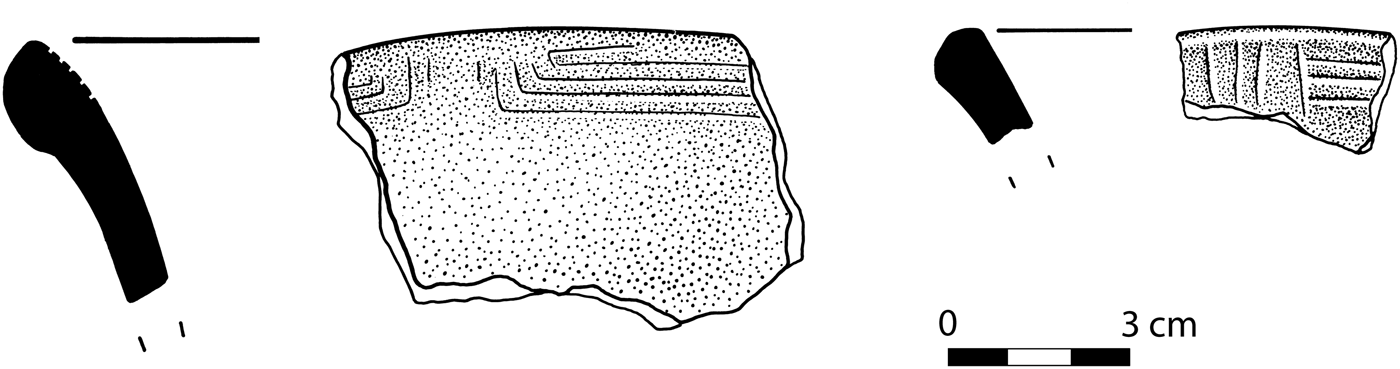
In addition, the Komchen collection includes ceramics possibly corresponding to Real 3 materials, and there might have been a continuous ceramic tradition in northwestern Yucatan, spanning from Real 1/2 to Escoba-Mamom-corresponding periods. Specifically, black-slipped ceramics with rectilinear line breaks at Komchen may be contemporaneous with the Real 3 phase (775–700 b.c.). The Komchen collection contains a fair number of plates/dishes with three or more circumferential postslip or preslip incisions abutting five or so vertical incisions on the interiors of outflared everted or direct rims. They seem to appear almost exclusively on black dishes/plates or black dishes/plates with a red band on the rim. At Ceibal, similar rectilinear line breaks made of postslip incisions are found in small numbers on direct rim interiors of red and white dishes/plates during the Real 1 and 2 phases (Figure 11). During the Real 3 phase they are replaced by preslip incision double line breaks on the interiors of outflared everted rims or horizontally everted rims typically of white/cream plates with a red band on the rim or of black plates. These combinations of incised motifs, colors, and vessel shapes continue into the Escoba 1 phase. It is unlikely that these line break motifs at Komchen date to the Real 1 or 2 corresponding period because these vessels have glossy/waxy slips nearly identical to Early Nabanche ceramics. Their color schemes and vessel shapes more closely correlate with those of the Real 3 (775–700 b.c.) and Escoba 1 (700–600 b.c.) phases. The use of both postslip and preslip incisions for line break motifs on Komchen black ceramics suggest that at least some of them date to the Real 3-corresponding period.
Line break motifs on Real 1-2 phase ceramics from Ceibal. Drawing by Alfredo Román.

Early Middle Preclassic Chronology of the Maya Lowlands
The foregoing review indicates that there is no unequivocal evidence for ceramic use and fully sedentary settlements in the Maya lowlands during the Early Preclassic period or prior to 1000 b.c. The Middle Usumacinta region, with a probable Early Preclassic occupation, was more closely related to the southern Gulf Coast in those early days. The absence of clear evidence does not necessarily deny the presence of earlier settlements, and I am open to the possibility that the materials from the lower levels of Cahal Pech and other sites will prove to be earlier than 1000 b.c. Still, we need to recognize potential pitfalls in the study of the earliest settlements. Whereas radiocarbon dates from later occupations can be checked against those from earlier levels for the identification of old wood and other problematic dates and for a higher precision, such independent tests are not available for dates from the earliest settlements in a region. Thus, we need to examine these dates rigorously and conservatively by obtaining a sufficient number of radiocarbon measurements and by scrutinizing dated materials, contexts, and associations to eliminate various factors that may cause older dates, including old wood, re-deposited materials, freshwater and marine reservoir effects, contamination, and unreliable measurements. If there was preceramic occupation at a site, which may be the case at Cahal Pech and Nakbe, separating dates associated with ceramics and those originating from earlier occupation would be particularly challenging. As a general rule, if a set of radiocarbon dates from a given context exhibits inconsistent dates, we should choose the younger dates as valid ones rather than the older ones, which may have resulted from old wood or re-deposited materials.
The currently available evidence suggests to me the roughly contemporaneous appearance of the first ceramics and subsequent ceramic changes across the Maya lowlands. The early ceramics, including Real, Early Eb, Ah Pam, Swasey, and Cunil, emerged in a relatively short time span around 1000 b.c., although Ek may have started slightly later. We should remember that, despite this simultaneity across the Maya lowlands, there may have been varying processes of transition to sedentism and ceramic use within each region; there appear to have existed groups who resisted the adoption of the new ways of life and maintained mobile life ways in various areas for a few centuries (Inomata et al. Reference Inomata, MacLellan, Triadan, Munson, Burham, Aoyama, Nasu, Pinzon and Yonenobu2015a, Reference Inomata, MacLellan and Burham2015b). The ceramics from various parts of the Maya lowlands exhibit certain variations among them, but there are also substantial commonalities shared among them. In this regard, my earlier evaluation based largely on published information (Houston and Inomata Reference Houston and Inomata2009:69) may have over-emphasized differences among those complexes. After examining various ceramic collections from the Maya lowlands and the surrounding regions, I agree with Cheetham and Clark (Cheetham Reference Cheetham and Powis2005; Clark and Cheetham Reference Clark, Cheetham and Parkinson2002) that the early Middle Preclassic ceramics from various parts of the Maya lowlands shared more similarities among them than with those from the southern Gulf Coast, central Chiapas, the Guatemalan highlands, and Honduras, although lowland Maya ceramics of Real 1 and 2-corresponding period (ca. 1000–800 b.c.) exhibited more heterogeneity than those from subsequent periods.
When we compare the ratio of white/cream-slipped vessels to other colors (see Cheetham Reference Cheetham and Powis2005:Table 3.2), the substantially higher ratio in the Pasión region gives an impression that this western area was distinct from other parts of the Maya lowlands and had closer affinity with central Chiapas. Although some connections between the Pasión region and Chiapas are undeniable, unslipped or self-slipped Calam Buff found in central Peten and in the Belize River valley, as well as Bil White and Cocoyol Cream, probably represent a concept similar to Huetche White from Ceibal. When we consider this similarity, the differences between these regions may be considerably smaller than the frequencies of slip colors imply. At the same time, I maintain my earlier view that Cheetham (Reference Cheetham and Powis2005:31) over-emphasized the importance of the horizontally everted rim as a defining attribute of the lowland Maya ceramics. This specific form is confined largely to the Belize River valley and central-eastern Peten, and it is rare or absent in other parts of the Maya lowlands. Important characteristics of the pre-Mamom ceramic sphere include the presence of necked jars along with tecomates, relatively simple forms of bowls and plates for serving vessels, dull or matte slips with a general preference for red colors, and the prevalence of postslip incisions over preslip ones. More regionalized traits include the common use of exterior-thickened rims for bowls in the Pasión region and central Peten (also possibly in the Middle Usumacinta region), horizontally everted rims in the Belize River valley and central-eastern Peten, and pattern burnishing in northern Belize and Yucatan. The frequencies of specific postslip incision motifs vary from one region to another, which largely reflects different cultural preferences among various regions rather than temporal differences.
The transition to the Real 3 and the Early Jenney Creek complexes happened fairly simultaneously around 800 b.c., and I suspect comparable changes also occurred in central Peten and Yucatan about the same time. These changes represent a move toward more homogenous ceramics across the Maya lowlands with the increasing use of glossier slips, the stronger emphasis on red slips in the regions where white slips were popular, the replacement of postslip incisions with preslip grooves, and the more common use of shallow plates and composite silhouette shapes. This period also witnessed an increase in certain types of decoration, including fingernail-like impressions, filleting, double line break and related motifs, chamfering, and the more common use of bichromes, although the distribution of specific kinds of decoration varied. In this general trend, the Belize River valley exhibited a somewhat unique trajectory with the predominance of Mars Orange ware. During this period the mobile populations of the Maya lowlands increasingly adopted the fully sedentary way of life as indicated by the emergence of new sites, including Altar de Sacrificios, Nakbe, and K'axob. This trend led to the development of more homogeneous Mamom ceramics across the Maya lowlands around 700 b.c., although we should note that the determination of its precise date is difficult because of the flattening of the radiocarbon calibration curve. The transition to Mamom ceramics was gradual which caused some inconsistency in ceramic periodization and the use of terminology among researchers, reflected in the different beginning dates for various Mamom-corresponding phases in Figure 1. In other words, I suspect that the inconsistency in the beginning dates of Mamom-corresponding phases is due largely to the different ways researchers classified ceramics. The pace of transition was probably fairly consistent across the Maya lowlands.
SOCIAL CHANGE DURING THE EARLY MIDDLE PRECLASSIC PERIOD
Beginning of Agrarian Settlements
The problem of ceramic chronology in the Maya lowlands is tied to the larger issue of social change in Mesoamerica. The question of whether the first ceramics appeared nearly simultaneously around 1000 b.c. across the Maya lowlands or whether they emerged gradually at varying rates in different regions has important implications in this regard. 1000 b.c. appears to mark a critical point of transformation in Mesoamerican history. Various scholars argued that for much of the Early Preclassic period Mesoamerican groups relied on diverse food resources and, as maize productivity increased, maize became a major staple at the beginning of the Middle Preclassic around 1000 b.c. (Arnold Reference Arnold, Clark and Pye2000; Blake Reference Blake, Staller, Tykot and Benz2006; Rosenswig Reference Rosenswig2006).
Although there is a growing consensus on this point, a remaining question is whether the adoption of maize as a dominant staple happened gradually during the Early Preclassic or whether there was a drastic change at the beginning the Middle Preclassic around 1000 b.c. The analysis of human bones from the Chiapas-Guatemalan Coast appears to support the latter hypothesis. Throughout the Early Preclassic period ϭ13C values of bones (which largely reflect the proportion that maize occupied in diet) remained relatively stable between −22 and −18‰, but they jumped to −13 to −10‰ during the Middle Preclassic (Blake et al. Reference Blake, Clark, Voorhies, Love and Chisholm1992; Chisholm and Blake Reference Chisholm, Blake, Staller, Tykot and Benz2006). The data on grinding stones are consonant with this result; the overall quantity of grinding stones or those specialized in maize grinding increased substantially from the Early Preclassic to Middle Preclassic (Arnold Reference Arnold2009; Rosenswig Reference Rosenswig2006, Reference Rosenswig2012). In the Tehuacan valley, the frequency of maize remains increased significantly around 1000 b.c. (Mangelsdorf Reference Mangelsdorf1974). These data led Clark et al. (Reference Clark, Pye, Gosser, Lowe and Pye2007) to suggest that maize did not become a major staple until it crossed a productivity threshold at the Early to Middle Preclassic transition around 1000 b.c. Such subsistence change would have had major social impacts. Taube (Reference Taube1996, Reference Taube, Clark and Pye2000) notes that it was during the Middle Preclassic period that iconography representing maize symbolism developed, and Rosenswig (Reference Rosenswig2012) argues that the beginning of the Middle Preclassic witnessed significant political centralization in the Soconusco region. Settlement data from the Gulf Coast, however, may point to a more gradual process. Various survey projects in the region have consistently shown that, though concentrated in floodplains during the early part of the Early Preclassic, occupation gradually shifted to upland areas during the latter part of the Early Preclassic and the Middle Preclassic (Borstein Reference Borstein2001; Kruger Reference Kruger1996; Symonds Reference Symonds, Clark and Pye2000). This shift in settlement to uplands most likely correlates with a change from a subsistence system based largely on riverine resources to one relying more heavily on agriculture, particularly maize cultivation (Arnold Reference Arnold2009; Borstein Reference Borstein2001:184). If so, the use of maize may have intensified gradually during the Early Preclassic period.
Although we need more data for a better understanding of these processes, the Maya lowlands may represent environmental conditions in which the threshold effect of maize productivity on social processes is particularly likely. In contrast to the Gulf Coast and the Pacific Coast, where riverine, estuarine, and coastal resources are abundant, the karst topography of the Maya lowlands is limited in natural food resources. Until maize crossed a productivity threshold, the Maya lowlands may not have been an adequate area to support a population larger than small mobile groups. Cutting hard tropical trees with stone axes requires substantial work (Carneiro Reference Carneiro1979; Denevan Reference Denevan1992). Unless productive maize provided adequate returns for such labor, forest dwellers probably did not have much incentive to cut substantial areas of forest although this does not preclude practices of small-scale horticulture as indicated by lake-core data. Various scholars have speculated that an increase in maize productivity was a critical factor for the emergence of fully sedentary settlements in the Maya lowlands (Houston and Inomata Reference Houston and Inomata2009:74; Puleston and Puleston Reference Puleston and Puleston1971; Ringle Reference Ringle1985:183–188). Although hard evidence for this argument is scarce, the analysis of Bladen-phase skeletons from Cuello shows a range of ϭ13C between −13.6 and −11.2‰, which is comparable to those from the contemporaneous Soconusco region (Tykot et al. Reference Tykot, van der Merwe, Hammond and Orna1996; Van Der Merwe et al. Reference Van Der Merwe, Tykot, Hammond, Oakberg, Ambrose and Katzenberg2000). The chronological reconstruction presented here, suggesting the general contemporaneity in the emergence of sedentary settlements with ceramics across the Maya lowlands, accords with the hypothesis that this social transformation occurred as maize crossed a productivity threshold around 1000 b.c. If pre-1000 b.c. settlements with ceramics are proven to exist, it would make the effect of maize productivity on social change somewhat more gradual than I currently suspect. Still, such settlements, if they existed, must have been extremely sparse, and they may not substantially change my interpretation.
I should add that this was not necessarily an environmentally deterministic process. Higher-productivity maize possibly made the formation of sedentary communities a viable option, and some groups indeed took this trajectory. There appear to have been other groups, however, who chose to keep the traditional mobile way of life after 1000 b.c. (Inomata et al. Reference Inomata, MacLellan, Triadan, Munson, Burham, Aoyama, Nasu, Pinzon and Yonenobu2015a, Reference Inomata, MacLellan and Burham2015b). Cultural and political negotiations among diverse groups and individuals did play an important role in this process.
Development of Monumental Architecture and Communal Ceremonial Complexes
The chronologies presented here and in a previous publication (Inomata et al. Reference Inomata, Triadan, Aoyama, Castillo and Yonenobu2013:Supplementary Information) provide a basis from which to examine the emergence of standardized spatial plans and pyramidal architecture. Dating to around 950 b.c., Structures Ajaw and Xa'an at Ceibal are the earliest known civic buildings in the Maya lowlands and the earliest known E-Group assemblage in Mesoamerica to date. Platform Sulul, measuring 1.5 m in height around 950 b.c. and 1.9 to 2.5 meters in height and more than 34 meters in width by 850 b.c., was substantially larger than any known contemporaneous buildings in the Maya lowlands. During the Real 2 period (850–775 b.c.) the Ceibal residents built a pyramid, Structure B'ehom, possibly reaching a height of 3 to 5 meters, and a monumental platform, Ch'och’, measuring 3.5 to 6 meters in height. Platform Ch'och’ appears to have supported multiple rectangular buildings. During this period, excavations at most other lowlands Maya sites have uncovered only humble residential structures supported by low platforms. For example, at Cuello the earliest constructions around 1000–900 b.c. consisted of postholes in the old land surface and soon the inhabitants built 0.2 to 0.5 meters high circular or apsidal platforms that probably supported residential structures (Hammond Reference Hammond1991; Hammond and Gerhardt Reference Hammond and Cartwright Gerhardt1990). It was not until the Lopez-Mamom phase at Cuello that rectangular platforms measuring nearly one meter in height were constructed. The sequence at Blackman Eddy also shows a transition from ground-level postholes to low circular or apsidal platforms less than 0.5 meters high (Garber et al. Reference Garber, Kathryn Brown, Awe, Hartman and Garber2004a, Reference Garber, Kathryn Brown, David Driver, Glassman, Hartman, Kent Reilly, Sullivan and Garber2004b). At Cahal Pech, Structure B-4/10-sub, dating to the late Cunil phase, was a rectangular or square platform measuring 0.6 to 1.0 meters in height, which the excavators interpret to be the most elaborate residential structure during this phase (Healy and Awe Reference Healy and Awe1995; Healy et al. Reference Healy, Cheetham, Powis, Awe and Garber2004b). In the central Peten, researchers have found no building remains dating to the Early Eb phase at Tikal. In the Peten Lake region, Don Rice (Reference Rice1976:Figure 6) reports a 0.5 m tall probable platform dating to the Early Ah Pam phase. At Nakbe, structures of the Early Ox phase, which I would date to 800–700 b.c., consist of postholes on the natural ground surface (Hansen Reference Hansen and Powis2005:62). During the Middle Ox phase (700–600 b.c.), low platforms with retaining walls with two to three courses of stones were built (Hansen Reference Hansen and Houston1998:Figure 57). In other words, substantial structures were probably not built at Nakbe before 600 b.c.
The only exception outside of Ceibal may be Komchen. There a large platform, Structure 24G1 measuring 1.2 to 1.4 meters in height, and Structure 23F1 reaching a height of 0.6 m were constructed during the Ek phase (Andrews et al. Reference Andrews, Bey and Gunn2008). If the evaluation of related ceramics by Andrews, Bey, and myself are correct, these substantial constructions possibly date to 1000–800 b.c. These buildings may have continued to grow during the Real 3-corresponding period. Komchen suffered substantial modern destruction, and it is not clear whether its early buildings had an E-Group arrangement.
Civic buildings and E-Group assemblages that have been found at other lowland sites so far date to the Real 3-corresponding period (800–700 b.c.) or later, although the Belizean site of Actuncan may have had an E-Group assemblage contemporaneous with the earliest E Group at of Ceibal (LeCount and Mixter Reference LeCount and Mixter2016). During the Real 3 phase at Ceibal, the pyramidal structure B'ehom was renovated to Structure A-20 Sub 6, and another monumental platform, K'at, supporting multiple rectangular structures was constructed. At Blackman Eddy, excavators uncovered rectangular platforms 0.25 to 0.5 meters high dating to the Early Jenney Creek phase. In the transition from the Early to Late Jenney Creek phases, this building was covered by what appears to be the first civic structure, B1–5th, which measured 1.5 m in height (Garber et al. Reference Garber, Kathryn Brown, David Driver, Glassman, Hartman, Kent Reilly, Sullivan and Garber2004b). At Cahal Pech, excavators interpret Structure B-4/9-sub dating to the Early Kanluk phase to be the first temple building. Before the end of the Early Kanluk phase, this building received a renovation and the resulting Structure B-4/8-sub reached a height of 2.0 to 2.5 meters (Healy and Awe Reference Healy and Awe1995; Healy et al. Reference Healy, Cheetham, Powis, Awe and Garber2004b). In the Lake Yaxha-Sacnab region, a platform from the previous phase grew to 1.3 m in height during the Late Ah Pam phase, possibly corresponding to the Escoba-1 phase (D. Rice Reference Rice1976). At Nixtun-Ch'ich’, the earliest building, Platform ZZ1-sub-8, measuring 0.9 to 1.8 meters in height, appears to date to the Escoba 1-corresponding phase (P. Rice Reference Rice2009).
The oldest known E-Group assemblage in the Maya lowlands after that of Ceibal was found at Cival. Again, Actuncan may represent an earlier example (LeCount and Mixter Reference LeCount and Mixter2016), but its full confirmation will depend on future investigations. The first version of the western building of the Cival E-Group assemblage measured one to two meters in height, and its eastern counterpart was carved out of soft limestone bedrock in a manner comparable to Structures Ajaw and Xa'an (Estrada-Belli Reference Estrada Belli, Burger and Rosenswig2012). Deposited in front of this building was a cruciform cache (Cache 4) containing greenstone axes, greenstone pebbles, and ceramic jars (Estrada Belli Reference Estrada Belli2006). Although these ceremonial buildings are unimpressive, we should note that the largest construction effort at Cival was the leveling of the area with fills reaching up to eight meters in thickness carried out at the same time as the construction of the E Group. Estrada-Belli (Reference Estrada Belli, Burger and Rosenswig2012:222) reports two radiocarbon dates associated with this construction. A date of 2670 ± 40 was obtained from human bone from a burial covered by the leveling fill (Burial 33), and a date of 2520 ± 40 was derived from charcoal taken from the stucco floor sealing Cache 4 (Figure 12). With only two dates, it is difficult to evaluate effects of freshwater reservoir and old wood, and these measurements leave a wide range of possible dates from 800–400 b.c.
Calibrated radiocarbon dates for cruciform caches. Cival Cache 4 dates from Estrada-Belli Reference Estrada Belli2011; Ceibal Cache 7 dates from Berger et al. Reference Berger, De Atley, Protsch and Willey1974. The rectangle indicates the possible date range for Cival Cache 4 and Ceibal Caches 7 and 160 based on radiocarbon dates and ceramic cross-dating.

Comparison with the cruciform caches from Ceibal (Caches 7, 132, 160, 171, and 183) is suggestive in this regard. All but one (Cache 183) of those cruciform caches at Ceibal date to the Real 3 or Escoba 1 phase dating to 775–600 b.c. Although Cache 183, dating to the Real 1 phase, had a cruciform pit, its arrangement of offerings, with a preform for a spoon-shaped pectoral and an axe placed in the central depression, is different from those of the other caches with greenstone axes in each arm of the cruciform arrangement. Cache 183 may represent a precursor of better-established cruciform caches. The Harvard project obtained a radiocarbon date of 2610 ± 75 for Cache (Berger et al. Reference Berger, De Atley, Protsch and Willey1974:472). Based on this measurement, Harvard researchers chose 900 b.c. as the beginning date for the Real phase, which turned out to be a fairly good estimate. We should note, however, that this radiocarbon measurement shows a wide range of possible dates comparable to those from Cival. A charcoal piece found in Cache 160 gave a radiocarbon date of 2475 ± 20 uncal bp (PLD-22110, 763–421 cal b.c.). Given these wide date ranges, we need to rely largely on the ceramic chronology to date the Cival E-Group and the related cruciform caches.
The ceramics contained in the massive leveling fill covering Cival Burial 33 appear to correspond to Real 3 or Escoba 1 materials (personal observation). Both Cache 4 of Cival and Cache 7 of Ceibal contained five water jars in addition to greenstone axes: four black-slipped and one red-slipped at Cival and all black-slipped at Ceibal (Sabloff Reference Sabloff and Willey1975:Figure 64; Smith Reference Smith and Willey1982:243). Ceibal Cache 171 contained three water jars: one red and two black. During the Real 1 and 2 phases at Ceibal, slipped jars were not common, and black-slipped ones in particular were rare. They became significantly more common during the Real 3 phases. In addition, the fill of Cache 171 contained Tierra Mojada sherds, characteristic of the Escoba phase. These observations suggest that those cruciform caches were placed in the Real 3- and Escoba 1-corresponding phases, and the Cival E Group was built sometime between 800 and 700 b.c.
The next oldest known E-Group assemblage in the Maya lowlands is probably the Mundo Perdido complex at Tikal. The first version of this E-Group assemblage represents the earliest architectural remains uncovered so far at Tikal (Laporte and Valdés Reference Laporte and Antonio Valdés1993; Laporte and Fialko Reference Laporte and Fialko1995). The western structure measured 3 m in height and 23 m in width. This complex dates to the Late Eb phase, which, as discussed above, appears to correspond to the Escoba 1 phase (700–600 b.c.). No greenstone axe caches were found in this complex despite extensive excavations, which may also imply a somewhat later date than that of the Cival E-Group assemblage. The E-Group complex at the nearby site of El Palmar may have been construction about the same time (Doyle Reference Doyle2012, Reference Doyle2013:144). The E-Group assemblages at Nakbe are unlikely to be earlier. During the Middle Ox phase, which I would place between 700–600 b.c., settlements at this site expanded and platforms up to two meters high were built. It was during the following Late Ox phase that major constructions, including an 18 m high pyramid, took place (Hansen Reference Hansen and Houston1998, Reference Hansen and Powis2005). This phase should be placed in the common time span of Mamom ceramics, 600–400 b.c. Although more specific evaluations of the Nakbe sequence have to wait for the full publication of excavation results, it is unlikely that E-Group assemblages at this site date prior to 700 b.c.
Recent excavations have shown that the magnitude of Middle Preclassic settlements and constructions in the northern lowlands has been grossly underestimated. Excavations at Ek Balam, Yaxuna, Xocnaceh, Poxila, Xtobo, Kiuic, and other sites have revealed substantial constructions dating to the late Middle Preclassic (700–350 b.c.) (Anderson Reference Anderson2011; Andrews et al. Reference Andrews, Bey and Gunn2008; Bey et al. Reference Bey, Bond, Ringle, Hanson, Houck and Pereza Lope1998; Stanton and Ardren Reference Stanton and Ardren2005; Suhler et al. Reference Suhler, Ardren and Johnstone1998). The early structures at Komchen represent precursors to these impressive developments in the northern lowlands. Ek-related ceramics at most of these sites, however, are rare or absent, and substantial constructions prior to 700/600 b.c. were probably limited in this area (see Ceballos Gallareta and Robles Castellanos Reference Ceballos Gallareta and Robles Castellanos2012). Architectural developments at many other sites in the Maya lowlands were probably even later. At Uaxactun, for example, the first version of its E Group, E-VII-Sub-1, is dated to the early Chicanel period (Laporte and Valdés Reference Laporte and Antonio Valdés1993).
In sum, Structures Ajaw and Xa'an, dating to 950 b.c., represent the earliest documented E-Group assemblage in Mesoamerica while the potentially contemporaneous E-Group at Actuncan awaits further confirmation. The construction sequence at Ceibal appears to represent the developmental history of the MFC pattern, starting from the central element of an E-Group assemblage and one extensive platform around 950 b.c. and taking more developed forms of the MFC pattern with the addition of the northeastern platform around 800 b.c. and of more platforms around 700 b.c. This process indicates that Ceibal was not a passive recipient of a spatial plan and ritual practice developed elsewhere. Early Ceibaleños actively contributed to this process. In most other parts of the Maya lowlands, E-Group assemblages and other types of civic complexes probably did not emerge until 800 b.c. or later. When the residents of Ceibal began to develop a first pyramid and monumental architecture around 850–800 b.c., most communities in the rest of the lowlands appear to have had only humble buildings. When those in other parts of the lowlands began to build E-Group assemblages and other civic complexes, they did not adopt the other elements of the MFC pattern, that is, large platforms, nor greenstone axe caches with the exception of Cival. Our understanding of this period is fragmentary, and future investigations may certainly unearth more early civic buildings at other lowland Maya sites. The apparent absence of the MFC patterns at most Maya sites, however, possibly implies that the residents of most parts of the Maya lowlands did not participate in the architectural development leading to this site plan during 1000 to 800 b.c.
Ceibal and Interregional Interactions
Ceibal was probably not the sole origin of the E-Group assemblage and the MFC pattern. After all, the area around Ceibal did not even have fully sedentary settlements before this period. Interactions with and inspirations from other groups must have been critical. I have argued elsewhere that Ceibal was part of a network of interregional interaction, including the southern Gulf Coast, central Chiapas, and the Chiapas-Guatemalan coast, which may be called the Isthmian Interaction Sphere (Inomata et al. Reference Inomata, Triadan, Aoyama, Castillo and Yonenobu2013). In addition to the shared plan of the MFC pattern, the close connection of Ceibal with these western regions can be seen in construction techniques. The use of earth and clay in construction fills seen at Ceibal had a long tradition in the southern Gulf Coast, central Chiapas, and the Soconusco region, and the technique was also adopted in the Guatemalan highlands and Honduras. At Ceibal during the early Middle Preclassic period, the use of stone in fills was limited although stone retaining walls were present during the Real phase. Floors typically consisted of densely packed limestone gravel mixed with earth (Triadan et al. Reference Triadan, Castillo, Inomata, Manuel Palomo, Belén Méndez, Cortave, MacLellan, Burham and Ponciano2017). This technique of floor construction closely resembles earlier constructions seen at San Lorenzo (Cyphers Reference Cyphers and Cyphers1997a:Figure 4.2). Some of the earthen floors at Ceibal were burned for hardness, and similar techniques are reported from Chiapas (Agrinier Reference Agrinier2000; Littmann Reference Littmann1967). These building techniques contrast with those of the rest of the Maya lowlands, which emphasized masonry constructions and the use of stucco. This lowland Maya tradition was not obvious when permanent buildings emerged around 1000 b.c., but it quickly crystallized within a few centuries. The excavators of Cahal Pech report that Structure B-4/10-sub dating to the late Cunil phase already had a plastered floor using burned lime (Awe Reference Awe1992; Healy et al. Reference Healy, Cheetham, Powis, Awe and Garber2004b). At Cuello and Blackman Eddy, platform constructions involved the use of masonry retaining walls and lime plaster at least by the beginning of the Bladen and Early Jenney Creek phases (Garber et al. Reference Garber, Kathryn Brown, Awe, Hartman and Garber2004a; Hammond Reference Hammond1991). At Ceibal and the nearby sites, it was not until the Escoba phase that the more extensive use of masonry construction and of stucco floors gradually became common (Bachand Reference Bachand2006:518–534; Munson Reference Munson2012:252, 302; Inomata et al. Reference Inomata, Pinzón, Manuel Palomo, Sharpe, Ortíz, Belén Méndez and Román2017b).
Currently available evidence suggests that the Olmec center of San Lorenzo did not have pyramids or ceremonial complexes similar to the MFC pattern (Coe and Diehl Reference Coe and Diehl1980; Cyphers Reference Cyphers, Stark and Arnold1997b; Cyphers and Di Castro Reference Cyphers, Di Castro, Fash and Luján2009). New concepts of architecture began to emerge after the retreat of San Lorenzo's influence from central Chiapas and Soconusco around 1200 b.c. The Soconusco region may have been important for the initial development of the later standardized site plan (see Bachand and Lowe Reference Bachand, Lowe, Lowe and Pye2012; Inomata Reference Inomata, Freidel, Chase, Dowd and Murdock2016). There during the Jocotal period (1200–1000 b.c.) substantial mounds were built at sites along estuaries (Lesure Reference Lesure2009; Pye et al. Reference Pye, Demarest, Arroyo and Blake1999), and the earliest pyramids known in Mesoamerica were erected at Ojo de Agua where the building arrangement exhibits a vague resemblance to the MFC pattern (Hodgson et al. Reference Hodgson, Clark and Gallaga Murrieta2010). After the abandonment of Ojo de Agua, the new center of La Blanca developed across the Guatemalan border, and the first version of its large pyramid, Mound 1, may be roughly contemporaneous with Structures Ajaw or B'ehom (Love Reference Love2002). As this site suffered serious modern destruction, it is not clear whether it had an E-Group assemblage or other elements of the MFC pattern (Love Reference Love2013). Although no MFC patterns have been identified on the Guatemalan Pacific Coast, the map of the Middle Preclassic site of Vista Hermosa shows a MFC-like arrangement (Bove Reference Bove and Powis2005:Figure 8.4), and the involvement of this area in the development of standardized spatial plans needs to be further investigated.
An important area for the development of the MFC pattern was central Chiapas along the Grijalva River (Clark and Hansen Reference Clark, Hansen, Inomata and Houston2001; Inomata Reference Inomata, Freidel, Chase, Dowd and Murdock2016; Lowe Reference Lowe and Adams1977). The earliest known pyramid forming an E-Group assemblage in this area was found at Chiapa de Corzo. Bachand and Lowe (Reference Bachand, Lowe, Lowe and Pye2012) date this construction to the Dzemba phase, which appears to be roughly contemporaneous with the Real 3 phase. Some buildings at Tzutzuculi on the Pacific Coast and San Isidro may have been built about the same time (Lowe Reference Lowe, Coe and Grove1981; McDonald Reference McDonald1983). At Chiapa de Corzo and San Isidro, greenstone axe caches similar to those from Ceibal and La Venta have been found. An even earlier E-Group assemblage may have existed at Finca Acapulco, where larger Early Preclassic settlements have been identified (Lowe Reference Lowe, Lowe and Pye2007). Other sites in central Chiapas, including Mirador and La Libertad, adopted well developed versions of the MFC pattern with multiple platforms after 700 b.c. (Agrinier Reference Agrinier2000; Bryant et al. Reference Bryant, Clark and Cheetham2005). It is interesting to note that at the beginning of the Middle Preclassic occupation at Chiapa de Corzo its central part was leveled off, and scraped surface soils along with remains of the Early Preclassic occupation were dumped to the slope near the ceremonial core (Lowe and Agrinier Reference Lowe and Agrinier1960). This way of preparing a ceremonial area is similar to the pattern found at Ceibal, and in both cases the Middle Preclassic inhabitants appear to have emphasized a break from the previous era.
The involvement of the southern Gulf Coast in the initial development of the MFC pattern is not clear. La Venta does not appear to have become a major center until 800 b.c. (Inomata et al. Reference Inomata, Triadan, Aoyama, Castillo and Yonenobu2013; Rust Reference Rust2008). It is still possible that La Venta as a small, not so influential center, as well as other settlements of the region, participated in this architectural development between 1000 and 800 b.c. Bachand and Lowe (Reference Bachand, Lowe, Lowe and Pye2012:66) point out the possible existence of E-Group assemblages and MFC patterns at Laguna de los Cerros (Bove Reference Bove1978) and in the Chimalapa region of northeastern Oaxaca. The southern Gulf Coast was probably not the dominant source of one-directional influence prior to 800 b.c., however. La Venta exhibits the most elaborate and largest version of the MFC pattern (Clark and Hansen Reference Clark, Hansen, Inomata and Houston2001), and numerous greenstone axe caches and other ritual deposits were placed there (Drucker Reference Drucker1952; Drucker et al. Reference Drucker, Heizer and Squier1959). When La Venta became a major center around 800 b.c., it appears to have re-incorporated the architectural and ritual innovations made through interregional interactions and then became an important point of cultural production between 800 and 400 b.c.
This chronological reconstruction indicates that significant innovations in architecture, and probably associated social practices, took place during the gap between the heydays of San Lorenzo and La Venta. This potential gap between those Gulf Coast centers has been suggested by Clark and elaborated by others (Cheetham Reference Cheetham2010; Clark and Pye Reference Clark, Pye, Clark and Pye2000; Rosenswig Reference Rosenswig2010). In earlier views of the Preclassic chronology, researchers saw two horizons associated with San Lorenzo and La Venta (Lowe Reference Lowe, Sharer and Grove1989; Tolstoy Reference Tolstoy, Share and Grove1989). In their chronological revisions, Clark and others insert an additional period between them. Clark and Pye (Reference Clark, Pye, Clark and Pye2000:241) argue that the Jocotal phase on the Pacific Coast, possibly around 1200 b.c., marks the beginning of this new period. They suggest that central Mexico became an important source of inspiration and suggest the name of the Manantial horizon. Rosenswig (Reference Rosenswig2010), however, emphasizes changes around 1000 b.c. and calls the period between 1000 and 800 b.c. Horizon II. My view overlaps with these two proposals. I estimate that the retreat of San Lorenzo influence began around 1200 b.c. and that the absence of a dominant power on the Gulf Coast continued until 800 b.c. I simply call this span the transitional period as I am not convinced of the appropriateness of the term horizon for this era (Inomata et al. Reference Inomata, Triadan, Aoyama, Castillo and Yonenobu2013). I agree with Clark and Pye (Reference Clark, Pye, Clark and Pye2000) that new forms of architecture and related social practices were emerging around 1200 b.c. It is probable that the absence of dominant centers allowed a new form of interaction among diverse groups in southern Mesoamerica. At the same time, I concur with Rosenswig (Reference Rosenswig2010) that this change accelerated around 1000 b.c., possibly tied to the increase in maize productivity.
MAYA AND OLMEC: THE QUESTION OF IDENTITY
Our brief summary of the research results from Ceibal published elsewhere (Inomata et al. Reference Inomata, Triadan, Aoyama, Castillo and Yonenobu2013) appears to have caused some misunderstandings among the general public and archaeologists, and here I would like to make my views clearer. First, I am not arguing that the lowland Maya civilization developed independently from the Olmec. On the contrary, my contention is that interregional interactions, including the residents of the southern Gulf Coast, were critical, and that the legacy of San Lorenzo played an important role. Second, I am not suggesting that the E-Group assemblage was a Maya invention (Inomata Reference Inomata, Freidel, Chase, Dowd and Murdock2016). Instead, it was a product of interactions among diverse groups. Third, our main contention was that we should move away from the dichotomized debate of whether lowland Maya civilization developed from Olmec influence or independently. It is misleading to impose overarching group identities, including “Olmec,” “Maya,” and “Mixe-Zoquean speakers,” and to consider them as units of social action. Certain labels are necessary for the sake of description, but they should not serve as a basis of explanation.
During the Early-Middle Preclassic transitional period, various groups in southern Mesoamerica selectively adopted and modified the legacies of the previous era closely tied to San Lorenzo and experimented with new ideas. Important elements tracing back to the previous period include deposits of greenstone axes seen at El Manatí, La Merced, and Canton Corralito (Cheetham Reference Cheetham2010; Ortíz and Rodríguez Reference Ortíz C., del Carmen Rodríguez, Grove and Joyce1999; Rodríguez and Ortíz Reference Rodríguez, Ortíz, Clark and Pye2000). Although Early Preclassic offerings of greenstone axes appear to have been deposited primarily outside of settlements, they began to be placed in ceremonial cores around 1000 b.c. The deposits of axes and other greenstone objects outside of settlements probably continued during the Middle Preclassic as seen in the offerings found at Arroyo Pesquero, and our understanding of this practice remains extremely fragmentary. Another significant element is a set of iconography, probably associated with certain religious concepts, again closely tied to San Lorenzo. Many groups continued to use or newly adopted this iconographic system while modifying specific forms and executions, for example, from the common use of carved motifs to that of incised ones on ceramics.
An important new development around 1000 b.c. was the establishment of standardized ceremonial complexes, including the E-Group assemblage. These spaces probably had their roots in the earlier tradition of public plazas and ceremonial courts found at San Lorenzo and on the southern Pacific Coast (Clark Reference Clark, Joyce and Hendon2004; Cyphers and Di Castro Reference Cyphers, Di Castro, Fash and Luján2009), but the Middle Preclassic version was characterized by a high degree of standardization across various regions and was well-marked by highly visible mounds and eventually by pyramids. They most likely served as spaces for communal gatherings and rituals. The symbolic and practical focus was on the plaza, and surrounding buildings also served as stages and backdrops for public performances. The construction sequence of Structure Ajaw makes it clear that it was originally designed as an easily accessible, open platform, and the later pyramidal form was an end-result of sequential renovations (see Joyce Reference Joyce2004). The well-defined spaces were probably tied to coordinated collective actions and may have contributed to the formation of a new social order (Love Reference Love, Grove and Joyce1999). In particular, the close similarities evident in greenstone caches found at Ceibal, Chiapa de Corzo, San Isidro, and La Venta, are suggestive. Unlike architecture that was constantly present and was easily copied any time, these deposits became invisible once they were sealed. The replication of similar forms would have been impossible without direct contact. Certain individuals probably visited other communities, possibly participating in others’ ritual. The MFC pattern, and the E-Group assemblage as its central element, developed in this Isthmian Interaction Sphere as results and media of exchange and adoption of ideas and practices.
Groups in other parts of the Maya lowlands began to adopt the E-Group assemblage around 800–700 b.c. when the MFC pattern was well developed in the Isthmian Interaction Sphere and La Venta was a major center. They selectively adopted the E-Group assemblage, but not the other architectural elements of the MFC pattern or, in most cases, greenstone axe caches. In addition, the lowland Maya built early E-Group assemblages with masonry and stucco construction techniques unlike the earthen structures at Ceibal and other western centers. These observations present important implications. First, currently available evidence suggests that the inhabitants of the Maya lowlands outside of Ceibal contributed little to the initial development of the E-Group assemblage. I should, however, add that if Actuncan is confirmed to have an E-Group assemblage contemporaneous with that of Ceibal, or if other E Groups dating to 1000–900 b.c. are found in the Maya lowlands, we may need to consider the possibility that a broader range of lowland Maya groups participated in the initial development of these standardized spatial formats. Second, the adoption of this architectural form around 800–700 b.c. probably did not result from unidirectional influence from Ceibal, La Venta, or other western centers (Demarest Reference Demarest, Sharer and Grove1989). The lowland Maya actively adopted this architectural form and modified it in their own way. After its initial adoption, E-Group assemblages became central foci of communal life at many lowland Maya settlements.
These patterns of interaction during the Early-Late Preclassic transitional period were highly complex, and they call for an explanatory framework that supersedes the dichotomous debate between Olmec influence and Maya independent development. A relevant issue is the assumption of a Mixe-Zoquean ethnic block occupying the southern Gulf Coast, Chiapas, and the Soconusco region proposed by Gareth Lowe and others (Clark and Pye Reference Clark, Pye, Clark and Pye2000; Clark and Pye Reference Clark, Pye, Love and Kaplan2011; Lowe Reference Lowe and Adams1977). The revision of historical linguistic data by John Robertson and Stephen Houston (Robertson Reference Robertson1993; Robertson and Houston Reference Robertson, Houston, Laporte, Arroyo, Escobedo and Mejía2003) indicates that the Wastekan speakers had close contacts with the Ch'olan-Tzeltalan branch of the Mayan language family and that the Wastekans moved to their current homeland around northern Veracruz later than previously thought. These data compel us to consider the possibility that Maya speakers were present in Chiapas earlier than the Mixe-Zoquean block hypothesis assumes. More importantly, we need to question the assumption underlying the ethnic block hypothesis that large groups of Mixe-Zoquean or Mayan speakers acted as important units of historical actions. Love (Reference Love, Love and Kaplan2011) and Demarest (Reference Demarest, Love and Kaplan2011) cogently highlight its problems, including: (1) the distribution of styles of objects do not always correspond with that of ethnic or language groups; (2) languages contribute to the formation of group identities but they may not be the sole or most important factor; there can be diverse ways in which languages, material cultures, and real or imagined historical roots are intertwined in identity formation; (3) the historical trajectories of language and ethnic groups do not necessarily exhibit a dendritic pattern, in which descendent groups branch out from a single progenitor group; they often go through complex networks of interactions among multiple groups (see Law et al. Reference Law, Robertson and Houston2006, Reference Law, Robertson, Houston, Zender and Stuart2014 for historical linguistic and epigraphic data); and (4) ethnicity as an overarching category binding large populations is mainly a phenomenon that became prominent with the establishment of nation states in modern times; the presence of ethnic blocks as primary units of social interaction should not be assumed but needs to be demonstrated. We need to examine how collective identities are formed, negotiated, and transformed through diverse actions and multiple media, including languages, historical narratives, material representations, and embodied practices.
The study of social processes at Ceibal and the surrounding regions require a flexible perspective that allows for dynamic and complex negotiations among various groups and individuals. The debate regarding the origins of sedentism with a fully developed ceramic technology in the Maya lowlands has focused on the question of whether they resulted from immigrations from the surrounding areas or from local developments among the indigenous populations of the lowlands (Andrews Reference Andrews, Harrison and Clancy1990; Cheetham Reference Cheetham and Powis2005; Clark and Cheetham Reference Clark, Cheetham and Parkinson2002; Willey Reference Willey and Adams1977). We probably need to consider how a mix of those two processes affected the social trajectory. The residents of Ceibal from 1000 to 800 b.c. appear to have shared considerable similarities in ceramics with other lowland Maya groups, but in terms of architecture and ritual deposits they were more closely tied to the western regions. Whereas the construction techniques of civic architecture and types of ritual deposits may closely reflect interactions among the emerging elites of Ceibal and their counterparts in other areas, the ceramics are probably more indicative of preferences and practices of a broader body of community members. If mobile horticulturalists inhabited the region before 1000 b.c., a substantial part of the Ceibal residents may have consisted of indigenous populations of the area. We need to consider the possibility, however, that at least some portion of this new community, particularly the emergent elites who may have led construction projects and communal rituals, were made up of immigrants from the west. In addition, if the removal of remains from the previous era prior to the construction of new centers at Ceibal and Chiapa de Corzo was a conscious statement of a break from the past, this action could have entailed significant tensions among groups harboring different values and perceptions. Alternatively, if the area around Ceibal did not support substantial populations before 1000 b.c., the community of Ceibal during the Real phase may have consisted largely of migrants from other parts of the Maya lowlands, Chiapas, and other neighboring regions. Negotiation among diverse groups—immigrants, local, sedentary residents, and mobile traditionalists—must have been a critical part of the social process. In this social setting, small groups, rather than overarching ethnic blocks, were probably more important for decision-making and coordinated action.
Over time the Ceibaleños’ affinities with the rest of the Maya lowlands grew stronger. The building methods became more homogeneous across the Maya lowlands with the full adoption of masonry construction and lime stucco during the late Middle Preclassic, and ceramics exhibited more commonalities through the Real 3 complex to the Mamom-corresponding Escoba pottery. The practice of caching greenstone axes was nearly abandoned at the beginning of the Escoba phase, although ceramics still showed considerable similarities to those in central Chiapas with the orange resist ware. By the end of the Middle Preclassic period, the MFC pattern at Ceibal appears to have lost its original meaning and use, and Ceibal was fully part of the lowland Maya cultural sphere, although continuing relations with Chiapas, the Maya highlands, and the Pacific Coast could be seen in Protoclassic ritual deposits, as evidenced by stone spheres. The increasing material and practical similarities probably fostered a sense of relatedness among the inhabitants of the Maya lowlands, although it does not equate with the ethnic identity seen in the modern times. This cultural identity of the lowland Maya was then a dynamic process tied to the history of interactions rather than a pre-existing condition of social processes.
This historical trajectory of interactions presents another important implication. The residents of Ceibal maintained close connections with the regions to the west when dominant Gulf Coast centers were absent between 1000 and 800 b.c., and then they strengthened ties with the rest of the Maya lowlands during the heyday of La Venta between 800 and 400 b.c. This pattern indicates that the inhabitants of the Maya lowlands were not passive recipients of unidirectional influence from La Venta but were active agents who engaged selectively in interregional interactions and local politics (P. Rice Reference Rice2015).
RESUMEN
Nuestras investigaciones en el sitio maya Ceibal han demostrado que un patrón espacial formal que consistió de un complejo tipo Grupo E y plataformas grandes comenzó alrededor de 1000 a.C. y expandió gradualmente durante los siguientes siglos. Una re-evaluación de datos cerámicos y fechas de radiocarbono reportados de otros sitios de las tierras bajas mayas sugiere que no hay evidencia segura para ocupaciones sedentarias y el uso de cerámica en esta área antes de 1000 a.C. y que no se han confirmado edificios públicos de tamaños significativos que fechan antes de 800 aC afuera de Ceibal. Los inicios de comunidades sedentarias con el uso de cerámica en varias partes de las tierras bajas mayas fueron aproximadamente simultáneos, el cual pueda haber sido estimulado por un cambio en la productividad de maíz. El desarrollo temprano de Ceibal probablemente resultó de su vinculó fuerte con las áreas del oeste, incluyendo la Costa Sur del Golfo, Chiapas central, y la Costa Pacífica de Chiapas y Guatemala. El patrón espacial estandarizado incluyendo el complejo tipo Grupo E parece haber desarrollado en esta red de intercambio, que puede ser llamada como la Esfera de Interacción de Istmo, durante un período de transición entre el declive de San Lorenzo y el surgimiento de La Venta como un centro grande (1200–800 a.C.).
ACKNOWLEDGMENTS
Investigations at Ceibal were carried out with permits issued by the Instituto de Antropología e Historia de Guatemala and were supported by grants from the National Geographic Society, the National Science Foundation (BCS-0750808), the National Endowment for the Humanities (RZ-51209–10), Ministry of Education, Culture, Sports, the Alphawood Foundation, and the Agnese Nelms Haury Program of the University of Arizona awarded to Inomata and Daniela Triadan, as well as funds from the Japanese Ministry of Education, Culture, Sports, Science and Technology KAKENHI (21101003 and 21101002) and Japan Society for the Promotion of Science KAKENHI (21402008 and 26101003) awarded to Kazuo Aoyama. I thank Norman Hammond, Prudence Rice, and an anonymous reviewer for thoughtful comments on earlier drafts. I am grateful for the colleagues who allowed me to examine their ceramic samples and shared their knowledge: Rebecca Gonzalez for materials from La Venta; James Krakker for the Smithsonian La Venta collection; Anne Cyphers for construction methods at San Lorenzo; Rita Casas for the IDEAH ceramoteca; Bárbara Arroyo for Kaminaljuyu ceramics; Marion Popenoe de Hatch and Tomás Barrientos for the Universidad del Valle collections; Bruce Bachand, Lynneth Lowe, John Clark, and Kim Goldsmith for ceramics from Chiapa de Corzo and the NWAF lab collection; Wyllys Andrews, George Bey, William Ringle, and Tomás Gallareta for Ek and related ceramics; Sylviane Boucher and Yoly Palomo for the INAH Mérida ceramoteca; Ronald Bishop for Robert Rands's ceramic samples; Rodrigo Liendo and Roberto López for the Middle Usumacinta region materials; Barbara Fash and Susan Haskell for the Peabody Museum collection; Simon Martin for the University of Pennsylvania Museum collection; Don Forsyth for Nakbe and El Mirador ceramics; Prudence Rice for Nixtun-Ch'ich’ ceramics; Patrick Culbert, Oswaldo Gómez, and Elizabeth Marroquín for Tikal ceramics; Jarosław Źrałka and Bernard Hermes for Nakum ceramics; Francisco Estrada-Belli, Niña Neivens, and Michael Callaghan for Holmul and Cival ceramics; Jaime Awe for Cahal Pech ceramics; Laura Kosakowsky for Cuello ceramics; Kathryn Brown for information on Blackman Eddy; Lisa LeCount for materials from Xunantunich and Actuncan; and Nobuyuki Ito and Akira Ichikawa for Chalchuapa and San Andrés ceramics.