I. INTRODUCTION
Zinc aluminate (ZnAl2O4) is a ternary oxide that belongs to a broader group of materials called spinels (AB2O4) whose crystal structure consists of A2+ and B3+ cations occupying 1/8 of total tetrahedral sites and ½ of total octahedral sites created by the cubic closed packing of oxygen ions. Cation ordering is a major feature of the spinel structure in which tetrahedral sites can be occupied by only A2+ ions (normal spinels) or only B3+ ions (inverse spinels) or both A2+ and B3+ ions (partially inverse spinels). ZnAl2O4 is usually a normal spinel with a very small degree of inversion (0–0.05) due to the strong preference of Zn2+ for tetrahedral sites.
Zinc aluminate finds several applications ranging from optics to catalysis. For instance, exploiting its intrinsic large band gap, this spinel can be processed to become a transparent conductive material suitable for optoelectronic applications.Reference Sampath and Cordaro1,Reference Zou, Li, Xiang, Evans and Duan2 Moreover, similar to gamma-alumina, high surface area ZnAl2O4 has been successfully used as a catalyst or a catalyst support, but with the advantage that the compound does not suffer transformation into alpha-alumina as its isostructural alumina.Reference Walerczyk, Zawadzki and Okal3,Reference Grabowska, Zawadzki and Syper4 Several studies have also investigated the structural changes and phase transformations for ZnAl2O4 under irradiation using heavy ions. The results indicate high tolerance to amorphizationReference Baldinozzi, Simeone, Crosset, Dolle, Thome and Mazerolles5,Reference Quentin, Monnet, Gosset, Lefrancois and Bouffard6 similar to other spinel compounds, such as MgAl2O4Reference Yamamoto, Shimada, Yasuda, Matsumura, Chimi and Ishikawa7 and MgGa2O4.Reference Shen, Feng, Tang, Valdez, Wang and Sickafus8 As this last has shown increased radiation tolerance when processed to retain grain sizes in the nanometer range, a similar beneficial effect is also expected for nanograined zinc aluminate.
Whether ZnAl2O4 is used as a catalyst or a nanostructured radiation tolerant material, thermodynamic properties of its surface (solid–vapor) and interface (solid–solid) should play important roles on the stability and processing conditions.Reference Garvie9–Reference Kellett and Lange12 Moreover, understanding the interactions of the surface with water vapor is of key importance given the predominance of water-bearing gases in most application environments. The presence of water will not only influence the surface chemistry but also systematically affect the surface energy. To the best of our knowledge, neither the interfacial energetics of ZnAl2O4 nor the effect of water adsorption on its surfaces was thoroughly investigated. Utilizing a recently established method based on water adsorption microcalorimetry,Reference Castro and Quach13 we studied the adsorption behavior of water on ZnAl2O4 nanoparticles and used the data to calculate the surface energy of ZnAl2O4 under several water coverage states. High-temperature oxide melt solution calorimetry was also used to obtain surface and interface energies of ZnAl2O4 independently. Surface energies of ZnAl2O4 determined from these two methods are consistent and will be discussed in comparison with those of other oxide spinels.
II. EXPERIMENTAL
Zinc aluminate powders were prepared by Pechini’s method in which Zn(NO3)2⋅6H2O (99.9%, Sigma-Aldrich, St. Louis, MO) and Al(NO3)3⋅9H2O (>98%, Sigma-Aldrich) (in stoichiometric proportion) were dissolved into a mixture of citric acid and ethylene glycol. Once all materials were dissolved to form a clear solution, it was brought to 120 °C for polyesterification and formation of metal chelates. The obtained resin was treated at 400 °C for 5 h under high airflow to give a zinc aluminate precursor with some carbon residues. This precursor was then divided into different batches and calcined at different temperatures (750, 800, 900, and 1200 °C) for 10 h in air.
X-ray diffraction was done on the ZnAl2O4 powders using a Bruker-AXS D8 Advance diffractometer (Bruker AXS, Madison, WI) with a copper target operating at an accelerating voltage of 40 kV and an emission current of 40 mA. Phase and crystallite size analysis was performed using Jade 6.1 (MDI) software with whole pattern fitting. Once the crystallite size was known for each sample, surface area based on XRD was calculated by assuming a spherical shape for powder particles. Transmission electron microscopy (TEM) of the powders was also carried out with a JEOL 2500SE (JEOL Ltd., Tokyo, Japan) TEM/STEM operated at 200 kV to confirm particles’ geometry. In addition, N2 adsorption analysis (Brunauer–Emmett–Teller, BET, method) was also performed using a Micromeritics ASAP 2020 system (Micromeritics, Instrument Corporation, Norcross, GA) to obtain the actual surface area of each powder. Magic angle spinning nuclear magnetic resonance (MAS NMR) of 27Al was also done to check cation ordering in these various ZnAl2O4 spinel powders.
High-temperature oxide melt drop solution calorimetry was performed on a custom-built Tian–Calvet twin calorimeter as described elsewhere.Reference Navrotsky14,Reference Navrotsky15 About 5 mg of ZnAl2O4 samples were loosely pressed and dropped from room temperature (∼24 °C) to the melt of lead borate at 702 °C. The assembly was flushed with air at a rate of 65 mL/min but no gas bubbling was used. Thermal signals were calibrated against the heat content of bulk α-alumina. Before calorimetric experiments, each ZnAl2O4 powder was exposed to the environment in the calorimetry suite (50 ± 5% humidity at 25 ± 1 °C) for at least 96 h to allow equilibrium water content. At the same time, thermogravimetric (TG) analysis of these powders was also done using a Setsys Evolution 1600 TG/DSC (Setaram Instrumentation, Caluire, France) to determine the exact amount of adsorbed water. About 25 mg of ZnAl2O4 powders equilibrated in the calorimetry suite were heated up to 1200 °C at a heating rate of 5 °C/min under flowing air. For each powder, the mass loss was obtained from an average of three TG experiments.
To correct drop solution data due to the adsorption of water on nanoparticles’ surfaces, a separate set of water adsorption experiments were carried out on a Micromeritics ASAP 2020 system linked to a Seteram DSC 111. A detailed description of water adsorption experiment and its setup was reported elsewhere.Reference Castro and Quach13 Loosely pressed pellets with a total surface area of about 2 m2 (determined by BET) were degassed at 450 °C for 12 h. Then water adsorption was carried out on these pellets at a controlled rate of about 2 μmol per dose with an equilibration time of about 1 h. An empty run (without sample) was also conducted under the same conditions to determine the amount of water vapor adsorbed on the glasstube and manifold. As recently developed in our laboratory,Reference Castro and Quach13 water adsorption experiments alone can also be used to determine surface energy of nanoparticles. Therefore, this method is utilized in this paper to compare with and independently check the surface energy obtained by high-temperature oxide melt calorimetry.
III. RESULTS AND DISCUSSION
A. Microstructural characterization
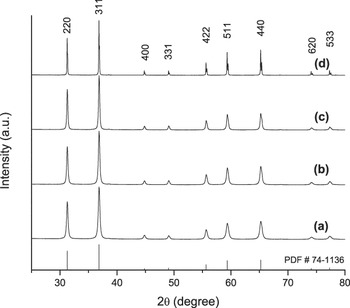
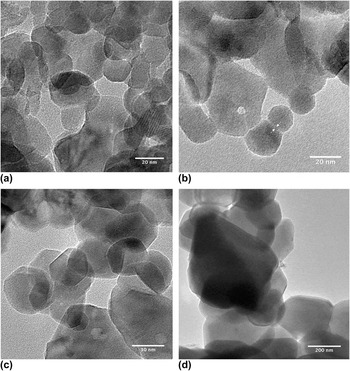
Figure 1 shows the collection of XRD patterns for the samples calcined at different temperatures and indicates the synthesized zinc aluminate powders contain a single phase with the cubic spinel crystal structure (PDF # 74–1136). Figure 1 also reveals sharpening of the peaks with increasing calcination temperature, suggesting grain enlargement due to coarsening. The grain size calculated from the XRD is 25.0 ± 0.9 nm for the powder calcined at 750 °C and 40.6 ± 1.9 nm for the one treated at 900 °C, as shown in Table I. Diffraction peaks for the powder calcined at 1200 °C were too narrow to allow reliable grain size calculation and was estimated to be >100 nm. Figure 2 shows TEM images for the ZnAl2O4 nanoparticles calcined at the different temperatures, confirming generally round-shaped particles, and sizes consistent with those calculated from XRD patterns. Solid–solid interfaces between particles can also be seen from these micrographs, suggesting partial sintering caused by calcination. To check ordering of the spinel phase, MAS NMR was performed and showed only a small percentage of Al3+ ions occupying tetrahedral positions (2.7, 1.9, and 1.1% for the powders calcined at 750, 800, and 900 °C, respectively). This is consistent with the expectation that Zn2+ ions have strong preference for tetrahedral sites,Reference Navrotsky and Kleppa16 and therefore, ZnAl2O4 is expected to be a normal spinel with a minimal degree of inversion (if any).
X-ray diffraction patterns of ZnAl2O4 calcined for 10 h at different temperatures (a) 750 °C, (b) 800 °C, (c) 900 °C, and (d) 1200 °C.

Sample characterization, water adsorption, and drop solution data.

Transmission electron micrographs of ZnAl2O4 powders calcined at different temperatures for 10 h: (a) 750 °C, (b) 800 °C, (c) 900 °C, and (d) 1200 °C. Arrows show an example of solid–solid interface between particles.

Table I summarizes surface area of different powders based on the crystallite sizes from XRD and measured by nitrogen adsorption (BET). It is no surprise that powders treated at higher temperature have lower surface areas, but the BET results are generally smaller than the areas calculated based on the crystallite size. This is consistent with the fact that BET is a direct assessment of the available surface area, while the results from crystallite sizes represent the total interface area surrounding a particle, implying that both solid–vapor (surface) and solid–solid (grain boundary) areas are included. A direct comparison between the areas from BET and those from crystallite sizes allow the estimation of the grain boundary area using the following equation:
 $${\rm{GBA}} = {{{\rm{XSA}} - {\rm{BSA}}} \over 2}\quad ,$$
where XSA and BSA are surface areas determined by grain size and BET, respectively. Since it takes two surfaces to form one solid–solid interface, the factor ½ is needed in Eq. (1).
Note that although the surface area (BET) decreases with increasing calcination temperature, the grain boundary area remains almost constant (∼10–11 m2/g) from 750 to 900 °C. This indicates that as the temperature is increasing, coarsening is taking place but without significant densification. This suggests that the main mechanism for coarsening is Ostwald ripening, as grain growth would lead to grain boundary area decrease, and sintering would lead to neck formation at this stage of the process.Reference Castro, Castro and van Benthem17,Reference Castro18
B. Water adsorption
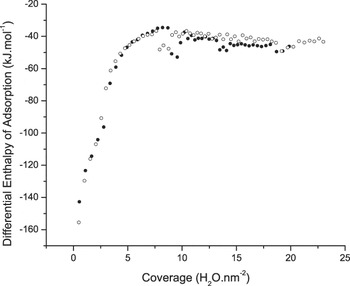
Investigation of the water adsorption behavior on the surface of the as-synthesized zinc aluminate was performed by recording the adsorbed amount and the enthalpy of adsorption during the exposure of the powder to controlled microdosages of vapor. Figure 3 shows the results for differential enthalpy of adsorption as a function of surface coverage (H2O per nm2) for two experiments conducted under the same conditions. The results for both tests are consistent, confirming the reliability of the method. The curves show a typical behavior with highly exothermic adsorption behavior at low coverages, and a systematic decrease followed by leveling. At the lowest measured coverage (0.49 H2O per nm2), the enthalpy of adsorption is −155.46 kJ/mol, indicating a strong chemisorption of water on the anhydrous surface, which is consistent with a dissociative behavior. The measured heat of adsorption decreases (in magnitude) quickly as more water molecules adsorbed and reaches a first plateau around −35 kJ/mol at ∼7 H2O per nm2. This behavior is consistent with recent literature data on the water adsorption on γ-Al2O3, which has a similar spinel structure.Reference Castro and Quach13 At first, it may sound counterintuitive that the enthalpy of water adsorption is less exothermic than the enthalpy of liquefaction of water at 24 °C (∼−44 kJ/mol). However, though the enthalpy of adsorption is less negative than −44 kJ/mol, the process is still exothermic and simply suggests the existence of hydrophobic sites on ZnAl2O4 surfaces, similar to what Bolis et al.Reference Bolis, Fubini, Marchese, Martra and Costa19 reported for SiO2 surfaces. As the coverage increases above 8 H2O per nm2, the enthalpy of water adsorption slowly converges to −44 kJ/mol.
Repeated experiments for water adsorption of ZnAl2O4 at 24 °C. Differential enthalpy of adsorption converges to −44 kJ/mol (enthalpy of liquefaction of water) at high coverages.

The water adsorption behavior on the surface of ZnAl2O4 is indeed similar to that of γ-Al2O3 reported elsewhere.Reference Castro and Quach13 Although at the lowest dosage measured for ZnAl2O4 (0.49 H2O per nm2), the enthalpy of adsorption is −155.46 kJ/mol for γ-Al2O3 and the value is −158.83 kJ/mol at 0.40 H2O per nm2. However, the heat of water adsorption on ZnAl2O4 converges to the enthalpy of liquefaction at a lower coverage (∼13 H2O per nm2) as compared with γ-Al2O3 (∼16 H2O per nm2). Assuming that the size of bound water is 0.25 nm2 per H2O,Reference Brunauer, Kantro and Weise20 this coverage is calculated to be roughly three monolayers for ZnAl2O4 nanoparticles, whereas for γ-Al2O3, −44 kJ/mol is only achieved after four monolayers.Reference Castro and Quach13 This contrast between ZnAl2O4 and γ-Al2O3 suggests that the latter surface holds water molecules more tightly.
The observed adsorption profile is very consistent with the proposed model of water adsorption in two stages reported elsewhere.Reference Castro and Quach13 The model describes an initial one-interface adsorption stage where water adsorbs in a dissociative manner. With increasing coverage, a transitional stage takes place before a two-interfaces profile is formed. Under this condition, the outer most water molecules suffer little influence from the surface of the particle and are in a liquid-like configuration. The achievement of this final stage is confirmed by the adsorption isotherm profile and by the enthalpy of adsorption being that of liquefaction of water. Once the liquid-like configuration is achieved by the adsorbed water molecules, it has been suggested that the surface energy of liquid water at 24 °C (0.072 J/m2) can be assigned to the surface itself.Reference Castro and Quach13 Therefore, the surface energy of previous hydration states can be calculated using the following equationReference Castro and Quach13,Reference Arrouvel, Digne, Breysse, Toulhoat and Raybaud21 :
 $${\rm{\gamma }}_i^{\rm{S}} = {\rm{\gamma }}_{i - 1}^{\rm{S}} + {{\rm{\theta }}_i} \times {\Delta H_{{\rm{ads}}}}\quad ,$$
where  ${\rm{\gamma }}_i^{\rm{S}}$ and
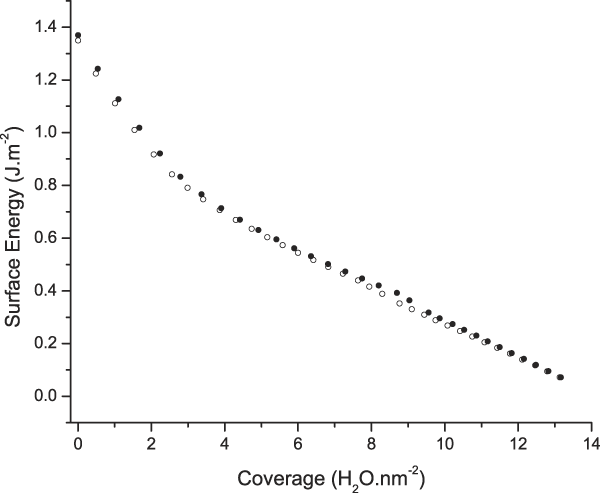
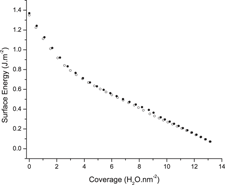
 ${\rm{\gamma }}_{i - 1}^{\rm{S}}$ are surface energies of states i and i − 1, respectively, θi is the increase in surface coverage from state i − 1 to state i, and ∆H ads is enthalpy of adsorption during that process. Using this equation, the surface energy of ZnAl2O4 at different water coverages was calculated and is plotted in Fig. 4. From these water adsorption results, the anhydrous surface energy of ZnAl2O4 is determined to be 1.36 ± 0.08 J/m2. [The error ±0.08 J/m2 is a result of incorporating uncertainty in surface area measurements (BET) into calorimetric results during water adsorption.] This value is slightly smaller than for γ-Al2O3 (1.57 ± 0.05 J/m2 from water adsorption experimentsReference Castro and Quach13 and 1.53 ± 0.40 J/m2 from high-temperature drop solution calorimetryReference Castro, Ushakov, Gengembre, Gouvea and Navrotsky22), which is consistent with the water adsorption trend discussed above.
Surface energy of ZnAl2O4 at different coverages as calculated from water adsorption. Two data sets correspond to two water adsorption experiments performed under same controlled conditions.
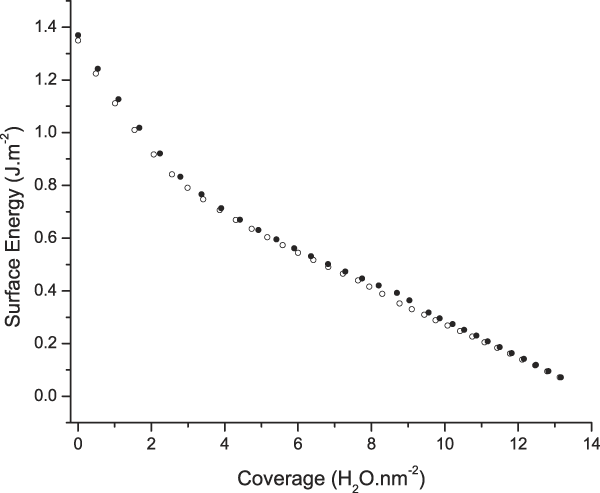
Note from Fig. 4 that the surface energy decreases with increasing coverage at two distinct slopes, a steeper one from 0 to about 3 H2O per nm2 and another from that coverage on. This behavior is obviously linked to the differential heat of water adsorption in Fig. 3, which shows a much more exothermic effect on the adsorption of the first water layers. If one plots the surface energy decrease as a function of the relative pressure of water (or relative humidity) during the experiment, one observes that the massive surface energy change (and water coverage) occurs when the pressure increases from 0 to 0.01 (1% relative humidity). This suggests that the surface energy of the anhydrous state will rarely be observed under real processing conditions, where the relative humidity far exceeds 1%. Moreover, the humidity level will define the “effective” surface energy during processing.
For instance, having in mind, the application of the zinc aluminate nanoparticles for fabrication of ceramic parts through sintering in which surface energy is the main driving force,Reference Kellett and Lange12 considering the presented results, the humidity level of the processing environment becomes a very important parameter. That is, after compaction in the desired shape, nanoparticles are commonly exposed to relative humidity of at least 30% before densification. This will decrease the surface energy from the anhydrous 1.36 J/m2 value to about 0.25 J/m2 (effective surface energy) as it corresponds to roughly 10 H2O per nm2. This signifies a major decrease in the driving force for densification. Surely, sintering processes take place at high temperatures (typically 2/3 of the melting point), and one should expect the humidity levels to be very low under that condition. However, humidity in the powder will remain at the initial stages of sintering, leading to lower densification rates and prejudiced microstructural control. Controlling the exposure of the powder to water or establishing a drying schedule may help result in higher densification in ceramic materials. In fact, the role of water vapor atmosphere on sintering behavior has been addressed in the literature. It was shown that highly anhydrous MgO can achieve high densities under field-assisted sintering (>99%) at low temperature, allowing the formation of transparent ceramics.Reference Tran, Hayun, Navrotsky and Castro23 Moreover, tin dioxide densification decreases with increasing water relative pressure in the sintering chamberReference Perazolli, Varela, Leite, Longo, Salgado and Filho24 and similar effect is seen for MgOReference Anderson and Morgan25 (though neither effect has been related to a decrease in driving forces due to surface energy change and only kinetic arguments were discussed).
C. High temperature oxide melt solution calorimetry
An independent method to assess anhydrous surface energy of zinc aluminate was used to cross-check the data from water adsorption. High-temperature oxide melt solution calorimetry is a technique capable of providing both surface and grain boundary energies of oxides via measurements of enthalpy of dissolution. The method has been described elsewhere in more details,Reference Castro18,Reference Costa, Ushakov, Castro, Navrotsky and Muccillo26 but basically the calorimeter records the enthalpy of dissolution of samples prepared with distinct interface areas in a high temperature solvent and dropped from room temperature. If the bulk structure is kept the same for all specimens, the difference in the enthalpy of solution can be attributed to the energetic contribution of the interfaces, and with adequate microstructural analysis, interface energetics can be singly derived.Reference Costa, Ushakov, Castro, Navrotsky and Muccillo26 As the samples to be dissolved are very refractory, oxide melts are used as the solvents at high temperatures as described in the experimental section.
This sort of experiment requires nanoparticles to allow for a large amount of interface areas. That is, interface energies are typically small quantities that can be easily overseen due to other heats evolving during a dissolution process. Nanoparticles enable a multiplication of the interface contribution, allowing measurable and reliable signals. However, due to the inherent reactivity of nanoparticles, if exposed to water vapor (even local humidity), large amount of adsorbed water are expected. During dissolution in the calorimeter, water desorption, evaporation, and heating will take place.
To account for water-related energetic contributions, a thermochemical cycle is required. To control the amount of adsorbed water, the samples were rested for equilibration with the environment in a testing room with controlled humidity and temperature as described in the experimental section. From TG experiments, the adsorbed water contents on different ZnAl2O4 powders were determined and are listed in Table I. Combining TG and water adsorption data, one can correct the enthalpy of dissolution data for ZnAl2O4 with different surface and interface areas using the following thermodynamic cycle:
 $$\eqalign{ {\rm{ZnAl}}_{\rm{2}} {\rm{O}}_{\rm{4}} \cdot x{\rm{H}}_{\rm{2}} {\rm{O}}_{{\rm{(surface,}}\,{\rm{24}}\,{\rm{^\circ C)}}} = {\rm{ ZnAl}}_{\rm{2}} {\rm{O}}_{\rm{4}} _{{\rm{(soln}}{\rm{.,}}\,{\rm{702}}\,{\rm{^\circ C)}}} \,+ x{\rm{H}}_{\rm{2}} {\rm{O}}_{{\rm{(g,}}\,{\rm{702}}\,{\rm{^\circ C)}}} \quad \;\,\,\,\,\,\,\,\hskip-1pt\Delta H_{\rm{1}} = \Delta H_{{\rm{ds}}} \cr x{\rm{H}}_{\rm{2}} {\rm{O}}_{{\rm{(g,}}\,{\rm{702}}\,{\rm{^\circ C)}}} = x{\rm{H}}_{\rm{2}} {\rm{O}}_{{\rm{(g,}}\,{\rm{24}}\,{\rm{^\circ C)}}} \;\quad\quad\quad\quad\quad\quad\quad\quad\quad\quad\quad\quad\quad\quad\quad\quad\quad\quad\!\!\Delta H_{\rm{2}} = x{\rm{(}} - {\rm{25}}{\rm{.0 \pm 0}}{\rm{.1) kJ/mol}} \cr x{\rm{H}}_{\rm{2}} {\rm{O}}_{{\rm{(g,}}\,{\rm{24}}\,{\rm{^\circ C)}}} = x{\rm{H}}_{\rm{2}} {\rm{O}}_{{\rm{(surface,}}\,{\rm{24}}\,{\rm{^\circ C)}}} \quad \quad\quad\quad\quad\quad\quad\quad\quad\quad\quad\quad\quad\quad\quad\quad\quad\!\!\Delta H_{\rm{3}} = x\Delta H_{{\rm{ads}}} \cr {\rm{ZnAl}}_{\rm{2}} {\rm{O}}_{\rm{4}} _{{\rm{(nano,}}\,{\rm{24}}\,{\rm{^\circ C)}}} = {\rm{ZnAl}}_{\rm{2}} {\rm{O}}_{\rm{4}} _{{\rm{(soln}}{\rm{.,}}\,{\rm{702}}\,{\rm{^\circ C)}}} \,\,\quad\quad\quad\quad\quad\quad\quad\quad\quad\quad\!\,\,\,\,\,\,\,\,\,\,\,\,\,\,\,\Delta H_{\rm{4}} = \Delta H_{{\rm{ds\_corr}}} \cr \Delta H_{\rm{4}} = \Delta H_{\rm{1}} + \Delta H_{\rm{2}} + \Delta H_{\rm{3}} \cr} $$
The enthalpy of drop solution of microsized ZnAl2O4 (sample calcined at 1200 °C for 10 h with negligible surface and interface areas) measured in this work was 201.24 ± 1.10 kJ/mol. Navrotsky reported the solution enthalpy of ZnAl2O4 in the same solvent (lead borate) at 700 °C to be 92.19 ± 1.02 kJ/mol.Reference Navrotsky27 The heat content of ZnAl2O4 from 24 to 702 °C is calculated to be 107.54 kJ/mol.Reference Robie and Hemingway28 Combining these two literature data give a calculated enthalpy of drop solution of 199.73 ± 1.02 kJ/mol, which is very close to our experimental result (within experimental uncertainties). As one goes from bulk ZnAl2O4 to nanopowders, surfaces and grain boundaries introduce excess energies that are released during high-temperature drop solution calorimetry. Therefore, the drop solution enthalpy (after water correction) for these nanopowders should be less endothermic (i.e., more exothermic) as represented in the following equation:
 $$\Delta H_{{\rm{ds\_corr,nano}}} = \Delta H_{{\rm{ds, \,bulk}}} - {\rm{\gamma }}_{\rm{s}} {\rm{BSA}} - {\rm{\gamma }}_{\rm{i}} {\rm{IA}}\quad {\rm{,}}$$
where γs and γi are anhydrous surface energy and interface energy, respectively.
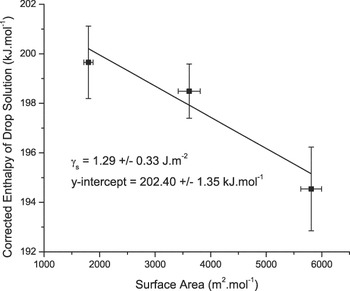
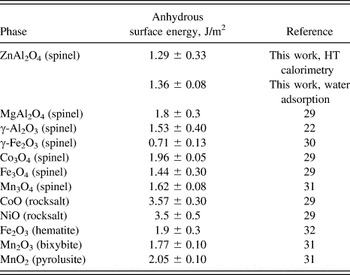
Though one could consider that a solution for the linear system composed of three equations built from the data from Table I (grain boundary and surface areas) into Eq. (3) as a manner to estimate the interface energies because all three nanopowders have very similar grain boundary areas (∼10–11 m2/g), this approach is mathematically impractical. However, the plot of ΔH ds_corr, nano versus BSA should be linear with slope equals −γs (anhydrous surface energy) and y-intercept equals (ΔH ds, bulk – γi IA) (Fig. 5). By using a linear fitting to the data plotted in Fig. 5, the anhydrous surface energy of ZnAl2O4 was determined to be 1.29 ± 0.33 J/m2. This value is very consistent with that obtained from water adsorption on ZnAl2O4 nanoparticles presented earlier in this paper (1.36 ± 0.08 J/m2). To the best of the authors’ knowledge, no surface energy value for ZnAl2O4 has been reported previously. A list of surface energies of various oxides with different crystal structures are given in Table II. The anhydrous surface energy of oxide spinels listed tends to be from 1 to 2 J/m2, which is generally smaller than surface energies for metals and rocksalt-structured oxides. The data from the present work fall well within the spinel value range, reinforcing the evidence for this universal trend.
Enthalpy of drop solution of ZnAl2O4 after correction for water adsorption on surfaces. Note that these three ZnAl2O4 powders have similar interface areas (∼2000 m2/mol).

Surface energies of oxides with different crystal structures.

From the y-intercept in Fig. 5, (ΔH ds, bulk – γi IA) is determined to be 202.40 ± 1.35 kJ/mol. Given that the drop solution enthalpy of bulk ZnAl2O4 is 201.24 ± 1.10 kJ/mol, the product γi IA = −1.16 ± 1.74 kJ/mol. From this, we may conclude that the contribution of grain boundary areas (1985 m2/mol in average) to the energetics of the ZnAl2O4 nanopowders used in this study is too small and within the uncertainty of the measurements, suggesting small grain boundary energy. As discussed above and pointed out by Navrotsky et al.,Reference Navrotsky, Ma, Lilova and Birkner29 the surface energies of spinel structures are expected small as compared with other crystal structures such as rocksalt. Results from our work also suggest that the grain boundary energy of ZnAl2O4 may follow similar trend. It is important to note that the powders prepared for this work were calcined at different temperatures, and the resulting grain boundaries are due to coarsening taking place during the 10 h of treatment (details in the Sec. II). This long annealing may benefit the presence of low energy boundaries. More studies are though required to estimate reliable grain boundary energies for this compound.
Compared with other oxides listed in Table II, the surface energy of ZnAl2O4 is on the lower end and slightly smaller than that of isostructural γ-Al2O3 and MgAl2O4. As discussed previously in the water adsorption section, lower anhydrous surface energy indicates weaker binding between water and surface sites of ZnAl2O4. This may contribute to good catalyst performance of ZnAl2O4 as water on its surface can be more readily displaced and surface sites become more energetically accessible to other species. Birkner and NavrotskyReference Birkner, Nayeri, Pashaei, Najafpour, Casey and Navrotsky33 argued that the significantly smaller surface energy of calcium manganese oxide (as compared with Mn3O4, Mn2O3, and MnO2) was one of the major factors contributing to the superior catalyst performance of this compound in comparison with its manganese oxide counterparts. Similarly, Ma et al.Reference Ma, Castro, Zhou and Navrotsky34 suggested that one of the reasons behind the better gas-sensing ability of SnO2 as compared with its isostructural rutile (TiO2) was the former’s lower surface energy. The low surface energy of ZnAl2O4 supports that this spinel is a strong candidate for high performance catalysts as compared with other spinels, such as gamma-alumina and magnesium aluminate.
IV. CONCLUSIONS
Results from both water adsorption microcalorimetry and high-temperature oxide melt drop solution calorimetry give similar anhydrous surface energy for ZnAl2O4 nanoparticles. These values are within the range of surface energies for other oxide materials with the spinel structure reported in the literature. Water adsorption behavior of ZnAl2O4 is similar to what reported for γ-Al2O3 previously, suggesting similar energetics and structure on the surface. The anhydrous surface energy of ZnAl2O4 is determined to be 1.36 ± 0.08 and 1.29 ± 0.33 J/m2 from water adsorption microcalorimetry and from high-temperature drop solution calorimetry, respectively. Adsorption of water caused a systematic and predictable decrease on the surface energy. The data suggest that humidity present during powder processing will decrease driving forces for sintering of this material. Despite a decent amount of interface area existing in the sample powders (∼2000 m2/mol), the interface contribution to excess energy was negligible (within error limits of the measurements), suggesting small interface energy for ZnAl2O4, but further studies are required.
ACKNOWLEDGMENTS
The authors are very grateful to the financial support from the U.S. Department of Energy, Office of Basic Energy Sciences grant number ER46795. We would like to thank Sanchita Dey for her help with TEM. Finally, D.V.Q. and R.H.R.C. would like to dedicate this article as a token to celebrate Prof. Alexandra Navrotsky's 70th birthday and her immense contributions to the calorimetry and thermodynamics understanding of ceramic, earth, and environmental materials chemistry.