Introduction
Materials innovation initiatives
A number of US-based, 1–3 as well as international, Reference Schmitz and Prahl4,5 efforts are now focused on accelerated deployment of advanced materials in commercial products. Currently employed protocols follow a sequential process that starts with materials discovery, systematically progressing through materials development, property optimization, systems design and integration, certification, and manufacturing, leading eventually to commercial deployment. 1 This sequential workflow is intensive, both in terms of time and cost, and is generally reported to take 15–25 years. 1,2,Reference Hale6,Reference Eager7 There is clearly an incentive to transform these sequential workflows to more dynamic workflows that allow for concurrent consideration and utilization of legacy as well as currently available information and knowledge from diverse stakeholders at each step of the decision-making process.
Announced in June 2011, the Materials Genome Initiative (MGI) specifically identified these issues, and established the goal of reducing the time and cost of materials development and deployment by 50%. 1 Essential to achieving this goal is the development and deployment of a supporting infrastructure that integrates a wide range of data, experimental, and computational assets into materials innovation efforts. In 2014, the MGI Strategic Plan 8 highlighted the need to facilitate the integration of experimental data, computational data, and theory across material classes, and to make experimental and computational data accessible, sharable, and transformable. Building this materials data infrastructure through the MGI will enable integrated computational materials engineering (ICME) 2 approaches to be deployed with greater success and efficiency and enable the ultimate goals of the MGI to be achieved.
The realization of the ambitious vision and goals of the initiatives described demands a revolutionary transformation in current materials innovation protocols. Numerous reports and publications in the recent literature have identified the key elements of this desired transformation. 9–Reference McDowell and Kalidindi17 Recent discussions around this topic have identified the lack of tight coupling between multiscale experiments and the multiscale models/simulations employed in the materials innovation efforts as a key barrier. This is not surprising, given the breadth of the disciplinary expertise (including materials science, mechanics, manufacturing, design, systems) and the multiscale physics (spanning multiple length and time scales) that need to be leveraged and integrated in this effort.
The same reports also identified the exchange of high-value information and expertise between the diverse stakeholders as a key rate-limiting step in accomplishing the desired tight coupling between experiments and models. These exchanges are expected to involve a large variety of data in multiple forms (e.g., raw data, metadata, images, schematics, anecdotes, annotations, discussions) and at multiple levels of refinements Reference Kalidindi13,Reference Kalidindi15 (i.e., information, knowledge, and wisdom). As such, the realization of the vision expounded in the strategic initiatives mentioned earlier critically requires an aggressive adoption of modern toolsets from the emerging fields of data science, informatics, and big data.
Data science and informatics—Emerging new disciplines
Modern data science is rooted in advanced statistics and computer/computational sciences Reference Donoho18–Reference Hey, Tansley and Tolle20 and has already impacted the practices in many fields. The main goal of data science is to develop novel approaches, algorithms, methods, tools, and the associated infrastructure needed to organize and streamline the processes and sub-processes involved in extracting high-value (actionable) information from all available data and resources. It entails multistep inferences that may be conveniently represented as data → information → knowledge → wisdom, where each hierarchical level denotes a higher level of refinement of all available data. It is extremely important to recognize that it is not enough to facilitate the sharing of data. In most instances, the raw data are extremely large and cumbersome to share and disseminate. It is far more important to facilitate organized and streamlined efforts (possibly as communities of practice) Reference Wenger21 aimed at collaboratively extracting high-value information, with potentially high payoffs in the form of accelerated discovery and increased productivity.
As one might imagine, a central component of any data-centered endeavor is a suitable data infrastructure that is designed to capture, accumulate, and archive the raw data and all of the metadata (this typically includes all of the important details that enhance the discoverability and searchability of the data, such as details of data acquisition protocols employed, provenance of data, and salient attributes of the information contained in the data). In many domains, this is indeed the main hurdle and is often referred to as datafication. In other words, datafication addresses the protocols employed in automated capture of all of the relevant data and the metadata needed for subsequent analyses of the data (i.e., data analytics). This infrastructural component of data science is concerned with data ingestion and capture technologies (sensors, cameras, user interfaces, fillable forms), database technologies (relational, NoSQL, graph, and time series), and data management technologies (security, cloud storage).
The tools employed in the analysis of the accumulated data are broadly referred to as data analytic tools and are based generally on techniques such as noise filtering, data fusion, uncertainty quantification, statistical analysis, dimensionality reduction, pattern recognition, regression analysis, machine learning, and statistical learning. Most of the data analytic techniques and toolsets mentioned can be conveniently accessed through source-code repositories, such as R, 22 SciPy, 23 NumPy, Reference Walt, Colbert and Varoquaux24 Scikit-learn, 25 StatsModels, Reference Seabold and Perktold26 and Pandas, Reference McKinney27 as well as through commercial packages such as MATLAB. 28
In addition to the data analytics and data infrastructure components described, any modern innovation ecosystem has to include e-collaborations, or online cross-disciplinary collaborations, as a core strategy. Emerging e-collaboration toolsets (also referred as informatics toolsets) are focused on critical functionalities, such as teaming tools (i.e., project- and team-management tools), visualization tools (e.g., for high-dimensional or multimodal data sets), annotation tools (facilitating both technical and nontechnical discussions), and workflow capture and management tools. A workflow captures all details of a set of interconnected processes employed to perform or replicate a given task. In other words, it is a complete recipe for accomplishing a specific task.
It should be emphasized that digital capture, sharing, and dissemination of workflows and the results generated from the workflows (both successes and failures) are the only practical way for a diverse community of practitioners to systematically explore a large combinatorial set of potential workflows that integrate cross-disciplinary expertise. Only in this manner is it conceivable to identify the best practices that would eventually lead to standards and automation; these, in turn, will produce the desired acceleration (and scale-up) in the innovation efforts. Examples of currently available toolsets offering e-collaboration functionalities described include Project Jupyter, 29 Galaxy, 30 Pegasus, 31 KNIME, 32 Orange, 33 and gUSE. 34
Successful adoption of data science and informatics toolsets in various application domains can lead to the formation of e-science gateways 35 or hubs. 36,37 In addition to streamlining the efforts of an entire community, such efforts address organically the challenge of reproducibility and replicability in science.
Given the emergent nature of data science and informatics, it is only natural that a significant amount of customization is needed before currently available data science and informatics tools can be applied successfully to the problems and challenges encountered in materials-innovation activities. Substantial effort has been focused in this direction in recent years, leading to the birth of the new field referred to as materials data science and informatics. In particular, there have been several demonstrations of the potential of materials data analytics in extracting high-value materials knowledge from raw data sets in a broad range of materials applications. Reference Krein, Natarajan, Schadler, Brinson, Deng, Gai, Li and Breneman38–Reference Shaffer, Knezevic and Kalidindi54 There have also been many efforts aimed at building the materials data infrastructure to enable collection and distribution of materials databases. 55–Reference Tadmor, Elliott, Sethna, Miller and Becker66
Materials data and databases
There are many open and commercial materials databases available today, including first-principle databases, Reference Curtarolo, Setyawan, Hart, Jahnatek, Chepulskii, Taylor, Wang, Xue, Yang and Levy57 atomistics and interatomic potential databases, 61 and engineering property databases. 59,63,64 Accessing, sharing, and taking full advantage of these databases often presents a challenge to the materials community because the data/knowledge contained in these databases is not easily discovered and organized by commonly used search engines (i.e., they currently only search and index a limited number of file types and formats). In other words, even when most of the data are computer readable, the format conversions place impediments to the discoverability of the data.
A further limitation of the existing databases is that they seldom provide the user with a history of the curation efforts associated with the database; the user does not typically have immediate access to a prior history of successes and failures associated with the use of the specific database. This contextual information is critical for the user to develop sufficient confidence in the use of the available databases.
As a simple example, consider a search for the diffusivity of Ni in the Ni-based superalloy, IN718. A simple “Google” search for this information returns several scientific journal articles, some of which contain information related to the diffusion of Ni in IN178, but do not specifically state the diffusivity coefficient. A more productive search for this information is done using MatNavi, a comprehensive database of materials properties and data sheets made available by the National Institute for Materials Science. 64 The database allows searching for specific diffusion species in a specified material and provides a table with diffusivity values, the temperature range, the type of measurement, and, when available, the purity of the material. In our example, the four available results in this database were limited to Ni diffusivity in Ni-Cr-Fe alloys (Ni, Cr, Fe are the primary alloying components in IN718). To use these results, one must copy and paste from the web application. Methods to push this information directly into a computation tool that needs this information do not exist at this time.
Since the 1980s, there have been several efforts to address these challenges, which have included development of sharing tools and ontologies. For standardizing the data-archiving format, an extensible markup language (XML) schema provides an ideal structure for capturing materials science knowledge, because it is scalable, modular, and transformable for hierarchical data systems. Examples of XML-based schemas for materials include the materials property data markup language Reference Kaufman and Begley67,Reference Varde, Begley and Fahrenholz-Mann68 and the thermodynamics markup language. Reference Chirico, Frenkel, Diky, Marsh and Wilhoit69 While these XML schemas have been useful, they are currently limited in scope. Building on these efforts, new tools are being developed to improve data curation, such as the Materials Data Curation System, 70 Materials Commons, 71 and the Citrine platform. 55 Chance and Paul Reference Chance and Paul72 outline how to connect the wide variety of data sets and tools using a semantic web infrastructure.
Materials data analytics toolsets
Core materials knowledge that needs to be communicated to the design and manufacturing experts is best formulated as process–structure–property (PSP) linkages. The primary challenge in the formulation of the desired PSP linkages arises from the fact that the materials’ internal structure spans a multitude of length/structure scales engaged in a diverse set of multiphysics phenomena occurring over multiple time scales. Furthermore, most of the available information on the materials internal structure exists as images produced by a variety of materials characterization tools and protocols. The quantification and analyses of materials structure images is significantly complicated by the fact that the key points and descriptors are mostly as yet unknown (e.g., in face recognition, one knows a priori the important features one expects to see in the image, such as two eyes, one nose, and one mouth).
The most comprehensive set of structure measures available in current literature to quantify the material internal structure systematically and statistically come in the form of n-point spatial correlations (sometimes also referred to as n-point statistics). Reference Kalidindi15,Reference Brown73–Reference Milton77 As an example, one-point spatial correlations capture the probability of finding a specified local state of interest at any spatial point selected randomly in the microstructure. At the next higher level, two-point statistics quantify the neighborhood by looking at one other spatial location relative to the first randomly selected spatial point. Kalidindi and co-workers Reference Kalidindi15,Reference Gupta, Cecen, Goyal, Singh and Kalidindi48–Reference Shaffer, Knezevic and Kalidindi54 formulated and demonstrated a new, versatile, computationally efficient framework for establishing PSP linkages building on the framework of n-point statistics as measures of the material structure and customizing the emerging data science toolsets. The linkages are generally expressed either as homogenization (going from lower scales to higher scales) Reference Gupta, Cecen, Goyal, Singh and Kalidindi48,Reference Cecen, Fast, Kumbur and Kalidindi50 or as localization (going from higher scales to the lower scale). Reference Kalidindi52
A simple case study that employed the homogenization protocols is depicted in Figure 1 . In this demonstrator example, a structure–property linkage is targeted between an effective elastic stiffness component and the microstructure of a two-phase composite material. Eight microstructure classes containing 25 samples in each class were generated using the “make_microstructure” function in the Python-based materials knowledge systems (PyMKS). 78 The selected microstructures cover a broad range of volume fractions (from 0.2 to 0.8) and reinforcement shapes (selected aspect ratios ranged from thin and highly elongated reinforcements, 1:25, to equiaxed ones, 1:1). The autocorrelations (0, 0) and (1, 1) were used to create low-dimensional microstructure descriptors, and the linkage was created with a third-order polynomial regression model with three principal components. The cross-validation of the predicted value of the elastic stiffness indicated an acceptable mean error of 3.74%.
Illustration of a four-step data-centered protocol for establishing a structure–property linkage for an example two-phase composite data set. 95 (a) The first step digitizes any input microstructure and assigns values of zeroes and ones to indicate the local state present in each voxel. For the purposes of this example, three different classes of microstructures are created using hypothetical processes 1, 2, and 3, which correspond to different rules in the generation process. (b) The second step represents each structure as a set of two-point spatial correlation functions. l and l′ represent the local states at the first and second points, respectively, of the two-point correlation calculations. The units in the graphical representations are simply pixels (i.e., no length scales have been assigned), while the two-point correlations are dimensionless. (c) The third step represents the large set of statistics corresponding to each microstructure with a handful of measures or principal component scores (PC scores) obtained using principal component analysis. Note: the microstructures generated using different “processes” clearly separate out in this visualization. (d) The final step fits a multivariate polynomial basis function to establish a linkage between the structure (represented by the PC scores) and property (in this case, stiffness values obtained from a uniaxial loading simulation using a finite element model, as shown in the inset).

Materials e-collaborations
E-collaborations typically start with the formation of teams. Online services such as ResearchGate 79 and LinkedIn 80 have the potential to identify and add the precise expertise needed by a team. Tools for team and project management focus on facilitating and improving the wide variety of basic communications needed between team members. Discussion and annotation tools address the next higher level of communications between team members.
Visualization tools play an important role in communicating complex (often high-dimensional) data. Tools such as ParaView Reference Ahrens, Geveci, Law, Hansen and Johnson81 (and its variant TomViz), 82 Avizo, 83 and MeshLab Reference Cignoni, Callieri, Corsini, Dellepiane, Ganovelli and Ranzuglia84 are used for interactive exploration of gridded or meshed volumetric data. Simulation software such as Abaqus 85 and ANSYS 86 and analysis software such as MATLAB 28 and Mathematica Reference Wolfram87 have built-in capabilities to generate rich visualizations for volumetric data, as well as a wide array of plots and graphs. However, in order to facilitate effective communication of complex ideas and results and, consequently, to facilitate e-collaboration, it is essential for researchers to have the ability to share visualizations while maintaining interactivity.
Digital capture and management of research workflows has to be a core element of the efforts directed at accelerating and scaling up scientific and engineering innovation, in general, and materials innovation, in particular. Modern workflow tools 29–34 exhibit several desired functionalities, including workflow version control, capture, execution, deployment, and sharing.
In addition to the core components mentioned, the challenge of applying data analytic tools on distributed multiorganizational data sets requires automated data discovery, coordination, and integration. This task can be addressed through deployment of emerging semantic technologies that allow the encoding of contextual meanings/insights along with or in addition to the digital data. The integration of data science with semantic technologies is likely to produce many benefits, including significant enrichment of available data or knowledge, better integration and interoperability of data processes, improved human-machine interfaces, and improved ontologies. Reference Uschold and Gruninger88,Reference Chandrasekaran, Josephson and Benjamins89
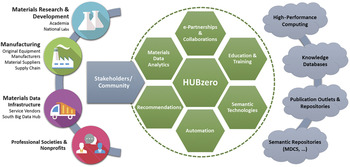
As previously noted, adoption of data science and informatics toolsets can lead to the development of novel communities of practice that are now being referred to as e-science gateways 35 or hubs. 36,37 A number of ongoing efforts are targeted at developing and deploying an e-science gateway to support the MGI and ICME initiatives previously described. One such e-science gateway, called MATIN, 90 has been in development over the past year at the Georgia Institute of Technology’s Institute for Materials 91 (GT-IMat). The main strategy for the MATIN platform has been to utilize HUBzero, 36 a general-purpose software to build an e-gateway or a hub as an infrastructural foundation, and build various added-value components on top of this foundation. Figure 2 provides a schematic of MATIN’s architecture and designed functionality.
Conceptual architecture of the MATIN e-science gateway designed to support materials innovation efforts of a group of diverse stakeholders engaged in a common materials development and deployment effort. Note: MDCS refers to the National Institute of Standards and Technology Materials Data Curation System.

Case study: Design of a γ/γ′ Ni-based superalloy
Because of their outstanding mechanical properties, γ/γ′ Ni-based superalloys have been used extensively for high-temperature applications in turbine engines. Reference Koizumi, Kobayashi, Yokokawa, Zhang, Osawa, Harada, Aoki and Arai92 Figure 3a shows the main components of a systems approach to the design of these superalloys. The processing of these alloys includes casting, mechanical work, solution treatment, and a tempering treatment that allows γ′ precipitates to strengthen the alloy. The strengthening level is critically dependent on the microstructure (including chemistry). In this example, a model chain was implemented, as shown schematically in Figure 3b, which includes a number of model components that simulate various aspects of γ′ precipitation and their impact on the mechanical properties of the alloy. More specifically, this case study focuses on optimization of the chemical composition of Ni(1–x–y)Al x Cr y and the processing conditions in order to maximize the work to necking (E WTN), which serves as an indicator of the toughness (defined as the area beneath the stress–strain curve to necking) of the alloy.
(a) A schematic design chart of the systems approach to design of γ/γ′ Ni-based superalloys; the bold lines are the focus of this work. Specifically, the tempering treatment is used to control the γ′ precipitation, which in turn controls the plastic flow stress and hardening characteristics. (b) Workflow employed in the γ/γ′ Ni-based superalloy design. The thermodynamic equilibrium calculation followed by the phase transformation, nucleation, growth, and coarsening models estimate the volume fraction and mean radius of γ′ after the tempering treatment. The processing time is determined to maximize the yield stress according to the phase-transformation models. Based on this microstructure, the stress–strain curve and work to necking (E
WTN) are computed. A genetic algorithm is used to search the optimum chemical composition and tempering temperature. Note: T
p, tempering temperature; APB, antiphase boundary; FCC, face-centered cubic; t
incu, incubation time of γ′ precipitation; R, radius of γ′ particle;
 $V_f^{{\rm{\gamma '}}}$
, volume fraction of γ′; Y
s, Young’s modulus of the phases; C
i,t
, composition i of the matrix phase at processing step t; N
t, number density of γ′ particle; Δt, incremental time step of the processing treatment; εel, maximum strain in the elastic deformation; τε, shear stress; Δε, strain step; τε
+
Δε, shear stress at the ε + Δε strain step; ρε, dislocation density at the ε strain step; σys, yield strength.
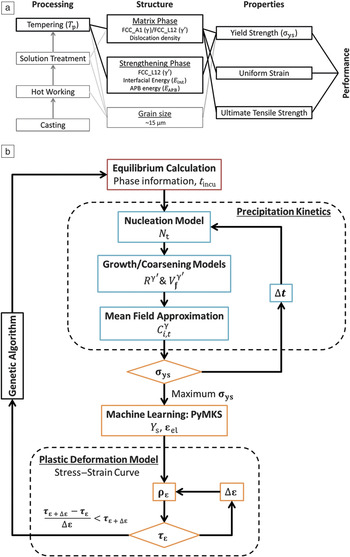
The model chain employs simple phase-based models to simulate the γ′ precipitation in conjunction with other mechanics models to predict the stress–strain curves of the alloys being studied. Classic nucleation, growth, and coarsening models are employed with thermo-calc and the thermo-calc Ni-based superalloys database v6 (TCNI6) for γ′, simulating details of the precipitation phenomena at the tempering temperature (T
p). The inputs to the model are generated by the genetic algorithm (GA) and consist of processing and service temperatures as well as a composition range. The output of the model is a prediction of the yield strength (σys) at the service temperature (T
s). When σys is maximized through selection of the optimum size and the volume fraction of γ′ (denoted as
 $V_f^{{\rm{\gamma '}}}$
), the workflow exits the precipitation kinetic models to calculate the stress–strain curve. Using the established value of the
 $V_f^{{\rm{\gamma '}}}$
as the input to the functions available in the PyMKS framework,
78
the Young’s modulus (Y) is estimated. Using an energy conservation model with irreversible thermodynamics, the plastic deformation of the microstructure is simulated, and the results are presented as a stress–strain curve. E
WTN is calculated, and a GA is applied to optimize E
WTN. The results show that Ni-0.179Al-0.192Cr (in mole fraction) after a one-minute tempering treatment at 1337 K provides a maximum E
WTN at a service temperature of 1123 K from among the 229 alloys considered in the study.
A critical look at the model chain employed in this case study reveals that it comprises highly idealized model components. In fact, one might argue that some of the models are too simple. However, that would not be the central point of the present case study. The main purpose of this case study is to demonstrate the feasibility and benefits of the digital capture of the workflow employed in a Jupyter notebook. Jupyter notebooks are sharable documents that display and annotate the procedures used in a project, emphasizing human readability while allowing the execution of the written code. The inputs and outputs from all of the models are saved as XML documents. As a result, the workflow is modular, and allows easy modification and application to new problems. The notebook, source code, and supporting documents are openly accessible. 93,94
The capture and publication of this workflow provides a unique unprecedented opportunity for a community-level e-collaboration in the structural materials domain. Any expert from any organization around the world has complete access to all the details of this work. Each of the model components within the model chain are available for modification by domain experts, while still maintaining the provenance of all research contributions. Proper credit is automatically assigned to all such contributions. This mode of sharing also promotes reproducibility and replicability in science, while accelerating the rate of materials innovation.
Summary
The role of materials data science and informatics in advancing the goals and vision of the MGI are expounded in this article. The main components needed to establish a novel materials innovation cyberinfrastructure are reviewed, along with the numerous web services and open-source toolsets currently available to meet these critical needs. An example was presented to demonstrate the potential advantages of these modern data-centered toolsets. This example was centered on the design of a γ/γ′ Ni-based superalloy using a model chain. The workflow involved accessing and utilizing data from databases, while maintaining modularity for model components. Most importantly, this example demonstrated digital capture and sharing of workflows, which also addresses reproducibility in science.
Acknowledgments
S.K. and D.B. acknowledge funding from NIST 70NANB14H191 for this work. D.B. also acknowledges funding from NSF-IGERT Award 1258425. A.C. acknowledges funding from AFOSR Award FA9550–12–1-0458. A.B. acknowledges support from the GT-IDEAS project and GT-IMat for the MATIN development.
Disclaimer
No approval or endorsement of any commercial product by NIST is intended or implied. Certain commercial software systems are identified in this article to facilitate understanding. Such identification does not imply that these software systems are necessarily the best available for the purpose.