I. INTRODUCTION
The wireless communications market has exploded in the last 10 years. But current communication applications still rely on mechanical antennas that do not offer the compactness that is required for future market needs, unlike active phased array antennas (APAA). The development of such agile devices has reached a whole new level concerning designs, modeling, and agility. Indeed, these agile antennas have large advantages, such as an extremely fast scanning rate or the ability to produce multiple agile beams [Reference Hommel and Feldle1]. Designing such systems requires simultaneously taking into account the active and electromagnetic (EM) aspects in order to model them correctly. Therefore, in the framework of an agile antenna application, where the direction angles for the array are controlled by electronically modifying the weights (phases and magnitudes) of each antenna, an accurate CAD (Computer Aided Design) tool is needed for each component (i.e. antennas and PAs), in order to analyze each constitutive element.
PAs and antennas have a severe impact on overall performances since the first ones directly impact the gain (AMAM) and phase (AMPM) controls of each radiating element, degrading the array efficiency and its radiation performance. The second ones, due to the mutual coupling between antennas, induce mismatching effects (deviation from the optimum load impedance), which directly affect PA behavior, reducing the maximum power delivered to the antenna and considerably changing PA linearity [Reference Lee2, Reference Nielsen and Lindfors3]. This mismatching may lead to large voltage standing wave ratio (VSWR) (up to 4:1), and such occurrences cannot be tolerated, regardless of the reconfigurable system.
In order to maintain PA linearity (operating point), an isolator can be used between the antenna and the PA to dissipate reflected power and prevent the PA from saturating. However, APAA design constraints and space limitations have led to the elimination of the isolator and consequently to the development of power amplifiers which can safely withstand large output mismatch [4].
In this article, we describe a very interesting approach to mixed simulation between PA and antennas. It is useful to have simulation models of separated circuit blocks to ensure that overall performance will meet requirements in given worst-case conditions. Therefore, a very efficient simulation tool is needed for each component. This article focuses on the development of a particular PA model that combines accuracy, stability, and fastness in order to quantify its impact on TX-chains. In addition, a specific tool dedicated to EM analysis was developed in order to particularly address the problem of mismatching between passive (antennas) and active (PA) elements, without use of an isolator or pre-distortion adaptive methods. Then, this EM macro-model was virtually integrated and its’ calculated matching impedances used instead of antennas to define load impedances of PA, in order to optimize performances of the global system.
Section II briefly reviews the EM array macro-model formulation and show some simulated results in the case of varying antenna loads, and particularly their impact on the radiation pattern. In Section III, we describe the PA behavioral model, based on the mathematical formalism of nonlinear scattering functions, the extraction procedure, and some validation results. A first-order model was discussed in [Reference Zakka El Nashef5] and found not to be appropriate for VSWR up to 4:1, due to the limitations of a first-order Taylor series development. A second-order model was needed to overcome these limitations and improve the model's accuracy. We should mention that the development of Taylor series to the second order has been addressed in [Reference Zakka El Nashef6, Reference Zakka El Nashef7]; however, the model showed some instabilities whereas working with large mismatching (VSWR ≥4:1) due to quadratic variations of ã 2 which are related to impedances positions on Smith chart. Therefore, some adjustments were required, such as the choice of extraction impedances on the Smith chart in order to find the corresponding four waves and to overcome these drawbacks. Various results are given to illustrate the predictive capabilities and efficiency of the second-order model. Moreover, two comparisons were made, one between the second-order model using an arbitrary number of impedances to extract non-linear scattering matrix and the same model using a specific configuration of impedances. The second comparison was made between the developed model and the first-order model, showing that the second-order model is more accurate. In Section V, a first approach of system simulation is evaluated by comparison with several loading impedances obtained from the EM array macro-model. Those calculated impedances were used and measured as output loads for the PA. This study will thus enable us to predict and analyze the impact of microwave components on system performances, especially on the problem of mismatching between antennas and PAs. Conclusions are given in Section VI.
II. EM MACRO-MODEL FOR ACTIVE ARRAY SYNTHESIS
A) Theoretical concept
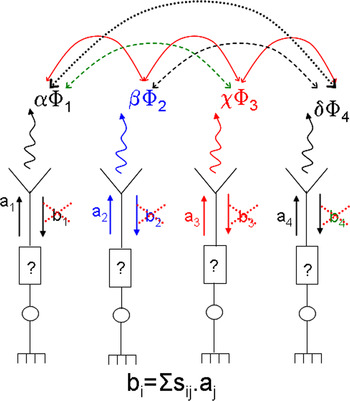
Within an array, each antenna undergoes interactions with other antennas, which modify its properties in terms of input impedance and radiation pattern. Basically, these interactions are related to mutual coupling between antennas (Fig. 1). Thus, due to this mutual coupling, the antenna impedances are not equal to 50 Ω and vary with pointing angle and frequency [Reference Pozar8], which will affect system performances and lead to mismatching. This mutual coupling has a strong influence on the PA in terms of gain (AMAM) and phase (AMPM). As a result, the necessary weights, i.e. the weighted power waves, applied to each antenna on the array to obtain a given pointing direction will be also modified once fed to the PA (b i ≠ o, Fig. 1), degrading array efficiency and its radiation performance.
Antenna's mutual coupling.

Therefore, an array macro-model must be established, which uses frequency and pointing angle as inputs. The macro-model will have an output, for each array element, the matching impedance (≠50 Ω) as well as the feeding weights (the weighted power waves in terms of magnitude and phase) needed to achieve the desired radiation pattern. When these conditions are fulfilled correctly, the coupled power (b i), as shown in Fig. 1, is almost equal to zero and will not disturb the array or PA functioning. Moreover, the whole incident power is transmitted to the antennas and radiation efficiency is maximized. This constitutes the originality of this EM array macro-model, in addition to the possibility of examining the influence of pointing angle and frequency on matching impedances of the antennas, while taking into account the strong interactions between the radiating elements.
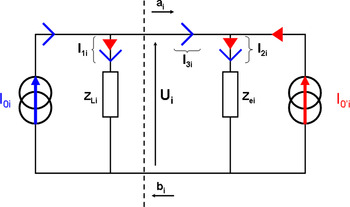
Accordingly, in order to establish a simple model including the mutual coupling phenomena, the following equivalent electric diagram was considered for an antenna within an array (Fig. 2): I 0i and Z Li represent the current supply and its matching impedance, Z ei is the equivalent impedance of the antenna, and I 0′i represents the coupling induced by the radiation of other elements [Reference El Sayed Ahmad, Thévenot, Menudier, Koubeissi, Arnaud and Monedière9–Reference Zakka El Nashef11]. We should note that Z Li = Z ei*, allowing the matching at antennas input.
Antenna electrical model.

The first step is a full-wave EM analysis of the array (using CST Microwave Studio). This computation has to be run only once for a given array, as it is used to characterize each individual port (Z Li) of the structure. The ports are successively supplied with a normalized incident wave “a i” in order to extract their individual radiation pattern (called “active element pattern”) [Reference Pozar12] and their scattering matrix [S c].
The second step consists of finding the complex coefficients (weights) for each antenna, in order to obtain the desired array radiation pattern using the best combination of N-active radiation patterns. SARA array synthesis software [Reference Mouhamadou, Fadlallah, Vaudon and Rammal13] was used to determine the optimal corresponding weights:

The objective radiation pattern ϕ obj can be efficiently obtained by combining the array factor with the transfer function of the antenna array. Coefficients β 1,…, N are the elements of the weighting vector (beamforming vector) needed to achieve the desired radiation pattern, which are defined by an optimization software “SARA”, and vectors ϕ i are the active element patterns containing the EM fields E i(θ, φ).
The third step is to develop a MATLAB routine, associated with SARA, in order to determine the driven voltages [U] (2) and currents [I] (3) based on the extracted scattering matrix [S c] and the superposition theorem. The following equation (2) takes into account the mutual coupling between antennas [Reference El Sayed Ahmad, Thévenot, Menudier, Koubeissi, Arnaud and Monedière9]:

where matrixes [a] and [Z L] are, respectively, the weighted input power waves and port impedances that are calculated by the MATLAB routine and used to supply each antenna during EM analysis of the array structure in order to fit the defined objective radiation ϕ obj (1).  denotes the square root of each matrix element. Currents can be calculated using (3) and coupling coefficients [α] (transconductance) using (4):

and using (2) [Reference El Sayed Ahmad, Thévenot, Menudier, Koubeissi, Arnaud and Monedière9],
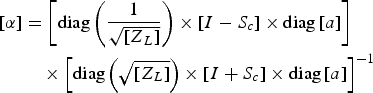
As already mentioned, mutual coupling directly affects input impedances. They depend on both the coupling matrix [S c] and currents that are needed to supply the ports, and are noted as the active impedances (Z active):

Referring to (3) and (4), (5) takes the following form:

The final step is to calculate the corresponding new input power waves using Z active in order to optimize radiation efficiency, while taking into account optimal matching  , which ensures a full adaptation at each antenna input (the reflected waves are almost null). In addition, the calculated [β] “beamforming vector” obtained from SARA is used to calculate U i (Fig. 2). The optimized input weights are given in (7):
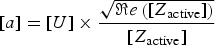
To avoid confusion, it should be noticed that the input power waves [a] feeding the [Z active] impedances will lead to the natural build up of the aimed weighting vector [β], thus leading to the desired radiation pattern and optimizing the radiation efficiency of the array in terms of directivity, gain and side lobe level. Moreover, as mentioned briefly before, if the calculated values in (6) and (7) are fed to each access of the antennas, the reflected power waves (b i) are almost null and do not disturb the behavior of the component placed behind the antennas (the PA in our case), and the incident power is transmitted completely to the antennas. Thus, this macro-model, accounting for the mutual coupling between antennas, enables us to obtain the matching impedance (Z active) presented by each element of the array, and the necessary weighted power waves (a i), according to frequency (f 0) and pointing angle.
The next paragraph focuses on the effects of deviation from optimum loads (50 Ω) on the radiation pattern. Some simulated validations are presented as well, showing how the macro-model is practical, efficient and useful.
B) Numerical validation
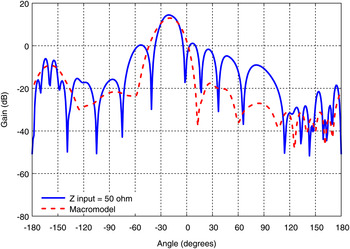
The macro-model described above was validated through a numerical design of an eight-patch linear array. In order to observe the mutual coupling influence on the matching impedances of the array and on its radiation pattern as well, we increased the mutual coupling by reducing the array's inter-element spacing to 0.4λ 0 (f 0 = 8.2 GHz). The structure was designed to radiate with a single lobe in any direction between −40° and +40°. A first evaluation was done in order to show the influence of the calculated active impedances obtained from the macro-model on the radiation pattern in a given pointing direction (−20°), and is shown in Fig. 3. These active impedances were calculated without applying any optimization on the beamforming vector [β].
Influence of Z active on the radiation pattern.

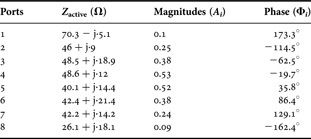
Fig. 3 shows that the calculated impedances (≠50 Ω) have a minor effect on the array radiation pattern of the whole structure. However, the results will be optimal if combined with their corresponding weighted power waves. Table 1 presents the calculated input impedances and weighted power waves [a] (a i = A i exp(jϕ i)) for the considered 1 × 8 array with a −20° pointing angle, and the Z active values, being quite different from 50 Ω, demonstrate the influence of the mutual coupling.
Calculated input impedances and optimized weights for each antenna in the array (θ = −20°).
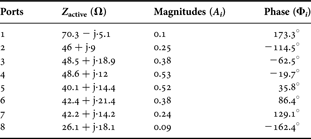
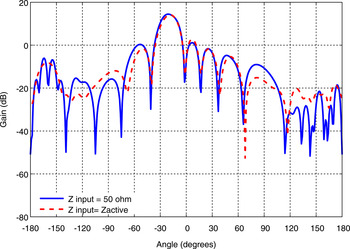
In the next step, the macro-model will be validated numerically by fulfilling both conditions, which are the use of the calculated impedances with their corresponding weighted power waves. Fig. 4 presents the radiation patterns of a 1 × 8 patch array (d = 0.4λ 0) pointing at −20°. The combination of the matching impedances (Z active) and optimized weighted power waves shown in Table 1 is represented by a dashed red line. The normal combination with normalized impedances (50 Ω) is represented by a blue line.
Radiation pattern (−20°) comparison. Blue line results were obtained by a normal combination (Zinput = 50 Ω). Dashed red line results were obtained from a simulation using the macro-model calculated data.

We noticed a remarkable enhancement of the radiation pattern. The main lobe offset was larger, the side lobe levels were minimized and the pointing angle was maintained. These simulated results prove the efficiency and strength of the macro-model.
In conclusion, this macro-model can not only provide the array's matching impedances and feeding power waves, but can also be used as a synthesis tool for beamforming. Moreover, it can also be integrated in a circuit simulation tool (Advanced Design Systems (ADS)) in order to study global interactions between antennas and PA. A first approach will be shown later in Section IV. However, the next section discusses the aim of this article which is an extended behavioral model for power amplifiers, based on the poly-harmonic distortion (PHD) model [Reference Root, Verspecht, Sharrit, Wood and Cognata14].
III. PA BEHAVIORAL MODEL
A) Model formulation
Over the past few years, several behavioral models have been proposed, in order to predict memory effects [Reference Soury, N'Goya and Nebus15, Reference Mazière, Soury, N'Goya and Nebus16] or thermal effects [Reference Boumaiza, Gauthier and Ghannouchi17]. However, these models were unilateral, and only dedicated to data flow (DF) simulators. More recently, efficient bilateral models have been developed [Reference Root, Verspecht, Sharrit, Wood and Cognata14], using the large signal S parameter formalism based on nonlinear scattering functions [Reference David, Jan, David, John and Alex18].
The behavioral model, discussed in this article, is a second-order extension of that presented in [Reference Zakka El Nashef5, Reference David, Jan, David, John and Alex18], and which can be written as follows:

where  are the nonlinear scattering functions.
We see in this case that the non-linear mappings depend only on a single real variable  . All the other incident wave dependences are linear. This simplified form enables simple characterization and direct identification. The S and T terms allow the model to predict component behavior for small to moderate mismatches (VSWR = 3:1) at port 2 at the fundamental frequency [Reference Zakka El Nashef5].
Unfortunately, the model was not accurate enough when working with large VSWR (VSWR = 4:1) [Reference Zakka El Nashef5]. Therefore, we expanded the bilateral model to a second-order Taylor development and, as explained in [Reference Zakka El Nashef7], (8) becomes:
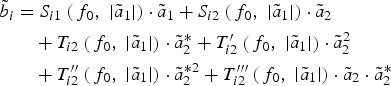
Equation (9) adds six additional quadratic terms (characterizing non-linearity) to (8), which provides more robust model extrapolation properties and increases the predictive capacities of the model for high VSWR.
Note that model (9) is a second-order equation of output reflected wave  . This apparently seems to violate the well-known constraint of band-pass system models that requires the model to involve only odd-order terms. In fact we need to keep in mind that the S parameter model is a two-variant function; hence the power order of each term in (9) accounts for both variables
 and
 . Each apparently second-order term in (9) involves a scattering parameter,
 , that is a function of input incident wave. This function which is not explicitly defined as a polynomial in the equation here will automatically adjust itself as an odd-order function of
 in the extraction process to compensate for even order in
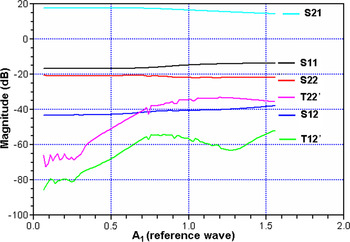
 . Hence, net expansion order will always be an odd number. In order to enforce odd-order model conditions, the corresponding scattering parameters can be fitted with odd-order polynomials upon the extraction process. To illustrate the above statement, Fig. 5 shows a plot of extracted non-linear scattering parameters. For instance, we may see that quadratic order terms
 and
 tend to zero as
 approaches zero in order not to violate the band-pass system constraint.
Non-linear extracted parameters.

B) Measurement and extraction procedures
A commercially available PA was chosen to demonstrate the capability of the extended second-order model for arbitrary impedances chosen for VSWR up to 4:1. The characterized device was an 8–14 GHz 27 dBm PA from NEXTEC-RF (NB00422), and no electrical model was provided by the manufacturer. The S and T parameters were measured at the operating frequency of the antenna arrays (8.2 GHz), using a load-pull measurement setup [Reference Reveyrand, Gasseling, Barataud, Mons and Nébus19], which enables PA characterization driven by RF modulated signals (CW measurement at the operating frequency). Incident ( ) and reflected (
 ) waves at both ports of the device under test were measured using a vector network analyzer (VNA).
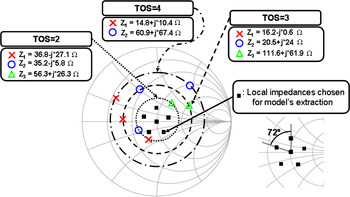
In the case of first-order Taylor development, three load impedances having an orthogonal position on the Smith chart and corresponding to a low mismatching (VSWR ≤ 1.6) are sufficient to solve (8) at different input powers. In the case of second-order Taylor expansion, 12 parameters in (9), instead of six, need to be extracted. The extraction was carried out by measuring the four power waves with six distinct impedances in order to solve the system. The selected impedances in this case were no longer orthogonally located. The first measured impedance was the Smith chart center and the five other impedances were selected on a constant VSWR circle with an argument of 72° compared with the previous one (Fig. 6).
Different load impedances chosen to extract and validate the model.

The selected configuration is well suited for the system identification, and these values are chosen in order to evenly cover a large surface [Reference Zakka El Nashef5, Reference Reveyrand, Gasseling, Barataud, Mons and Nébus19], which will reduce the gain error in magnitude and phase (optimum loads selection). The main reason is the sensitivity of the extracted matrix to measurement noise. This is easily understood when looking at an extreme case where the six points would be nearly linear. In that case, any noise causes large deviations in the solution.
The selected VSWR was between 1.3 and 1.6, higher values leading to unstable system resolution. Depending on the available data, we needed an optimization algorithm (least square minimization) in order to determine the corresponding incident and reflected waves.
Through these measurements, we will be able to determine the extracted S and T coefficients with a simple algorithm, at each power level for the operating frequency. Calculated values of S and T at each power give complete and accurate information about the PA electrical behavior, enabling us to accurately model the AMAM and AMPM transfer characteristics of the PA.
IV. NUMERICAL/EXPERIMENTAL VALIDATION
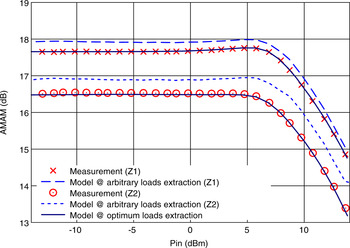
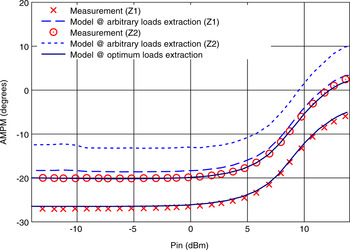
First comparison was made between optimum loads extraction technique used in this article to calculate nonlinear scattering parameters, and arbitrary loads extraction technique used in [Reference Zakka El Nashef6], which depended on all impedances to perform extraction. Figures 7 and 8 show the AMAM and AMPM for several impedances on different VSWR (Z 1 and Z 2 do not correspond to the chosen impedances for extraction), demonstrating the efficiency of the optimum loads selection.
Fundamental gain compression (AMAM) versus input power for several impedances (Z 1 = 37.3 + j·21.1 Ω, Z 2 = 16.5 − j·7.5 Ω). Arbitrary loads extraction (blue symbols) and optimum loads extraction (lines) compared with load pull measurement (red symbols).

Fundamental phase variation (AMPM) versus input power for several impedances (Z 1 = 37.3 + j·21.1 Ω, Z 2 = 16.5 − j·7.5 Ω). Arbitrary load extraction (blue symbols) and optimum load extraction (lines) compared with load pull measurement (red symbols).

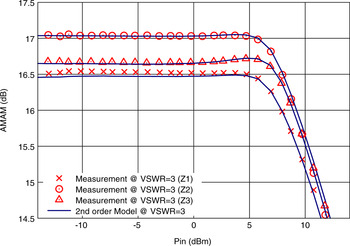
In order to verify the validity of the model, other experiments for different loads (VSWR = 2:1 and VSWR = 3:1) were performed.
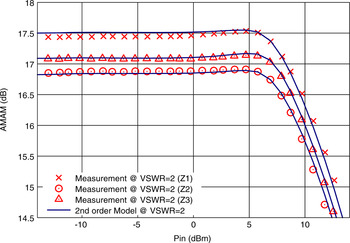
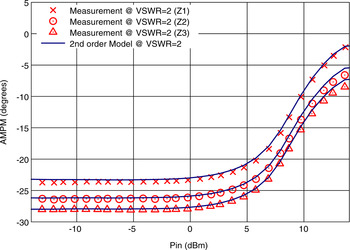
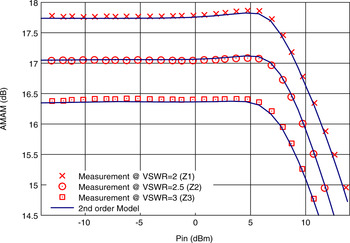
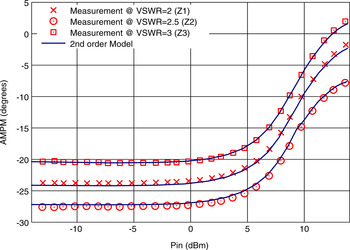
Figures 9–12 show the AMAM and AMPM for several chosen impedances on each VSWR, demonstrating the prediction capability and accuracy of the PA's second-order model to take into account moderate VSWR up to 3:1.
Fundamental gain compression (AMAM) versus input power for several impedances (Z 1 = 36.8 − j·27.1 Ω, Z 2 = 35.2 − j·5.8 Ω, Z 3 = 56.3 + j·26.3 Ω) for VSWR = 2:1 circle. Second-order model (lines) compared with load pull measurement (symbols).

Fundamental phase variation (AMPM) versus input power for several impedances (Z 1 = 36.8 − j·27.1 Ω, Z 2 = 35.2 − j·5.8 Ω, Z 3 = 56.3 + j·26.3 Ω) for VSWR = 2:1 circle. Second-order model (lines) compared with load pull measurement (symbols)

Fundamental gain compression (AMAM) versus input power for several impedances (Z 1 = 16.2 − j·0.6 Ω, Z 2 = 20.5 + j·24 Ω, Z 3 = 111.6 + j·61.9 Ω) for VSWR = 3:1 circle. Second-order model (lines) compared with load pull measurement (symbols).

Fundamental phase variation (AMPM) versus input power for several impedances (Z 1 = 16.2 − j·0.6 Ω, Z 2 = 20.5 + j·24 Ω, Z 3 = 111.6 + j·61.9 Ω) for VSWR = 3:1 circle. Second-order model (lines) compared with load pull measurement (symbols).

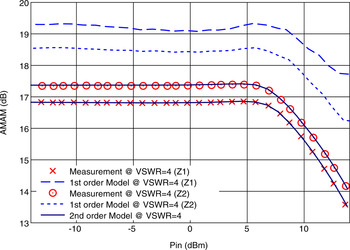
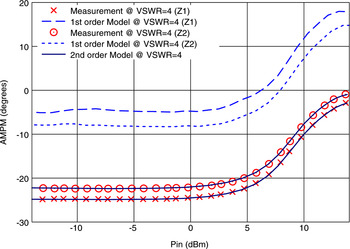
Figures 9–12 show good agreement between the model and measurements, proving that the model predictions for VSWR up to 3:1 are quite robust, all the more so since the model parameters have been extracted using measurements performed at moderate VSWR (1.3–1.6). This second-order model still provides an excellent prediction for larger VSWR: Figures 13 and 14 give the AMAM and AMPM for some impedances for VSWR = 4:1, and a comparison between the first- and second-order model is presented, showing the limitations of the first-order model on large VSWR, as discussed in [Reference Zakka El Nashef5, Reference Reveyrand, Gasseling, Barataud, Mons and Nébus19].
Fundamental gain compression (AMAM) versus input power for several impedances (Z 1 = 14.8 + j·10.4 Ω, Z 2 = 60.9 + j·67.4 Ω) for VSWR = 4:1 circle. First-order model (blue symbols) and second-order model (lines) compared with load pull measurement (red symbols).

Fundamental phase variation (AMPM) versus input power for several impedances (Z 1 = 14.8 + j·10.4 Ω, Z 2 = 60.9 + j·67.4 Ω) for VSWR = 4:1 circle. First-order model (blue symbols) and second-order model (lines) compared with load pull measurement (red symbols).

Figures 13 and 14 show an enormous degradation between measurement and the first-order model predictions, due to the limitation of Taylor series development to the first order. However, the second-order model showed a remarkably great accuracy between the measurement and the model, indicating that further development of the Taylor series was needed to improve the accuracy and to take into account large VSWR (i.e. VSWR = 4:1).
V. FIRST APPROACH VALIDATION FOR SYSTEM SIMULATION
To include the effect of antenna mismatch and study their influence on PA behavior, a first approach was performed using the calculated impedances obtained from the previously mentioned EM array macro-model, which were used to define the load impedances of the PA. Therefore, three different impedances calculated by the macro-model were chosen for different levels of VSWR and used as loads for the second-order model. PA measurements with corresponding impedances are shown to compare and evaluate the possible interactions between PA and antennas. We should note that the calculated impedances of the array do not exceed the boundaries of VSWR = 3:1, even for high angles of pointing (i.e. θ = +40°).
Figures 15 and 16 show the AMAM and AMPM for the measured impedances, compared the second-order model loaded with the EM array macro-model calculated impedances.
Fundamental gain compression (AMAM) versus input power for EM array macro-model calculated impedances (Z 1 = 32.2 + j·22.6 Ω, Z 2 = 24.4 + j·21.6 Ω, Z 3 = 65.7 − j·62 Ω). Model (lines) compared with load pull measurement (symbols).

Fundamental phase variation (AMPM) versus input power for EM array macro-model calculated impedances (Z 1 = 32.2 + j·22.6 Ω, Z 2 = 24.4 + j·21.6 Ω, Z 3 = 65.7 − j·62 Ω). Model (lines) compared with load pull measurement (symbols).

Figures 15 and 16 show strong agreement between the model and measurement. These results present a first approach for coupling both simulation tools, which indicate the predictive ability of the PA model at system level to provide an efficient and accurate response. As a result, the knowledge (through the PA behavioral model) of AMAM and AMPM characteristics for a given load (through the EM array macro-model) will then allow correction of the weighted power waves applied to the array, in order to cancel the influence of the PA feeding unmatched antennas and finally obtain the desired radiation pattern.
VI. CONCLUSION
At the beginning of this article, we briefly presented the EM array macro-model taking into account the mutual coupling between antennas and providing the input impedances and feeding power waves that optimize antenna efficiency, whereas an objective radiation pattern is obtained. Moreover, this EM array macro-model can be used as a global synthesis tool, but as well as a modeling tool to analyze the mismatching effects on active circuits in the case of application to agile arrays. For this purpose, a non-linear modeling approach for PA was developed and presented here. This approach, based on the PHD model, takes into account mismatching effects applied to a PA. It allows a good prediction of a PA's behavior in the case of a large output loading mismatch (up to VSWR = 4:1) and, most of all, establishes predictive performances in agile array applications.
In addition, we demonstrated that the first-order model was not efficient enough for impedances for VSWR ≥ 3:1, and extended the Taylor series development to the second order which was necessary to improve the accuracy and take into account large VSWR (i.e. VSWR ≥ 3:1).
Finally, this first approach of mixed simulation provides an accurate solution to new design verification capabilities for agile antenna applications. Our perspective will be to integrate the global mixed simulation approach into Agilent's ADS tool in order to achieve robust, accurate and useful simulations of distortion for bilateral communication between amplifiers and antennas. Once the two models have been integrated into Agilent's ADS, an experimental prototype (TX chain) will be realized to validate the theoretical concept. We should note that no isolators between the PA and the antennas will be used due to the developed EM model that enables us to obtain a reflected power wave (b i) almost equal to zero, which will neither disturb the array nor the PA functioning.
ACKNOWLEDGEMENTS
This work was realized within the framework of ‘Lypsis project’, labeled by Elopsys cluster (competitiveness cluster for high technologies in Limousin France – http://www.elopsys.fr), and supported by the French “Direction Générale des Entreprises”.
 Georges Zakka El Nashef was born in Saida, Lebanon, in 1984. He received the Ph.D. degree from the University of Limoges, France, in 2010. He is currently a Post-Doctoral Scientist with XLIM laboratory at University of Limoges. His main research interests include electromagnetic/RF circuit interactions modeling, design of active antennas, passive antennas, and power amplifiers.
 François Torrès was born in Limoges, France, in 1963. He received the Ph.D. degree from the University of Limoges, Limoges, in 1991. Since 1986, he has been with the Electromagnetic Department, XLIM institute (formerly the IRCOM laboratory), University of Limoges. He joined the C.N.R.S. in 1993. His current research interests include EM analysis of antennas and arrays, numerical simulation in EMC, and electromagnetic/RF circuit interactions modeling.
 Sébastien MONS was born in Limoges (France) in 1970. He received the Ph.D. degree in Electronics from the University of Limoges in 1999. He joined the Microwave Laboratory of the CNES of Toulouse, France, in 1999. Since October 2001, he is a researcher of the French CNRS at XLIM institute, Limoges University. His main research interests include system level modeling and nonlinear analysis of microwaves circuits.
 Tibault Reveyrand was born in Paris, France, on September 20, 1974. He received the Ph.D. degree from the University of Limoges, France, in 2002. From 2002 to 2004, he was a Post-Doctoral Scientist with the Centre National d'Etudes Spatiales (CNES) (French Space Agency). In 2005, he became a CNRS Engineer at XLIM (formerly the IRCOM), Limoges, France. His research interests include the characterization and modeling of RF and microwave nonlinear components. Dr. Reveyrand was the recipient of the 2002 European GaAs Best Paper Award and is a member of the IEEE MTT-11 “Microwave Measurements” technical committee.
 Edouard N. Goya received the Ph.D. degree in electronics from the University of Limoges, Limoges, France, in 1988. In 1990, he joined the French Centre National de la Recherche Scientifique (CNRS), XLIM (formerly IRCOM laboratory). He is the inventor of key analogue simulation and modeling technologies such as compressed transient, ET, and dynamic Volterra series. Since 1998, he has been the Consultant Chief Scientist with Xpedion Design Systems, Milpitas, CA. His current research activities focus on modeling and simulation techniques for large-scale integration RF circuits, RF system-on-chip (SOC) and system-in-package (SIP).
 Thierry Monédière was born in 1964 in Tulle (France). He obtained his Ph.D. in 1990 in the IRCOM laboratory of the University of Limoges. He is actually Professor in the University of Limoges and he develops his research activities in the XLIM laboratory. He works on multifunction antennas, EBG antennas, and also active antennas. He is also in charge of the Wave and Associated Systems department of the XLIM laboratory.
 Marc Thévenot was born in Limoges, France, in February 1971. He received the BS and M.Sc. degrees in Microwaves from the University of Limoges, France, in 1995. He received his Ph.D. degree in Electronics from the University of Limoges in 1999. He joined the CNRS in 2001. His current research interests are in microwave electromagnetism. These studies are applied to the antenna domain and the EBG materials for microwave. He is also in charge of the multifunction antenna activities of the Wave and Associated Systems department of the XLIM laboratory.
 Raymond Quéré (Fellow IEEE) was born in 1954 in St Brieuc (France). He received the electrical engineering degree from ENSEEIHT Toulouse, France in 1976 and the French “agrégation” in applied physics in 1978. He prepared and earned a Ph.D. degree (with honors) from University of Limoges in 1989. In 1992 he was appointed full professor at the University of Limoges. From 1992 to 1997 he headed the department of Electrical Engineering at the Institute of Technology of the University of Limoges. Since 1998 he leads the nonlinear high frequency devices, circuits and systems research department at XLIM-CNRS laboratory. His main field of interest is in the area of nonlinear device and circuit modeling with a particular emphasis on nonlinear phenomena such as stability in power amplifiers. He was the co-author of the book “Nonlinear Stability of Nonlinear Microwave Circuits”. Moreover he is involved in a number of technical program committees and serves as a reviewer for several journals such as Electronic Letters, IEEE transactions on MTT, etc. In 2005, he was appointed as the general Chairman of the European Microwave Week in Paris.