Mozzarella cheese is a member of the pasta filata (stretched curd) cheese family that originated in Italy. A unique cooking and stretching treatment of acid-ripened curd at optimal pH in hot water, which imparts a fibrous structure with superb melting and stretching properties, distinguishes this cheese. Two types of mozzarella are produced, based on its moisture content (US-FDA, 1989). In particular, ‘low moisture’ (LM) mozzarella cheese (moisture 45–52%) is usually utilised for pizza toppings or as an ingredient in other recipes, whereas ‘high moisture’ (HM) mozzarella cheese (moisture 52–60%), making up most of the Italian mozzarella export, is usually consumed fresh as a table cheese (Gammariello et al. Reference Gammariello, Di Giulio, Conte and Del Nobile2008; Conte et al. Reference Conte, Gammariello, Di Giulio, Attanasio and Del Nobile2009; Del Nobile et al. Reference Del Nobile, Gammariello, Conte and Attanasio2009). HM mozzarella cheese is packaged in a governing liquid mainly composed of tap water, brine and whey. This preserves the soft-springy texture and high amounts of expressible serum in fresh produced HM mozzarella during storage at 4 °C over 10–12 d. However, dipping into the governing liquid can increase microbial loads and turbidity over the storage time. For this reason the shelf life of the product under brine is very short, approximately from 5 to 7 d (Altieri et al. Reference Altieri, Scrocco, Sinigaglia and Del Nobile2005) due to the chemical, biochemical, and physical changes determined by foodborne spoilage microorganisms and enzymes. It is well known that as a consequence of each change some alterations in the product can occur at the sensory and nutritional level, depreciating its commercial value (Bishop & White, Reference Bishop and White1986; Byrne & Bishop, Reference Byrne, Bishop, Marth and Steele1998; Del Nobile et al. Reference Del Nobile, Gammariello, Conte and Attanasio2009).
Extending the shelf life of mozzarella cheese is an important issue to the dairy industry, due to the high interest in extending the distribution of traditional products beyond market borders. The main approaches to maintain the food product quality for more time are based on raw materials quality improvement, on making process innovations, and on the use of suitable storage conditions (Farkye et al. Reference Farkye, Kiely, Allshouse and Kindstedt1991; Kindstedt, Reference Kindstedt1993; Brody, Reference Brody2001; Conte et al. Reference Conte, Gammariello, Di Giulio, Attanasio and Del Nobile2009).
Dairy researchers have been able to better understand how variations in ingredient selection can affect the composition and the functional properties of mozzarella cheese. The influence of ratio of rods to cocci, for example, has been one of the subjects of much interest in the cheese industry because of its effect on proteolytic activity (Yun et al. Reference Yun, Barbano, Kindstedt and Larose1995). The addition of nonfat dry milk has been another attractive option for mozzarella cheese makers to increase the level of nonfat solids of milk (Yun et al. Reference Yun, Barbano, Larose and Kindstedt1998).
Ramkumar et al. (Reference Ramkumar, Creamer, Johnston and Bennett1997) studied the influence of NaCl on the physical properties of cheese, thus showing the capability of NaCl to alter the water-binding properties of casein within cheese matrix. Guo & Kindstedt (Reference Guo and Kindstedt1995, Reference Guo and Kindstedt1996) showed that unsalted blocks of part-skim mozzarella cheese had higher levels of expressible serum than did brined part-skim mozzarella cheese, which suggests that salting of the cheese increases the water-holding capacity of the cheese matrix by increasing the hydration of the casein molecules that make up the cheese matrix.
In addition, Guo & Kindstedt (Reference Guo and Kindstedt1995, Reference Guo and Kindstedt1996) showed that unsalted cheese had larger protein aggregates with free serum existing in small and large pockets within the protein matrix, and salted cheese had a more homogeneous structure with more hydrated proteins.
Taking into account all the above considerations, the objective of the present study was to evaluate the effect of addition of different sodium chloride concentrations during cheese making of mozzarella, in order to assess the impact of salt on the microbiological, sensory and physico-chemical changes that take place during storage.
Materials and Methods
Mozzarella cheese manufacture
The cheeses were produced as reported in a previous paper (Faccia et al. Reference Faccia, Trani and Di Luccia2009). Briefly, raw milk was acidified by addition of citric acid, heated at 35 °C and coagulated by addition of calf rennet; the curd obtained was divided into four parts, which were immediately minced, different levels of NaCl were added and the curd was stretched in hot water. The cheese obtained (round-shaped, 50 g weight) were cooled in pot chilled water for 20 min and packaged in plastic vessels with pot water as covering liquid (50:110 w/v). The four batches of mozzarella were named: NO SALT, S1 (0·23 g), S2 (0·39 g) and S3 (0·71 g).
Chemical, chromatographic and electrophoresis analyses
The measurement of pH was performed on the homogenized mozzarella samples with a pH meter (Crison, Barcelona, Spain); moisture was determined by the International Dairy Federation (IDF) method (1986); fat content was assessed by the Soxhlet method; water soluble nitrogen (WSN) was extracted according to the procedure of Kuchroo & Fox (1982) and quantified, as for total nitrogen, by the Kjeldhal method; NaCl concentration was assessed by the method of Volhard (AOAC, 2000). Each value was an average of measurements recorded on samples from two different batches.
The WSN samples extracted on the same day as cheese production were analysed by reverse phase high performance liquid chromatography (RP-HPLC), using a Waters 600E instrument with diode array detection, at the following conditions: Jupiter RP-C18 column (Phenomenex, 300 Å, 250 × 4·6 mm, Torrance, CA, USA); flow 1 ml/min; eluent A, 0·1% trifluoracetic acid (TFA) in H2O/CH3CN (98/2); eluent B: 0·1% TFA in H2O/CH3CN (30/70); elution gradient from 0 to 80% B in A, in 40 min. The cheeses immediately after production were analysed by urea-PAGE electrophoresis for proteolysis evaluation (Andrews, Reference Andrews1983). The gels were stained with Coomassie Blue G250.
Microbiological analyses
Mozzarella cheese samples (20 g) were aseptically removed from each package, placed in a stomacher bag, diluted with 0·9% NaCl solution and homogenized with a Stomacher LAB Blender 400 (Pbi International, Milan, Italy). Serial dilutions of homogenates were carried out using the same diluent and plated on appropriate media. In particular, mesophilic bacteria, Pseudomonas spp., Enterobacteriaceae, lactic acid bacteria and coccus-shaped LAB were monitored. The media and conditions used are the same as reported in a previous paper (Mastromatteo et al. Reference Mastromatteo, Incoronato, Conte and Del Nobile2011).
The microbial acceptability limit (MAL) (i.e., the storage time at which the viable cell concentration reached the threshold), was calculated as reported by Del Nobile et al. (Reference Del Nobile, Gammariello, Conte and Attanasio2009). The limit of the cfu/g was fixed at 106 cfu/g for Pseudomonas spp. (Bishop & White, Reference Bishop and White1986).
Sensory analysis
Each sample of mozzarella was also tested for sensory properties by a panel consisting of seven trained evaluators. In accordance with the standard UNI 10957 (2003), seven testers of the Food Packaging laboratory were selected on the basis of international standards ISO 8586-1:1993 (Sensory analysis- General guidance for the selection, training and monitoring of assessors-Part 1: Selected assessors) and ISO 8586-2:1994 (Sensory analysis- General guidance for the selection, training and monitoring of assessors-Part 2: Experts). A hedonic scale from 1 to 7 (Corradini & Innocente, Reference Corradini and Innocente2002) was used to quantitatively determine the ‘overall quality’ of the investigated produce. Panelists were asked to base their decision on the sample ‘overall quality’ only taking into account colour, odour, and firmness. Therefore, the samples ‘overall quality’ has to be considered as an average of the above-mentioned sensory attributes (i.e., colour, odour, and firmness) as weighted by the panelist, as also reported in research papers dealing with the same topic (Del Nobile et al. Reference Del Nobile, Gammariello, Conte and Attanasio2009). A score equal to 4 was used as the threshold for produce acceptability. The sensory acceptability limit (i.e., the storage time at which the sensory attribute reaches the threshold), was calculated as reported by Del Nobile et al. (Reference Del Nobile, Gammariello, Conte and Attanasio2009).
Statistical analysis
Data on microbiological and sensory quality were compared by one-way analysis of variance (ANOVA). A Duncan's multiple range test with the option of homogeneous groups (P < 0·05) was used to determine significance between treatments. To this aim, STATISTICA 7.1 for Windows (Stat-Soft, Inc, Tulsa, OK, USA) was used.
Results and Discussion
Chemical, chromatographic and electrophoretic analyses
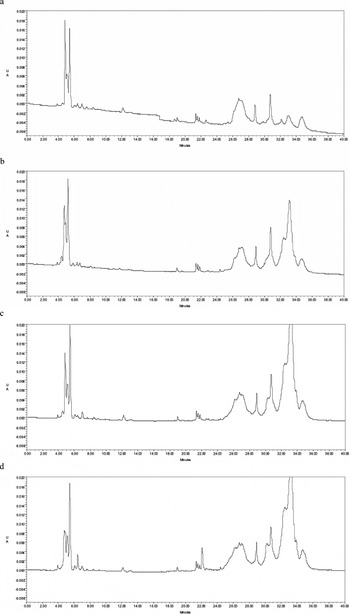
The results reported in Table 1 show that the different amounts of salt added during stretching of the curd produced a set of differently salted cheeses in a range from 0·02 to 0·71 g NaCl%. The fat and protein content was not significantly different between the cheeses, whereas moisture was significantly related to the NaCl concentration, confirming the results reported by Guo and Kindstedt (Reference Guo and Kindstedt1995, Reference Guo and Kindstedt1996). In particular, higher moisture level for the full salted cheese was obtained, which suggests that salting increases the hydration of the casein molecules that make up the cheese matrix. Similarly, the WSN content increased as NaCl increased, and the value observed in the full salted cheese (S3) was more than two times higher than that found in unsalted cheese (S0). Nevertheless, this finding can hardly be considered a consequence of proteolysis, since the extraction of WSN had been performed immediately after cheese production. The chromatographic and electrophoresis analyses give useful information to explain such differences. In particular, the chromatograms of WSN (Fig. 1) show that: (1) the most part of the peaks are very hydrophobic and present the same chromatographic behaviour as caseins or very large casein fragments, being eluted in the correspondence of about 50% acetonitrile (Gonzalez-Llano et al. Reference Gonzalez-Llano, Polo and Ramos1990; Jaubert & Martin, Reference Jaubert and Martin1992; Veloso et al. Reference Veloso, Natercia and Ferreira2002); (2) such hydrophobic compounds strongly increase as salt in cheese increase; (3) only few peaks can be observed in the hydrophilic part of the patterns, where the low molecular weight compounds originating from proteolysis are mainly eluted. From these results, it can be assumed that sodium chloride tends to dissolve casein from cheese matrix, thus determining an ‘apparent’ increase of soluble nitrogen. Such a hypothesis was confirmed by the electrophoretic patterns (not shown) that did not find any relevant difference in casein degradation between the cheeses immediately after production.
HPLC chromatograms of WSN for no salt (a), S1 (b), S2 (c), S3 (d) samples.

Chemical composition of the ‘mozzarella’ cheese samples (g%)

Mean values±sd
a–c Means in the same row followed by different superscript are significantly different (P < 0·05)
† S1: 0·23 g; S2: 0·39; S3: 0·71 g
Microbiological quality decay and pH
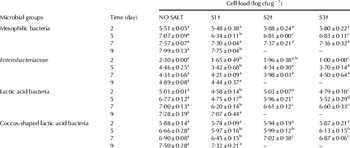
Table 2 reports the cell load evolution during refrigerated storage of different microbial groups for all mozzarella cheese samples. For mesophilic bacteria significant differences (P < 0·05) between samples at 5 d storage were observed. In particular, unsalted mozzarella cheese showed the highest cell load. Moreover, no difference between samples containing the high amount of salt was observed (S2, 0·39 g and S3, 0·71 g of salt). It is worth noting that microbial cell load was monitored until the packed food reached either its microbial or sensory threshold. Bishop & White (Reference Bishop and White1986) stated that a Pseudomonas spp. microbial load equal to 106 cfu/g in cheese could represent an unacceptable contamination level. At the end of storage, significant differences between unsalted and low salt level samples (S1, 0·23 g NaCl) were also observed.
Evolution of different microbial groups for the ‘mozzarella’ cheese samples

Mean values±sd
a–c Means in the same row followed by different superscript are significantly different (P < 0·05)
† S1: 0·23 g; S2: 0·39; S3: 0·71 g
Mozzarella cheese with a high content of salt (S3, 0·71 g of salt) showed the lower cell load of Enterobacteriaceae at 2 d storage respect to the other samples (P < 0·05). However, at the end of storage similar values between samples were reached.
For LAB significant differences (P < 0·05) were also observed during the entire storage period. In particular, for sample with the lowest salt concentration (S1, 0·23 g of salt), a difference of 2 and 1 log cycle at 5 and 7 d, respectively, was observed compared with the unsalted sample. Moreover, unsalted sample differed significantly with respect to the samples containing high salt concentration. At 7 d storage, no significant difference (P > 0·05) between mozzarella cheese samples with 0·39 g (S2) and 0·71 g of salt (S3) were detected. At the end of storage similar values between samples with and without salt were observed.
Mozzarella cheese containing salt differed significantly for coccus-shaped lacLAB cell load compared with the unsalted samples at 5 d storage. Moreover, the S1 samples (0·23 g of salt) showed a lower cell load than the other samples at 7 d, whereas similar cell load values for samples with high salt concentration were observed.
The antimicrobial properties of sodium chloride are generally used for food preservation. The low water activity due to the salt together with temperature and pH, is one of the major parameters that affects the microbial growth (Gutierrez et al. Reference Gutierrez, Abee and Booth1995). The plasmolysis process describes how hyperosmotic shock causes a sudden efflux of water, together with a decrease in the cytoplasmatic volume of the cell (Csonka, Reference Csonka1989).
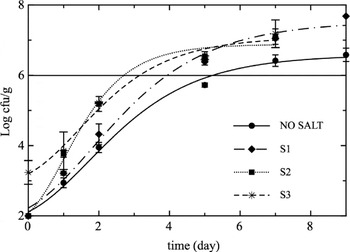
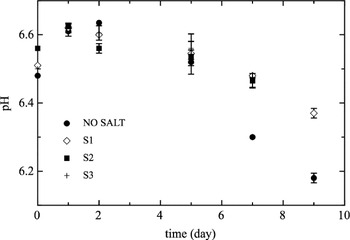
The evolution of Pseudomonas spp. cell load plotted as a function of storage time is shown in Fig. 2. The curves were the best fit to the experimental data, whereas a horizontal solid line represents the viable cell concentration threshold. Figure 2 highlights that, among the tested samples, Pseudomonas spp. cell load of mozzarella cheese with added salt exceeded the threshold earlier than the unsalted sample. In particular, microbial cell load decreased as salt concentration decreased. This was probably due to the low pH values observed in unsalted mozzarella samples (Fig. 3). In fact, the absence of salt caused a high LAB concentration resulting in low pH values. The primary antimicrobial effect of lactic acid is likely to be as an acidulant, lowering the external pH or reducing water activity (Shelef, Reference Shelef1994), thus providing a protective antimicrobial barrier against spoilage microorganisms and food-borne pathogens in dairy products (Schillinger & Lücke, Reference Schillinger and Lücke1990; El-Gazaar et al. Reference El-Gazaar, Bohner and Marth1991).
Evolution of Pseudomonas spp. cell load plotted as a function of storage time for mozzarella cheese samples.

pH evolution of mozzarella cheese samples.

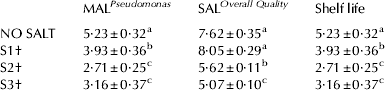
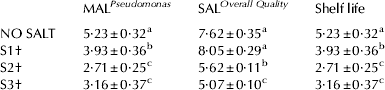
The MALPseudomonas values are listed in Table 3. As can be seen, significant differences (P < 0·05) between samples were obtained. In particular, the presence of salt negatively influenced microbial quality of cheese. In fact, low MALPseudomonas values were obtained with the two highest salt contents (S2, 0·39 g and S3, 0·71 g). A MALPseudomonas value of about 4 and 5 d for samples containing 0·23 g of salt (S1) and those without salt, respectively, was observed.
Shelf life of ‘mozzarella’ samples evaluated on the basis of microbial acceptability limit (MAL) of Pseudomonas spp. (MALPseudomonas) and sensorial acceptability limits (SALOverall Quality)
Mean values±sd
a–c Means in the same row followed by different superscript are significantly different (P < 0·05)
† S1: 0·23 g; S2: 0·39; S3: 0·71 g
Sensory quality decay
Figure 4a shows the evolution during storage of the odour in mozzarella cheese. The score of the odour decreased faster for the cheese samples with high salt level (S2, S3) reaching first the odour threshold value (score 4) compared with the samples with 0·23 g salt and the unsalted mozzarella. Colour attribute did not affect the acceptability of the product; in fact, the colour score was always above the threshold value during all storage time (Fig. 4b). Figure 4c shows the texture evolution for all mozzarella samples. As can be seen, unsalted samples showed a lower initial texture score than the salted samples; however, a constant trend until 7 d was observed. After this period, the firmness slightly decreased. Moreover, the panelists judged the salted sample (S1, S2, S3) with high texture score; but the firmness decreased faster with the increase of the salt content.
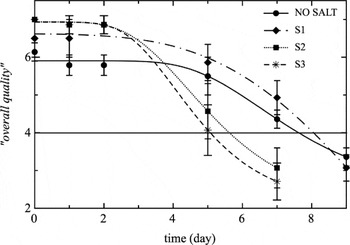
Evolution of odour (a), colour (b), texture (c) and overall quality of mozzarella cheese.

Figure 4d shows the evolution during storage of mozzarella cheese overall quality for all investigated samples. Curves shown in Fig. 4d are the best fit to the experimental data, whereas, the solid horizontal line is the overall quality threshold. As can be inferred from the figure, samples containing high salt content (S2, 0·39 g and S3, 0·71 g) reached the overall quality threshold first compared with sample with 0·23 g of salt (S1) and mozzarella without salt. SAL values determined for mozzarella cheese overall quality (SALOverall Quality) are listed in Table 3. Data highlight that high salt concentration speed up the quality loss of mozzarella during storage. In particular, SALOverall Quality values of about 5·62 and 5·07 d for S2 (0·39 g) and S3 (0·71 g) samples, respectively, were obtained. On the contrary, high SALOverall Quality values for unsalted samples (7·62) and S1 (8·05) samples were obtained.
Shelf life evaluation
Mozzarella shelf life is reported in Table 3 for each sample tested in this study. It was calculated as the lowest value between MALPseudomonas and SALOverall Quality. It can be emphasized from data that microbial quality, in particular Pseudomonas spp. growth, was responsible for product unacceptability, whereas the sensory quality did not limit mozzarella cheese shelf life. In particular, a shelf life value of about 5 and 4 d for unsalted mozzarella cheese and those with 0·23 g of salt (S1), respectively, was reached. On the contrary, high salt concentrations affected product shelf life without significant difference (P > 0·05).
Conclusion
Results of this study suggested that shelf life of mozzarella cheese increased with the decrease of salt concentration. Pseudomonas spp. growth was responsible for product unacceptability, whereas the sensory quality did not limit mozzarella cheese shelf life. In particular, the highest shelf life values were obtained for unsalted mozzarella cheese (about 5 d) and those with the lowest salt concentration (and 4 d). On the contrary, high salt concentrations probably promoted the ‘salting in’ phenomenon that allowed disruption of the cheese casein network with undesired consequence for cheese quality.
This work was financially supported by the Ministero dell'Economia e delle Finanze, dell'Istruzione, dell'Università e della Ricerca Scientifica e Tecnologica by the project Legge 297/99 Art. 12, Title: “Bioinnovazioni per il fiordilatte tipico pugliese”-DM29221.