Introduction
Disease is an extremely crucial stress influencing the crop growth, resulting in crop quality and yield loss. Therefore, disease forecast and management are essential for disease prevention and treatment. In many occasions, diseases could not be detected and treated until the symptoms become visible. With the aid of modern techniques, rapid and accurate detection of crop diseases has been developed and studied.
Sclerotinia stem rot (SSR) is one of the major diseases in oilseed rape to affect plant growth. The disease stress destroys regular physiological activity, and the disease spreads fast within different tissues of the plants. The direct consequence of SSR-infected oilseed rape plants are yield loss and quality loss of rapeseeds.
Vegetation indices are simple and efficient equations using combinations of several wavelengths in the visible and short-wave near-infrared range from spectral information (Vina et al., Reference Vina, Gitelson, Nguy-Robertson and Peng2011). Various vegetation indices have been used for crop diseases monitoring (Ashourloo et al., Reference Ashourloo, Mobasheri and Huete2014). The feasibility to detect crop diseases using vegetation indices has been proved, and the results were not always satisfactory in different situations. Therefore, the robustness and effectiveness of the vegetation indices should be further studied for practical application.
Hyperspectral imaging is a technique integrating both spectroscopy and imaging technique. The advantage of hyperspectral imaging is to acquire spectral and spatial information simultaneously. With the advantage, hyperspectral could analyze the spectral information of the selected regions within the sample. The objective of this study was to detect SSR on oilseed rape leaves using hyperspectral imaging and the vegetation indices of two different sample sets. The specific objective was to evaluate the robustness of vegetation indices and select the sensitive vegetation indices for SSR detection.
Materials and methods
Sample preparation
Two hundred oilseed rape plants (Brassica napus L., cv. ZS758) were used in the experiments.
Two hundred seedlings were transplanted into the experimental pots. When oilseed rape leaves were suitable for Sclerotinia sclerotiorum infection, oilseed rape plants were kept in a controlled environment with the temperature of 20°C and the humidity of 80%. The Sclerotinia sclerotiorum were cultured in a potato agar simultaneously. The mycelial pellets were then put on the leaves, with 2 pellets per leaf. Twenty-four hours later, the mycelial pellets were removed from the leaves. Two experiments were conducted. For the first experiment, the oilseed rape leaves were inoculated with Sclerotinia sclerotiorum, named as Sample set 1. Seventy two hours later, when the symptoms of the leaves became visible, 60 infected leaves and 60 healthy leaves were collected and placed in an icebox to keep the leaves fresh for hyperspectral images acquisition. Seven days later, the second experiment were conducted as the same as the first one, named as Sample set 2.
Hyperspectral system and spectra extraction
A visible and near-infrared hyperspectral imaging system was used in this study. The system was formed by an imaging spectrograph (ImSpector V10E; Spectral Imaging Ltd., Oulu, Finland) covering the spectral range of 384–1034 nm, a CCD camera (C8484-05, Hamamatsu, Hamamatsu City, Japan) with resolution of 672×512 pixels, two 150 W tungsten halogen lamps (Fiber-Lite DC950 Illuminator; Dolan Jenner Industries Inc, Boxborough, MA, USA) and a mobile platform used to move the samples. The leaves were laid flat in the platform for line-scan by the system. The acquired raw hyperspectral images should be corrected to reflectance hyperspectral images for further analysis. The hyperspectral images were segmented by using the gray-scale image at 800 nm to build a mask to isolate the samples from the background. The gray-scale image at 800 nm was processed to a binary image as a mask, where the background was set as 0 and the sample area was set as 1. Then the mask was applied on the gray-scale images at each wavelengths to remove the background. The average spectra of the sample area were then extracted.
Data process
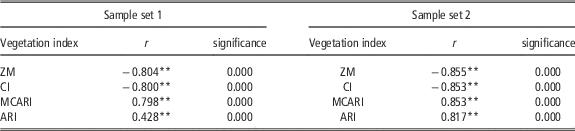
The vegetation indices were calculated from the average spectra of healthy and infected leaves of the two sample sets. In total, 4 vegetation indices were extracted (as shown in Table 1). The vegetation indices of healthy and infected samples were firstly used for correlation analysis and significance analysis. Spearman analysis was used for correlation analysis. Analysis of variance (ANOVA) was used for significance analysis. Significance of differences between vegetation indices of healthy and infected was calculated.
Results of correlation analysis and ANOVA using vegetation indices of healthy and infected oilseed rape leaves

**significant correlated at p=0.01 level.
Linear discriminant analysis (LDA) was applied to evaluate the performance of the individual vegetation index for SSR detection. After evaluation of vegetation indices, LDA, partial least squares-discriminant analysis (PLS-DA) (Zhang et al., Reference Zhang, Wang, Liu and He2016), radial basis function neural network (RBFNN) (Zhang et al., Reference Zhang, Wang, Liu and He2016), support vector machine (SVM) (Zhang et al., Reference Zhang, Wang, Liu and He2016) and extreme learning machine (ELM) (Zhang et al., Reference Zhang, Wang, Liu and He2016) were used to build discriminant models using the optimal vegetation indices. The model performances were evaluated by classification rate of the calibration set and the prediction set. The samples were divided into the calibration and prediction set at the ratio of 2:1, with 80 samples in the calibration set and 40 samples in the prediction set for each sample set.
Results and discussion
Correlation analysis and significance analysis
Four vegetation indices, including ZM (Tian et al., Reference Tian, Yao, Yang, Cao, Hannaway and Zhu2011), chlorophyll index (CI) (Tian et al., Reference Tian, Yao, Yang, Cao, Hannaway and Zhu2011), modified chlorophyll absorption in reflectance index (MCARI) (Mielke et al., Reference Mielke, Schaffer and Schilling2012) and anthocyanin reflectance index (ARI) (Mielke et al., Reference Mielke, Schaffer and Schilling2012) were calculated for the two sample sets. Healthy samples and infected samples were assigned as category value 1 and 2. The results of Spearman correlation analysis and ANOVA of the sample sets are shown in Table 1. For sample set 1 and 2, the four vegetation indices were significantly correlated with the sample status (healthy and infected). All vegetation indices of healthy and infected samples showed significant differences with p value of 0.000 (p<0.01) in the two sample sets. The results indicated that the vegetation indices could be used to differentiate healthy SSR infected leaves.
LDA models using individual vegetation index
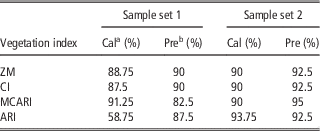
Correlation analysis and ANOVA showed the significant differences between healthy and infected samples. The samples were divided into the calibration set and the prediction set at the ratio of 2:1. LDA models were built using individual vegetation index (Table 2). For sample set 1, LDA models using ZM, CI and MCARI obtained good performances with classification accuracies over 80%. LDA model using ARI performed slightly worse. For sample set 2, LDA models using ZM, CI, MCARI and ARI all obtained good performances. The results showed that the four vegetation indices could all be used for SSR detection on oilseed rape leaves.
LDA models using individual vegetation index

a Cal was the calibration set.
b Pre was the prediction set.
Discriminant models using 4 vegetation indices
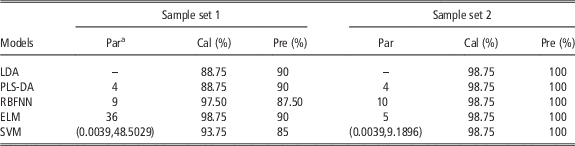
LDA, PLS-DA, RBFNN, SVM and ELM models were built using the combination of the four vegetation indices. The results are shown in Table 3. All discriminant models showed satisfactory results, with classification accuracies equal to or higher than 85%. Discriminant models of sample set using the combined data set showed similar results as the LDA models using individual vegetation index. Discriminant models of sample set 2 using the combined data set showed better results than the LDA models using individual vegetation. Sample sets affected the model performances and the correlation analysis results. The use of two different sample sets explored and validated the feasibility of using vegetation indices for SSR detection, and the effectiveness of the 4 vegetation indices was also compared and studied.
Results of discriminant models using combined vegetation indices

a Par was the parameter of the discriminant models. For PLS-DA, Par was the number of latent variables; for RBFNN, Par was the spread value; for SVM, Par was the penalty coefficient and kernel width of kernel function; for ELM, Par was the number of nodes in the hidden layer.
In this study, each sample set had 120 samples, with 60 healthy and 60 infected samples. The results indicated the feasibility of using vegetation indices to detect SSR on oilseed rape leaves. However, the limited number of samples could not be used to develop robust and accurate models for real-world application. The SSR infected oilseed rape leaves showed different symptoms and inner physiological changes, the limited samples could only cover parts of sample features, which would cause low prediction accuracy. With greater number of samples covering the most of the sample features, the modelling accuracy and robustness could be enhanced.
Conclusions
Four vegetation indices extracted from hyperspectral images of two different sample sets were studied and compared to detect SSR on oilseed rape leaves. Correlation analysis and ANOVA analysis showed the feasibility of discriminating healthy and SSR infected leaves using the four vegetation indices. Discriminant models using individual vegetation index and all indices showed satisfactory results. The overall results showed and validated the feasibility of using the four vegetation indices to detect SSR on oilseed rape leaves in different sample sets.
Acknowledgements
This study was funded by The National Natural Science Foundation of China (31471417), National High-Tech Research and Development Plan (2013AA102405), Specialized Research Fund for the Doctoral Program of Higher Education (20130101110104863).