


Introduction
Progressive taxation is in vogue again. In the aftermath of the global financial crisis of 2008, claims to ‘tax the rich’ have gained publicity (Samuelson, Reference Samuelson2011). Most prominently, US politicians like Alexandria Ocasio-Cortez, Elizabeth Warren, and Bernie Sanders have recently proposed tax hikes on the wealthiest members of society (Casselman and Tankersley, Reference Casselman and Tankersley2019). In addition, the seminal work of scholars like Piketty (Reference Piketty2014) and Atkinson (Reference Atkinson2015) contributed to the post-crisis debate on income and wealth concentration at the top. But – after three decades of downward trends in top personal income tax (PIT) rates (Kemmerling, Reference Kemmerling2010; Genschel and Schwarz, Reference Genschel and Schwarz2011; Swank, Reference Swank2016) – has the crisis really been a game changer?
In this article, I argue that the financial crisis has indeed caused a turnaround in the politics of progressive taxation. Based on recent work that stresses the role of fairness considerations in tax policy-making (Scheve and Stasavage, Reference Scheve and Stasavage2016), I claim that the crisis and states’ reactions to it have violated citizens’ fiscal fairness principles as financial risk-takers were bailed out with public money. Critics of such state actions have characterized them as ‘socialism for the rich’ that privatizes profits and socializes losses (Stiglitz, Reference Stiglitz2015). I expect that, as a consequence, governments in crisis countries have increased taxes on top incomes.
I use a novel data set on top marginal PIT rates for 122 countries from 2006 to 2014 to test my argument empirically. First, I combine matching methods with a difference-in-differences design to identify the causal impact of the financial crisis on top PIT rates. Afterwards, I analyse panel data to compare the effects of fiscal problem pressure on top PIT rates between crisis and non-crisis countries. My results show that countries which have been hit by the financial crisis have increased their top PIT rates by 4 percentage points on average. Thus, the general downward trend in top income tax rates (Ganghof, Reference Ganghof2006b; Kiser and Karceski, Reference Kiser and Karceski2017) has been reversed in countries with a financial crisis. Importantly, we cannot find these differences between crisis and non-crisis countries for regressive consumption taxes. Furthermore, panel models reveal that rising public debt does not lead to higher top PIT rates per se. Public debt only leads to increasing top PIT rates if is induced by the financial crisis. These results support my argument that rising tax rates on the rich are not solely the result of higher revenue needs in crisis countries. Instead, the procedural dimension matters: if countries face fiscal troubles due to the financial crisis, governments increase taxes on the rich to restore fiscal fairness.
The contribution of my article is threefold. First, the article speaks to a growing body of literature that finds new trends in the politics of taxation since the financial crisis (Emmenegger, Reference Emmenegger2015; Hakelberg, Reference Hakelberg2016; Hakelberg and Rixen, Reference Hakelberg and Rixen2018). Whilst most of the literature focuses on the causes and consequences of novel forms of international tax regulation (like the Automatic Exchange of Information (AEOI)), my article adds the domestic dimension to these studies.
Second, my findings show that the financial crisis has had a causal impact on top income tax rates. Financial crises, just like mass wars (Scheve and Stasavage, Reference Scheve and Stasavage2010), can increase taxes on the rich. In the absence of mass warfare, financial crises have the potential to trigger considerations of unequal fiscal treatment. As a consequence, compensatory demands for taxing the rich can still lead to policy change. This is particularly important in the light of recent studies which deal with unequal representation in favour of the rich (Bartels, Reference Bartels2008; Page et al., Reference Page, Bartels and Seawright2013) and the structural power of business on the formation of tax policy preferences (Emmenegger and Marx, Reference Emmenegger and Marx2018). My analysis does not disprove the idea that affluent citizens have a higher influence on tax policy-making. However, the findings show that general compensatory demands still matter for taxing the rich.
Third, this article calls for a more nuanced discussion of fiscal policy responses to the financial crisis. In the comparative political economy literature, much work has dealt with austerity measures in the wake of the Great Recession (Schäfer and Streeck, Reference Schäfer and Streeck2013). Austerity has been identified as a widespread policy response to the crisis (Armingeon et al., Reference Armingeon, Guthmann and Weisstanner2016; Steinebach et al., Reference Steinebach, Knill and Jordana2017). Against this backdrop, my analysis demonstrates that fairness considerations are crucial for fiscal consolidation programmes. Perceived violations of fiscal fairness principles can affect who has to pay for the crisis. Hence, although this study focuses on taxation, it opens up discussions about how fairness considerations might interact with the spending side of public households.
The article is structured as follows. I start by reviewing the literature on taxing the rich with a specific focus on studies that refer to the impact of individual fairness beliefs on tax policies. Afterwards, I develop my argument on fairness claims for progressive taxation in the wake of the financial crisis and present my working hypotheses. In the empirical part, I describe the data set and explain my identification strategy. After presenting and discussing my results, the final section concludes.
Taxing the rich
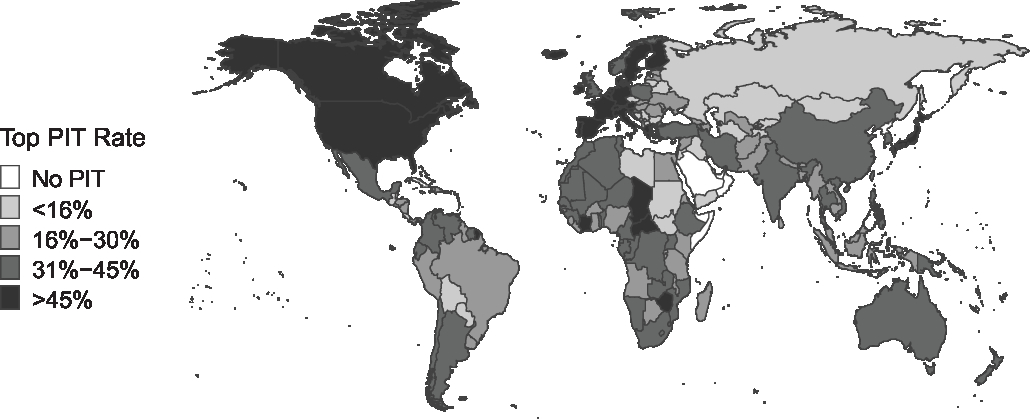
Taxation of the richest members of society shows a huge variation across the world. Figure 1 maps top marginal PIT rates worldwide for the year 2014. Whereas some countries do not tax income at all (e.g. Brunei, Saudi Arabia, and the United Arab Emirates), other countries tax top incomes with marginal rates of more than 45% (e.g. Canada, France, and Japan). In this section, I will give a short overview on three major literature strands that offer explanations for this variation: theories on globalization, domestic institutions, and fairness considerations.
Top marginal PIT rate worldwide in 2014. Data: Own coding.
Studies about the impact of globalization on tax progressivity have been particularly prominent in the political economy literature. The general theoretical expectation is that internationalization and globalization cause decreasing tax progressivity (Ganghof, Reference Ganghof2006b; Kiser and Karceski, Reference Kiser and Karceski2017). We can differentiate between two different versions of the globalization theory. First, globalization might lead to a spread of neoliberal ideas which evaluate progressive taxation as economically inefficient (Swank and Steinmo, Reference Swank and Steinmo2002; Steinmo, Reference Steinmo2003). In their most simple form, these ideas see highly progressive tax systems as a drag on economic growth. Whereas broad-based, single rate taxes like consumption taxes cause only little deadweight loss, a steeply progressive (income) tax system can lead to changes in market behaviour which might create inefficient economic outcomes (Hall and Jorgenson, Reference Hall and Jorgenson1967). This problem can increase with growing budget size (Lindert, Reference Lindert2004). Second, economic globalization can lead to competition between nation states over tax efficiency (Genschel and Schwarz, Reference Genschel and Schwarz2011). Especially in the last four decades, increasing capital mobility due to fewer transnational (financial) restrictions, the expansion of double tax avoidance, and technological advance have led to tax competition between countries. As a consequence, tax rates on capital have been lowered (Ganghof, Reference Ganghof2006b; Franzese and Hays, Reference Franzese and Hays2008; Rixen, Reference Rixen2011). Small states have particularly strong incentives to decrease top tax rates for capital income since initial revenue losses can be compensated by subsequent tax base expansions (Wilson, Reference Wilson1991; Kanbur and Keen, Reference Kanbur and Keen1993; Haufler and Wooton, Reference Haufler and Wooton1999). Because of the so-called ‘backstop function’ of the corporate income tax, competition over low corporate income tax rates also affects the progressivity of the PIT (Ganghof and Genschel, Reference Ganghof and Genschel2008).
Whilst globalization theories look at the impact of worldwide interdependencies, institutional approaches focus on how domestic rules, structures, and norms influence taxation. Domestic institutions can influence tax policy-making in manifold ways (Levi, Reference Levi1988). Based on the assumption that individuals’ tastes for tax policies are solely driven by economic self-interest, the median voter theorem (MVT) expects democratization to lead to an increase in progressive taxation (Meltzer and Richard, Reference Meltzer and Richard1981). However, the straightforward MVT expectation that democratic institutions lead to a higher taxation of the rich is subject to academic debate (Scheve and Stasavage, Reference Scheve and Stasavage2012). Aidt and Jensen (Reference Aidt and Jensen2009) find that democracies are laggards when it comes to the introduction of PITs. Mares and Queralt (Reference Mares and Queralt2015) argue that the role of sectoral elites and the linkage between voting rights and taxation can account for this empirical pattern. In addition, the interplay between landholding inequality, taxation of elites, and democratization has gained huge scholarly interest recently (Acemoglu and Robinson, Reference Acemoglu and Robinson2000; Boix, Reference Boix2003; Ansell and Samuels, Reference Ansell and Samuels2014). Work on the resource curse that deals with the negative impact of natural resource wealth on (income) taxation and democratization is closely related to the taxation and democratization literature (Ross, Reference Ross2001). Since countries that are rich in natural resources do not need to tax their citizens, claims of ‘no taxation without representation’ do not emerge and democratization is unlikely. Amongst democracies, different institutional settings matter as well. For example, Iversen and Soskice (Reference Iversen and Soskice2006) argue that proportional electoral systems cause more redistributive tax and transfer systems than majoritarian systems. Also, the institutional perspective and theories of globalization are not mutually exclusive. For instance, many domestic veto points dampen the negative impact of globalization on tax progressivity (Basinger and Hallerberg, Reference Basinger and Hallerberg2004; Ganghof, Reference Ganghof2006b). Furthermore, autocracies are less participative in tax competition than democracies (Genschel et al., Reference Genschel, Lierse and Seelkopf2016).
In contrast to the global and institutional approaches, fairness-based explanations offer a slightly different perspective on the politics of taxing the rich. In this framework, personal perceptions of socio-economic outcomes as fair are considered to be important for redistribution (Fehr and Schmidt, Reference Fehr and Schmidt1999; Alesina and Angeletos, Reference Alesina and Angeletos2005; Ballard-Rosa et al., Reference Ballard-Rosa, Martin and Scheve2017). If inequality is perceived as unfair, demand for correcting these inequalities will be higher (Tyran and Sausgruber, Reference Tyran and Sausgruber2006; Lü and Scheve, Reference Lü and Scheve2016). This phenomenon is called self-centred inequity aversion.Footnote 1
Most studies have analysed the impact of fairness on progressive taxation (and on redistribution in general) either via formal modelling (Fehr and Schmidt, Reference Fehr and Schmidt1999) or by looking at preferences on the micro level (Fong, Reference Fong2001; Ackert et al., Reference Ackert, Martinez-Vazquez and Rider2007; Durante et al., Reference Durante, Putterman and van der Weele2014). The lack of comparative macro-studies comes as no surprise. In particular, disentangling effects of economic self-interest and effects of self-centred inequity aversion on progressive taxation can be tricky. Most importantly, explaining differences in progressive taxation between countries by arguing that they differ in fairness perceptions needs to address why countries vary in their perception of fairness in the first place. In their historical study on the impact of mass warfare on progressive taxation, Scheve and Stasavage (Reference Scheve and Stasavage2016) try to overcome these problems by taking the procedural dimension into consideration: when procedures are perceived as fair, their outcomes are less likely to be challenged by redistributive taxation. More specifically, the two authors look at whether state’s actions violate the principle of treating citizens as equal. If this is the case, compensatory arguments that aim at restoring the principle of equal treatment will gain power. In other words, fairness-based self-centred inequity aversion will increase. Regarding taxes on the rich, this has been the case during times of mass warfare. As wealthy citizens have a smaller likelihood of fighting in a war and/or gain higher financial profits from war efforts, they enjoy a preferential treatment by the state. Hence, the highly progressive post-war tax systems in the OECD were shaped by the demand to restore fiscal fairness (Scheve and Stasavage, Reference Scheve and Stasavage2010, Reference Scheve and Stasavage2012). Moreover, fairness arguments to tax the rich have lost power in the last four decades due to the absence of mass warfare. However, macro-level studies that look at the impact of fairness arguments in the absence of mass warfare are completely missing. As I argue in the following section, particularly the shock of the 2008 financial crisis and states’ reactions to it have led to a revival of fairness considerations to tax the rich.
Fiscal fairness and taxation after the financial crisis
From the mid-1970s until the financial crisis, taxation of the rich declined drastically. For instance, top PIT rates in the OECD decreased from 70% in 1975 to 50% in 2005 (Ganghof, Reference Ganghof2006b, p. 1). It is noteworthy that this decline happened during a time period where OECD countries faced substantially lower growth rates, growing unemployment, and increasing public debt (Pierson, Reference Pierson1998; OECD, 2018b). A similar trend of decreasing tax rates can be observed when the country sample is expanded beyond the OECD (Peter et al., Reference Peter, Buttrick and Duncan2010). However, since the financial meltdown of 2008, this trend has come to a standstill. In fact, top PIT rates even increased slightly on average in the OECD from 2008 to 2016 (OECD, 2017). So, has the financial crisis had a causal effect on top PIT rates? And, if yes, how exactly? I argue that the sudden halt to the downward movement in taxing top incomes can be explained by notions of fiscal fairness during and after the financial crisis. Fairness considerations for restoring equal fiscal treatment have been articulated prominently during the crisis. Take Ireland, for instance, which was hit extremely hard by the financial crisis of 2008. The budget of 2009 increased the tax progressivity of the income tax system by raising top tax rates via an additional income levy for top incomes while increasing the standard rate tax band. In his speech on the 2009 budget, then Minister of Finance Brian Lenihan (Fianna Fáil) declared:
The Government is concerned that some of the more expensive tax reliefs, especially for the better off, should be scaled back and the resources used, as appropriate, to protect those taxpayers who are most vulnerable in these times. It is fair and reasonable that those who profited most from the recent good economic times should shoulder a commensurate burden as conditions worsen. (Lenihan, Reference Lenihan2008)
A supplementary budget in April 2009 increased the progressivity of the Irish income tax system even further by doubling income levy rates. Lenihan repeatedly referred to the fairness dimension of these tax increases: ‘The Government has taken care to ensure they are fair, equitable and highly progressive’ (Lenihan, Reference Lenihan2009). The overall increases in top PIT rates during the crisis from 41% to 48%, although implemented by a conservative government, even match the Irish Congress of Trade Unions proposal who demanded ‘a fair contribution from the wealthy p. 14’ (ICTU, 2009).
But how has the financial crisis influenced fairness considerations for higher taxes on the rich? Based on the work of Scheve and Stasavage (Reference Scheve and Stasavage2016), I argue that compensatory arguments demanding a correction of unequal treatment by the state have pushed for higher taxes on the rich. This perception of unequal treatment came in two forms: first, indirectly because of regulatory passivity prior to the crisis and, second, directly through state actions during the financial crisis.
Indirect unequal treatment stems from unregulated international financial markets in the run-up to the crisis. More specifically, weak regulatory interventions fostered two developments that have affected compensatory claims for tax progressivity. First, richer citizens were the beneficiaries of these unregulated markets prior to the crisis. Increasing tax progressivity therefore aims at making especially those who previously profited the most from deregulated financial systems pay for the crisis. Second, a lack of financial regulation enabled rich investors to take up systemic risks in their financial activities. These risky investments have been perceived as causes of the crisis, which led to blame attribution to rich elites and particularly bankers (Bartels and Bermeo, Reference Bartels and Bermeo2014). Taken together, regulatory passivity of states has caused the perception of an unequal treatment of citizens indirectly because it allowed profitable financial risk-taking that facilitated the financial crisis.
Direct unequal treatment during the crisis originates from large-scale bailouts of troubled financial enterprises. These public bailout programmes mark an unequal treatment of citizens by the state: a richer subgroup of the population – people involved in or profiting from risky financial activities – benefits from bailouts while costs are externalized by pooling them amongst society as a whole. As described in the previous section, it is the process leading to an outcome that matters for perceptions of fairness, not the final outcome itself. For bank bailouts during the crisis, this means that higher public debt alone is not the main driver leading to a higher tax burden on the rich. What matters is that increases in debt came in the form of external effects induced by state actions. This procedural dimension fosters compensatory demands for tax progressivity (Limberg, Reference Limberg2019). Admittedly, there are more efficient, straightforward ways to compensate for bailouts than raising top PIT rates. For example, in 2010 Italy introduced an additional levy of 10% on variable compensation paid to managers in the financial sector (EY, 2015). Moreover, the G20 at their summit in Pittsburgh from 24 to 25 September 2009 requested the International Monetary Fund to summarize possible options ‘how the financial sector could make a fair and substantial contribution toward paying for any burdens associated with government interventions to repair the banking system p. 4’ (IMF, 2010). However, putting a higher tax burden on struggling financial institutions that are kept alive by public money seems counter-intuitive in times of crisis. Excluding those banks which are under immediate financial distress is not an option either, as this would not only fail to fulfil the original purpose of compensation but would also punish those banks which have taken less risky activities. Yet, the existence of other, more direct ways of fiscal compensation means that using top PIT rates is a conservative empirical strategy.
It is important to mention that countries with a financial crisis might increase top PIT increases just to generate desperately needed revenues. Two things have to be considered here. First, if financial crises generally increase tax rates because of revenue needs, the effect would be even stronger for taxes with a broad tax base like consumption taxes (Kenny and Winer, Reference Kenny and Winer2006). Second, if top PIT rates are only increased to react to revenue shortfalls, we would expect higher debt to raise rates regardless of the procedural dimension. In other words, increasing levels of public debt would lead to higher tax rates even in the absence of a financial crisis. To the contrary, a fairness-based explanation will only expect more public debt to increase tax progressivity if the procedure that led to rising debt is perceived as unfair. With regard to my study, this means that higher debt will only lead to increasing top PIT rates in countries that have experienced a prior financial crisis. The fact that PIT rates have declined massively since the mid-1970s – thus, after the end of the post-war economic boom and in times of ‘permanent austerity’ (Pierson, Reference Pierson1998) – supports the view that higher debt does not lead to higher tax progressivity per se. I will come back to both points in the empirical analysis.
Based on these theoretical considerations, I formulate my working hypotheses. First, I have argued that fiscal fairness considerations in the wake of the crisis have increased taxes on the rich and particularly top PIT rates.
Hypothesis 1: Countries with a financial crisis have increased top PIT rates to a higher extent than countries without a financial crisis.
Second, if fairness arguments are pushing for increases in top PIT rates, we would not expect to see a similar effect for a regressive tax such as the value-added tax (VAT) or, respectively, the general sales tax (GST). Therefore, my second hypothesis is as follows.
Hypothesis 2: Countries with a financial crisis have not increased standard GST/VAT rates to a higher extent than countries without a financial crisis.
GSTs and even more so VATs are considered to be especially efficient and growth friendly (Wilensky, Reference Wilensky2002; Kato, Reference Kato2003; Messere et al., Reference Messere, de Kam and Heady2003; Lindert, Reference Lindert2004; OECD, 2018a). In particular, they can help to increase the overall tax take whilst keeping capital taxation at modest levels (Ganghof, Reference Ganghof2006a). Thus, increasing GST/VAT rates is a viable policy option for governments which worry about economic growth in times of crisis. Hence, one could expect that countries with a financial crisis have increased GST/VAT rates purely out of economic reasons. This makes Hypothesis 2 a hard test for my argument.
Third, I have argued that fiscal fairness considerations were triggered by (non)state action before and during the crisis. Crisis-induced increases in public debt are therefore the most visible consequence of this unequal treatment. In the absence of a financial crisis, however, I do not expect higher public debt to have an effect on top PIT rates.
Hypothesis 3: Higher public debt increases top PIT rates if it appears in the wake of the financial crisis.
Data and methods
In order to test my hypotheses empirically, I use a new, self-constructed data set on top marginal PIT rates in 122 countries from 2006 to 2014. Top PIT rates have been widely used and accepted as a measurement of income tax progressivity (Ganghof, Reference Ganghof2006b; Peter et al., Reference Peter, Buttrick and Duncan2010; Volscho and Kelly, Reference Volscho and Kelly2012; Swank, Reference Swank2016). Scheve and Stasavage (Reference Scheve and Stasavage2016) look at full schedules of income tax rates to compare tax progressivity across countries and time. They find that changes in top PIT rates are a good indicator for overall changes in tax progressivity. Furthermore, higher top marginal income tax rates are an effective policy instrument to lower inequality. Huber et al. (Reference Huber, Huo and Stephens2017) show that raising top PIT rates reduces extreme income concentration at the top.
I code the top marginal PIT rate for residents excluding social security contributions. If income taxes are levied both on the national and on the local level, rates are combined and the local top rate is taken. In case schedular income taxes are in place, I code the overall top rate. Some countries (e.g. Mauritania) have scheduler income taxes and a general income tax that applies if more than one kind of income is generated. In these cases, the rates for general income tax are taken. Coding is based on the Ernst & Young Worldwide Personal Tax and Immigration Guides from 2006 to 2015 (EY, 2015). Additionally, data have been checked and expanded using IMF country reports, several Deloitte reports on ‘Key Economies in Africa’ (Deloitte, 2015), and the ‘Taxing Work’ database from the OECD (2017). Standard GST/VAT rates are taken from KPMG (2017) and additional information on whether a GST/VAT was in place or not comes from the Tax Introduction Database (Genschel and Seelkopf, Reference Genschel and Seelkopf2019).
The empirical analysis is twofold. I start off by testing Hypotheses 1 and 2. To do so, I use a difference-in-differences design to look at the impact of the financial crisis on the change in top PIT and standard VAT rates. The difference in tax rates is calculated from 2007 to 2010 to capture short-term developments and from 2007 to 2014 for medium-term change. Data on whether a specific country was hit by a financial crisis in a respective year come from Laeven and Valencia (Reference Laeven and Valencia2013). The authors measure banking crisis with a dichotomous variable that takes the value one if at least two of the following six criteria are metFootnote 2 : deposit freeze and bank holiday, extensive liquidity support, significant guarantees on bank liabilities, significant bank restructuring costs, significant asset purchases, and significant nationalizations. For a detailed description of the exact thresholds for each criterion, see Laeven and Valencia (Reference Laeven and Valencia2013, p. 230 f.). In total, 25 countries in my sample have experienced a financial crisis (Table A1 in the Online Appendix).Footnote 3 Based on the potential outcome approach, I estimate the average treatment effect on the treated (ATT),
 $${\tau _{ATT}} = E(\tau |D = 1){\rm{ }} = E[Y(1)|D = 1]{\rm{ }} - E[Y(0)|D = 1]$$
where τ ATT denotes the treatment effect, D the treatment of facing a financial crisis, and Y(1) the mean change in tax rates for treated and Y(0) for untreated countries. Hence, E[Y(1)|D = 1] is the expected mean change in tax rates for treated countries that have received the treatment and E[Y(0)|D = 1] the counterfactual mean. However, the counterfactual mean is not directly observable because we do not know how tax rates in crisis countries would have changed if they had not been hit by a financial crisis. Therefore, I take the mean change in tax rates of untreated countries instead.
 $${\tau _{ATT}} = E(\tau |D = 1){\rm{ }} = E[Y(1)|D = 1]{\rm{ }} - E[Y(0)|D = 0]$$
Yet, experiencing a financial crisis might not be random. If factors that lead to selection into treatment also influence the potential outcome, results may be biased. In order to estimate τ ATT , we therefore have to make two identification assumptions. The selection on observables assumption states that we can observe all variables which might influence both the likelihood of being treated and the outcome of interest. Furthermore, the overlap assumption demands that units – in my case countries – with the same values for a set of covariates X have a positive probability of being either in the control or in the treatment group. Based on these assumptions, I apply a matching approach to deal with the possible selection bias. More specifically, I use genetic matching minimizing the Mahalanobis distance based on X (Diamond and Sekhon, Reference Diamond and Sekhon2012).
I match upon three covariates which may (1) increase the likelihood of facing a financial crisis and (2) lead to rising top PIT rates. First, richer countries might have a higher risk of facing a financial meltdown as they have bigger financial sectors and a higher degree of monetization. Moreover, richer states have a higher administrative capacity to levy and collect income taxes (Dincecco, Reference Dincecco2011). Hence, these countries could also be more likely to increase top PIT rates. Therefore, I include a country’s GDP per capita (logged values) (World Bank, 2018) in my matching procedure. Second, countries with a higher amount of public debt might be more vulnerable to financial crises. In addition, high levels of public debt may also lead governments to increase tax rates in order to consolidate public households (Kenny and Winer, Reference Kenny and Winer2006). I include public debt (% of GDP) into my matching models to account for this (World Bank, 2017). Third, countries which are better integrated into global flows of goods and services could be more likely to be hit by a financial crisis (Reinhart and Rogoff, Reference Reinhart and Rogoff2009). At the same time, the degree of globalization can also affect tax policy-making in the wake of the crisis. On the one hand, globalization has had a negative impact on tax progressivity up to the financial crisis (Ganghof, Reference Ganghof2006b; Genschel and Schwarz, Reference Genschel and Schwarz2011). On the other hand, countries which have lowered top rates to a higher extent prior to the crisis might have more room for increasing tax rates again. In other words, a high degree of globalization could even have a positive impact on top tax rates in the wake of the crisis. To measure a country’s openness, I use the overall KOF Index of Globalization (Dreher, Reference Dreher2006; Dreher et al., Reference Dreher, Gaston and Martens2008). For all three variables, I take the 2007 values to avoid post-treatment bias. Furthermore, I include the matched-on variables in the regression models after creating the matched data set (Ho et al., Reference Ho, Imai, King and Stuart2007).
Although the matching approach controls for biases in treatment assignment, it is based on the selection on observables assumption. In other words, matching is not a silver bullet. There might still be other country characteristics that can affect whether a country has faced a financial crisis or not. However, selection bias may even reduce the observed crisis effect. Think, for instance, of countries with a generally more liberal approach to policy-making (Castles, Reference Castles1993). Such countries could not only be more likely to experience crises due to loose financial regulations, but they might also be more reluctant to expand redistribution via progressive taxation. A similar logic applies with respect to country size. Smaller countries often possess big financial sectors and might therefore be more vulnerable to financial shocks. At the same time, standard theories of tax competition expect small countries to lower tax rates on mobile assets considerably (Bucovetsky, Reference Bucovetsky1991). As a consequence, being a small state can have a negative impact on the development of top PIT rates. In sum, not including these characteristics in my matching models means that the estimated crisis effect may even be biased downwards. Hence, only matching on characteristics which might (1) increase the likelihood of a financial crisis and (2) raise top PIT rates is a conservative test strategy.
In addition to the matching approach, I also apply weighting methods (see Table A2). I calculate propensity scores based on my set of covariates X. These reflect ‘the conditional probability of assignment to a particular treatment given a vector of observed covariates’ (Rosenbaum and Rubin, Reference Rosenbaum and Rubin1983, p. 41). Thus, the identification assumptions are satisfied if we condition on the propensity scores (Hirano et al., Reference Hirano, Imbens and Ridder2003; Austin, Reference Austin2011).
In order to test for the impact of changes in public debt on top PIT rates in the wake of a financial crisis (Hypothesis 3), I look at yearly data for all 122 countries in my sample from 2006 to 2014. Since I am mainly interested in tax policy changes, I apply a model that looks at the first difference of the dependent variable. This allows me to rule out unobserved country heterogeneity by looking at changes for my main variables of interest whilst also estimating level effects (e.g. for democracy). Furthermore, I include year fixed effects to control for common trends. The models are calculated with country-cluster robust standard errors. Again, the central dependent variable is the change of a country’s top PIT rate in a respective year and data for financial crises are taken from Laeven and Valencia (Reference Laeven and Valencia2013). Fiscal problem pressure is measured by changes in public debt (% of GDP) (World Bank, 2018). To rule out endogeneity, changes in debt are lagged by 1 year. I let the indicator interact with the crisis dummy (lagged by 1 year) to compare the impact of changing debt in the wake of the financial crisis to normal times. To account for convergence dynamics in tax policy-making, I include the lagged level of the top PIT rate (Plümper and Schneider, Reference Plümper and Schneider2009). Furthermore, I include a battery of covariates to control for several institutional, economic, and political characteristics of a country (Dreher, Reference Dreher2006; Dreher et al., Reference Dreher, Gaston and Martens2008; Boix et al., Reference Boix, Miller and Rosato2013; World Bank, 2018). Since the choice of method for estimating time-series cross-sectional models can produce strongly deviating results, I also run several other model specifications (see Table A5 in the Online Appendix).
Results
Before we turn to the matching models, let us first look at the naive difference-indifferences estimator without accounting for a possible selection bias (Equation 2). A simple t test reveals that countries with a financial crisis have increased top PIT rates by 2.4 percentage points in the short (2007–10) and by 3.7 percentage points in the medium run (2007–14) compared to non-crisis countries. Both results are statistically highly significant. In contrast, changes in VAT rates do not differ significantly between crisis and non-crisis countries. Importantly, this estimator only looks at the difference between countries with and without a financial crisis. Overall, GST/VAT rates have increased by 0.8 percentage points. Thus, consumption tax rates have faced a general upward trend regardless whether a country was hit by a financial crisis or not. This finding is in line with research on overall trends in tax policy-making during the last decade (Lierse and Seelkopf, Reference Lierse and Seelkopf2016). Top PIT rates, to the contrary, have been increased in countries with a financial crisis and slightly decreased elsewhere. Figure 2 shows mean changes in top PIT rates from 2006 to the respective year. Until 2008, rates in countries with and without a financial crisis show a slight downward trend.Footnote 4 Since the crisis, however, rates have diverged.
Change in top PIT rate since 2006 for countries with and without a financial crisis. Data: Own coding.

Looking at the balance statistics reveals that countries that were hit by the crisis were richer, had more public debt, and were globalized to a higher extent (Table A3). As these factors may also influence tax policies, a selection bias might affect the results. When simply controlling for these covariates without matching the data (Table 1, Models 1 and 2 as well as Models 5 and 6), the financial crisis still has a positive and statistically significant effect on top PIT rates. The difference-in-differences estimator shows a crisis effect of 2.6 percentage points in the short run and 4 percentage points in the medium run. To the contrary, the financial crisis has not had an effect on standard GST/VAT rates. One of the disadvantages of this regression approach is that it does not allow us to assess the balance of our covariates after running the regressions. Therefore, let us turn to the models which use genetic matching (Table 1, Models 3 and 4 as well as Models 7 and 8). After using the matching procedure, the standardized mean differences of the three covariates do not show signs of substantial imbalance anymore (Rosenbaum and Rubin, Reference Rosenbaum and Rubin1985).Footnote 5 On average, the financial crisis has increased top PIT rates by 3 percentage points in the short run. In the medium run, the effect remains statistically significant and even increases to more than 4.3 percentage points. In comparison, the financial crisis has not had a statistically significant effect on standard GST/VAT rates.Footnote 6 The results are similar when we use a weighting approach instead of matching (Table A2). In total, countries with a crisis have increased progressive top PIT rates whereas GST/VAT rates have not diverged between crisis and non-crisis countries. These findings strongly support Hypotheses 1 and 2.
The impact of the financial crisis on change in top PIT rates and GST/VAT rates, 2007–14

***P < 0.001, **P < 0.01, *P < 0.05.
It is important to stress that this difference-in-differences approach looks at the ATT. Thus, it does not analyse heterogeneity in the treatment effect. For instance, it might be the case that fiscal fairness claims for taxing the rich were weaker in states which were more capable to buffer the shock of the financial crisis via monetary policy or social expenditure. However, the limited sample size of my analysis makes the estimation of such subgroup effects difficult (Hainmueller et al., Reference Hainmueller, Mummolo and Xu2019). Therefore, investigating heterogeneity in the treatment effect is an interesting approach for future qualitative work.
To get a closer look on the actual mechanisms of this crisis effect, let us now turn to the panel models. The results are presented in Table 2. Model 1 shows the results without differentiating whether changes in debt have happened in the wake of the financial crisis or not. Model 2 adds the financial crisis dummy. Finally, Model 3 includes an interaction effect between changes in public debt and the financial crisis. In line with the previous difference-in-differences models, financial crises have a positive impact on top PIT rates (Table 2, Model 2). Furthermore, the influence of higher public debt clearly differs depending on whether debt increases in a post-crisis year or not. In ‘normal’ times, the effect of higher debt is indistinguishable from zero (Model 3). Increasing public debt only leads to higher top PIT rates in the wake of the financial crisis. This finding is also robust to excluding the year fixed effects in order to ensure that the findings are not driven by collinearity of the crises with temporal dynamics (Model 4). Figure 3 illustrates this interaction effect by showing the conditional effect of changes in public debt on changes in top PIT rates. In countries without a prior crisis, rising public debt does not increase the predicted change of top PIT rates. If increases in debt happen in the wake of the financial crisis, however, predicted tax rate changes are positive and statistically significant. The assumption of common support holds: for example, there are 172 country-year observations in which increases in debt were higher than 5% of GDP. On average, a crisis-induced increase in debt by 5% of GDP leads to a predicted rise in top PIT rates by 0.7 percentage points. Since there are more non-crisis years (853) than crisis-years (123), confidence intervals are larger for the effect of Δ Debt with a previous financial crisis.
Panel models, 2006–14
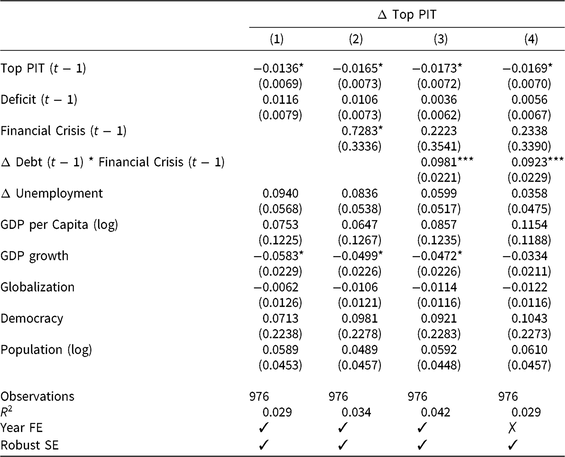
*** P < 0.001, ** P < 0.01, * P < 0.05.
Conditional effects for the impact of Δ Debt on Δ Top PIT rate with and without a financial crisis.

In sum, higher public debt does not lead to more progressive taxation per se. Instead, increasing public debt as an effect of state action prior to and during the financial crisis raises demands for compensatory taxation. To put it in other words, the causes of dire fiscal times shape tax policy-making. If higher debt takes the form of an external effect of the financial crisis (e.g. because of public bailouts), tax progressivity increases to compensate for this process (Hypothesis 3).
Most of the control variables do not have a statistically significant effect on top PIT rates. The coefficients for the lagged top PIT rates are negative and statistically significant. This indicates that top PIT rates have converged. Real GDP growth has a negative and statistically significant coefficient, too. Democratic institutions have a positive, yet statistically insignificant effect on top tax rates. One might argue that democratic institutions are a general scope condition for tax policy changes based on fiscal fairness claims. Since most countries hit by the financial crisis were democratic, I cannot run interaction effects to further investigate this argument here. However, Scheve and Stasavage (Reference Scheve and Stasavage2012, p. 96) show that compensatory arguments can lead to higher tax progressivity in both democratic and non-democratic settings.
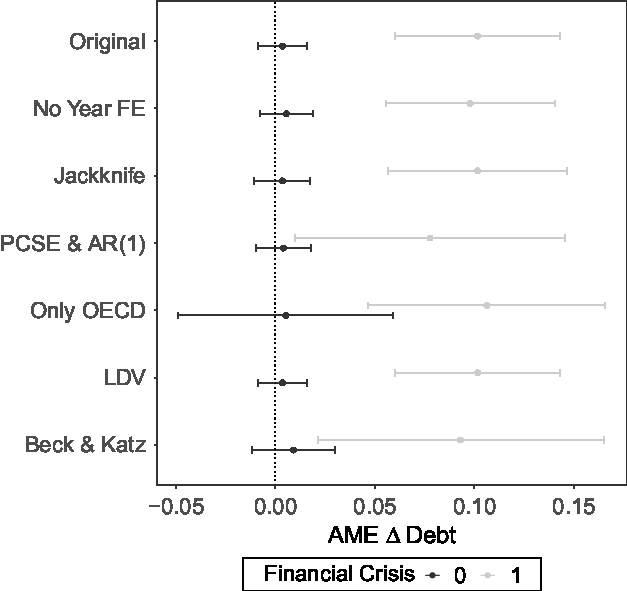
To check the robustness of my findings, I run several additional model specifications. First, influential cases might bias the results. To deal with this problem, I perform a stepwise exclusion of countries via a jackknife procedure. Second, I use panel-corrected standard errors (PCSEs) as well as a Prais–Winsten estimation which model first-order autoregressive (AR(1)) disturbances (Plümper et al., Reference Plümper, Troeger and Manow2005). Third, I run a subset analyses only for the 36 OECD countries to ensure that the results are not driven by the heterogeneous country sample. Since all OECD countries were democratic throughout the observation period, I cannot estimate the effect of democratic institutions on tax rate changes. Fourth, I look at the level of the top PIT rate instead of its first difference. By doing so, the purpose of the lagged dependent variable changes. Instead of controlling for dynamics of policy convergence, it now serves as a dynamic specification which controls for autocorrelation (Keele and Kelly, Reference Keele and Kelly2006). Finally, I run a model which follows the so-called de facto Beck and Katz (Reference Beck and Katz1995) standard as it includes a lagged dependent variable, country and year fixed effects as well as PCSEs. Results hold throughout all models (Table A5, Models 1–5). Figure 4 visualizes this by showing average marginal effects of changes in debt for all the different models. Across specification, higher public debt does not lead to increases in top PIT rates in the absence of a financial crisis. To the contrary, crisis-induced debt has a positive and statistically as well as substantively significant effect on top rates. Furthermore, I expand my models by including additional covariates (Table A6 in the Online Appendix).Footnote 7 Again, the main results prove to be robust.
Average marginal effects of Δ Debt with and without a financial crisis.
Conclusion
Has the financial crisis led to higher taxes on the rich? Using new data on top PIT rates for a global country sample, I have shown that the financial crisis has indeed caused rising tax rates on high incomes. On average, the financial crisis increased top PIT rates by more than 4 percentage points in the medium run. Furthermore, this effect does not solely stem from a need for revenues in times of crisis. As my analysis has shown, we cannot observe a similar crisis effect for revenue-efficient yet regressive sales taxes. Thus, rising top PIT rates serve the function of restoring fiscal fairness. As richer subgroups in the population profited from state actions both directly and indirectly in crisis countries, higher tax rates on the rich aim at compensating for this unequal treatment. In line with studies about the effect of warfare on tax progressivity (Scheve and Stasavage, Reference Scheve and Stasavage2016), I have argued that the procedural dimension of socio-economic outcomes is a crucial factor for policy-making. It is not general fiscal problem pressure that causes politicians to raise tax rates on the rich. Instead, what matters is how these problems were caused in the first place. The empirical analysis has supported this approach: higher debt does not lead to increasing top PIT rates per se. In fact, higher public debt only increases tax rates on top incomes if it is crisis-induced. Hence, only if higher debt is perceived as the unfair result of (pre-)crisis measures, top PIT rates will rise to compensate for this unequal treatment.
The findings of my study have implications for the growing literature on inequality and tax policy-making in the 21st century (Piketty, Reference Piketty2014; Kiser and Karceski, Reference Kiser and Karceski2017). First, I have shown that fiscal fairness considerations to tax the rich (Scheve and Stasavage, Reference Scheve and Stasavage2016) also work in the absence of mass warfare. In my study, the financial crisis has served as an example for another different macro-level shock that caused a revival of progressive taxation. Thus, fiscal fairness claims still play a role for tax policy-making and the demise of interstate warfare does not necessarily mean the end of progressive taxation as we know it. Furthermore, these results also provide a new perspective on the literature of unequal political influence (Bartels, Reference Bartels2008; Gilens and Page, Reference Gilens and Page2014). Whilst these authors find that policy-makers are more responsive to the policy preferences of wealthy citizens, my study shows that general fiscal fairness demands to compensate for an unequal treatment can still affect taxes on the rich. Thus, the results suggest that mass policy preferences can still matter for policy-making (Canes-Wrone, Reference Canes-Wrone2015).
Second, there is still room to manoeuvre for national (tax) states. For a tax like the PIT which is indirectly under global market pressure (Ganghof, Reference Ganghof2006b), national governments can increase top tax rates. Yet, three things have to be considered here. First, as the PIT offers more degrees of freedom to tax policy-makers, we might not expect to see a similar crisis effect for a tax with a more mobile tax base like the corporate income tax. In fact, the Irish case offers anecdotal evidence on this. In the very same budget speeches where Minister Lenihan justified top PIT rate hikes with compensatory claims, he spoke out against raising corporate income taxes as it was ‘a key aspect of our inward investment strategy’ (Lenihan, Reference Lenihan2009). Second, multilateral cooperation against tax evasion in the aftermath of the crisis has changed the scope conditions of taxing personal income (Hakelberg, Reference Hakelberg2016). These measures, and most notably the AEOI, have increased the capability of national governments to adjust taxation of personal income even further (Hakelberg and Rixen, Reference Hakelberg and Rixen2018). Third, the average crisis effect on top PIT rates is substantial (4 percentage points) when we look at tax policy-making in the last 30 years. As a comparison, the Social Democratic Party (SPD) of Germany demanded an increase of the top PIT rate by 3 percentage points in the 2017/2018 coalition talks with the Christian Democrats (Süddeutsche Zeitung, Reference Süddeutsche2018).Footnote 8 However, the size of the crisis effect is relatively small compared to the effect that previous wars and crises had on tax progressivity over the long run of history. For instance, Scheve and Stasavage (Reference Scheve and Stasavage2010) find that countries which mobilized for World War I raised top marginal PIT rates by more than 30 percentage points.
Third, the article offers a new perspective on fiscal consolidation in the wake of the crisis. So far, much work has looked at austerity programmes (Armingeon, Reference Armingeon2012; Schäfer and Streeck, Reference Schäfer and Streeck2013). However, my analysis has shown that crisis-induced compensatory claims can shape fiscal consolidation measures. Whilst this study has focused on taxation, future research could investigate other dimensions of public households. Have fiscal fairness considerations affected spending cuts after the Great Recession? Does progressive taxation differ from other redistributive policies? If yes, why? Furthermore, has welfare state retrenchment after the financial crisis strengthened compensatory demands to tax the rich even further? Such analyses would also help to shed more light on the connection between tax and social policies. This nexus between the funding and the spending side of public households has largely been overlooked in comparative political economy research.
This article has looked at the PIT as a highly visible and contested tax. Examining the crisis’ effects on other progressive taxes is a crucial next step. For example, what role have fiscal fairness claims played in the wake of the financial crisis for extremely progressive taxes on inheritances and net wealth? Did the crisis have an influence on property and land taxes, which are predominantly levied on the subnational level? And what role did fairness arguments play for proposals of a financial transaction tax? Finding out which factors are driving the development of other highly redistributive taxes is crucial for our understanding of inequality dynamics nowadays.
Acknowledgement
I wish to thank Per Andersson, Björn Bremer, Reto Bürgisser, Christina la Cour, Richard Eccleston, Philipp Genschel, Lukas Hakelberg, Ellen Halliday, Katy Morris, Thomas Rixen, Kenneth Scheve, Laura Seelkopf, Paula Zuluaga, participants at the annual conference of the DVPW Political Economy Section 2018 and the ECPR 2018, as well as the Editors of the European Political Science Review, and five anonymous reviewers for their valuable comments and suggestions.
Supplementary material
To view supplementary material for this article, please visit https://doi.org/10.1017/S1755773919000183.


 Open access

