Introduction
The glial Müller cells (MCs) are not connected synaptically to the retinal neuronal network, but are capable of generating substantial extracellular potentials in response to light-induced changes of extracellular K+ concentration ([K+]o) caused by the photoreceptors and the postreceptor neurons. As a result, MCs noticeably contribute to the electroretinogram (ERG). One component of the ERG that is undoubtedly generated by MCs is slow PIII (sPIII), a cornea-negative slowly developing potential (with a time constant of a few seconds), which dominates the response of the isolated retina to long-lasting light stimuli and significantly influences the amplitude of the c-wave in the ERG of the intact eye. It was shown that sPIII cannot be directly caused by the photoreceptors (since the source and sinks of the current responsible for this potential are localized proximally to the photoreceptor layer), nor by the postreceptor retinal neurons (because sPIII remains after block of synaptic transmission from the photoreceptors to the postreceptor neurons), leaving MCs as the only suitable generator (Faber, Reference Faber1969; Hanitzsch, Reference Hanitzsch1973; Witkovsky et al., Reference Witkovsky, Dudek and Ripps1975). Then it was found that light-induced photoreceptor activity is accompanied by a slow decrease of [K+]o (Oakley & Green, Reference Oakley and Green1976; Tomita, Reference Tomita1976; Steinberg et al., Reference Steinberg, Oakley and Niemeyer1980; Bykov et al., Reference Bykov, Dmitriev and Skachkov1981) that should hyperpolarize the distal part of MCs, which in turn can cause a cornea-negative sPIII. Application of Ba++, which blocks K+ conductance of the MCs, leads to suppression of sPIII (Bolnick et al., Reference Bolnick, Walter and Sillman1979; Matsuura, Reference Matsuura1984). The close similarity in the time courses and the time summation properties between the light-induced hyperpolarization of MCs, the distal [K+]o decrease, and sPIII were demonstrated in conditions when the post-photoreceptor activity was eliminated and could not interfere with the K+-mediated photoreceptor-MC interactions (Dmitriev et al., Reference Dmitriev, Bykov and Gavrikov1988). Finally, sPIII disappeared in mice in which Kir4.1, the main type of K+ channels in the MCs, was knocked out (Kofuji et al., Reference Kofuji, Ceelen, Zahs, Surbeck, Lester and Newman2000). Thus, there is no doubt in the glial nature of sPIII.
It was also suggested that MCs are responsible, at least in part, for another major ERG component, the b-wave (Werblin & Dowling, Reference Werblin and Dowling1969; Kline et al., Reference Kline, Ripps and Dowling1978; Newman & Odette, Reference Newman and Odette1984; Dick & Miller, Reference Dick and Miller1985; Dick et al., Reference Dick and Miller1985; Wen & Oakley, Reference Wen and Oakley1990). The light-induced [K+]o increases in the retinal layers proximal to the photoreceptors should inevitably lead to a transretinal potential generated by MCs, but this case is more complicated than generation of sPIII. The amplitude and even the polarity of this potential depends on several factors — the localization of the [K+]o increases, variations in resistance of the extracellular space in different retinal layers, and the distribution of K+ conductance along MCs (for explanation of the general principles that govern the generation of extracellular voltages by MCs, see Supplementary Text S1). In the vertebrate retina, there are actually two light-evoked [K+]o increases, one in more distal and another in more proximal layers. The proximal [K+]o increase dominates; it covers a broad area of the MC membrane in both the IPL and INL. The distal [K+]o increase is significantly smaller and its location is limited to a narrow region in the OPL. Accordingly, the proximal [K+]o increase practically determines the amplitude and the time course of the intracellularly recorded depolarization of MCs (Karowski & Proenza, Reference Karowski and Proenza1977, Reference Karwoski and Proenza1978). But this proximal [K+]o increase is badly situated for generation of a cornea-positive extracellular potential that can contribute to the b-wave of the ERG. Its location suggests that it would evoke rather a cornea-negative transretinal potential if the distribution of K+ conductance along the MC were more or less uniform, such as was shown for MCs isolated from mammalian retinae (Newman, Reference Newman1987). The sign of the transretinal potential could be reversed to cornea-positive if the majority of the K+ conductance were concentrated in the MC endfoot, as was found for isolated amphibian MCs (Newman, Reference Newman1984, Reference Newman1985), but this would come at the expense of a significant reduction of the K+ conductance in the area of the [K+]o increase, and accordingly would be accompanied by a dramatic reduction of the amplitude of all potentials generated by MCs (see explanation in Supplementary Text S1). Besides, even if the majority of the K+ current was turned in the proximal direction, it would run through a low extracellular resistance, since the proximal [K+]o increase is close to the endfoot, further reducing the amplitude.
On the other hand, the distal [K+]o increase can and should generate a cornea-positive transretinal potential. Its location in the OPL divides MCs into two very uneven parts, and almost guarantees that the combined resistance of the MC membrane in the INL, IPL, GCL, and endfoot is smaller than that in the distal part between the OPL and OLM. Accordingly, the majority of the K+ current flows toward the endfoot through the cell and then distally through a long part (and a substantial resistance) of the extracellular space. When the electrical effects of the [K+]o increases in the retina were tested computationally (Newman & Odette, Reference Newman and Odette1984), it was shown that MCs could generate a considerable cornea-positive potential which was similar to the b-wave, and this potential was determined almost exclusively by the distal [K+]o increase without any significant contribution from the proximal one. The problem here, however, is that a large amplitude distal [K+]o increase, which (importantly!) spreads widely in the retina, is necessary for the generation of a glial potential comparable to the b-wave. Such an increase of [K+]o was assumed in the calculations, but it was not recorded experimentally. Earlier recordings of [K+]o described only a proximal increase, missing the distal increase entirely due to its small amplitude and limited location (Oakley & Green, Reference Oakley and Green1976; Karwoski & Proenza, Reference Karwoski and Proenza1978; Steinberg et al., Reference Steinberg, Oakley and Niemeyer1980). When the distal [K+]o increase was later detected and its importance for potential contribution to the b-wave was recognized, several studies were specifically performed to characterize it. In this respect, the most successful results were obtained by Wen and Oakley (Reference Wen and Oakley1990) in toad retina. They were able to record the distal [K+]o increase, which at its peak exceeded 0.4 mM. But it was localized in an extremely narrow area. Just 2 μm from the maximal change the response was halved and it was already barely noticeable only 5 μm away, which was not unexpected given its origin in the thin OPL. This means that a very small fraction of the MC membrane (with very high relative resistance) was exposed to this distal [K+]o increase, which leaves only a slight chance for generation of noteworthy glial potentials from a distal [K+]o increase.
Besides the difficulties described above for the MC hypothesis of b-wave generation, there are additional problems related to dynamics of the responses. All intracellular and extracellular responses of MCs have to follow the time course of the [K+]o changes that initiated them. The distal [K+]o decrease, MC hyperpolarization and sPIII all have very similar time courses (Dmitriev et al., Reference Dmitriev, Bykov and Gavrikov1988), which is consistent with the glial nature of sPIII. In contrast, both [K+]o increases develop more slowly and last much longer than the b-wave. An elegant way to resolve this problem was offered by Kline et al. (Reference Kline, Ripps and Dowling1978), who suggested that the cornea-positive MC potential from the distal [K+]o increase overlapped with the cornea-negative MC potential from the proximal [K+]o increase, so that the rising front of the b-wave came from the former and the trailing decrease of the b-wave came from the latter. Still, for this mechanism to work, the distal [K+]o increase must be larger and in a wider area than has ever been experimentally recorded.
Additionally, the b-wave survives application of Ba++ (Hu & Marmor, Reference Hu and Marmor1984; Coleman et al., Reference Coleman, Carras and Miller1987), which blocks the MC’s potassium conductance. The b-wave also persists in mice in which the main K+ channels of MCs, Kir4.1, are knocked out (Kofuji et al., Reference Kofuji, Ceelen, Zahs, Surbeck, Lester and Newman2000). For a long time now the On-bipolar cells have been considered to be the main b-wave generator (Stockton & Slaughter, Reference Stockton and Slaughter1989; Gurevich & Slaughter, Reference Gurevich and Slaughter1993). However, MCs still may have some contribution to the b-wave that influences its amplitude and shape. Experiments with Ba++-treated retinae and knockout mice demonstrated that a large part of the b-wave can be generated without MCs, but the b-wave in Kir4.1 knockout mice was 117 μV, compared to 142 μV in controls (Kofuji et al., Reference Kofuji, Ceelen, Zahs, Surbeck, Lester and Newman2000). This difference left open the possibility that some part of the b-wave can have a glial nature. The question is purely quantitative and needs to be addressed from a quantitative point of view. Yet, it has not been done. The numerous measurements of light-induced changes of [K+]o in different retinal layers demonstrated that MCs should generate transretinal potentials, but the results were not quantitatively evaluated. On the other hand, the only computational attempt to simulate the contribution of MCs to the b-wave (Newman & Odette, Reference Newman and Odette1984) used theoretical assumptions about [K+]o changes (an unrealistically large distal increase), instead of real data. Here, we combined experimental data on light-induced [K+]o changes in the isolated mouse retina with a relatively simple electrical model of MCs to determine whether MCs play a role in b-wave generation.
Materials and methods
Experimental procedures
Animal experiments were performed in accordance with the Association for Research in Vision and Ophthalmology Statement for the Use of Animals in Ophthalmic and Vision Research and were approved by Northwestern University’s Institutional Animal Care and Use Committee. After prolonged dark adaptation (more than 3 h), mice (C57BL/6J) were anesthetized with 3% isoflurane/21% O2 and euthanized by cervical dislocation. Eyes were removed and retinae were isolated under a binocular microscope with dim red light illumination. The isolated retina was placed on a piece of fine CellMicroSieves nylon mesh (70 μm pore size, BioDesign Inc., New York, NY), with the photoreceptors up, and transferred to the experimental chamber, where it was continuously perfused with Ames medium at ˜35°C. In some experiments CoCl2 (2.0 mM) was added to the medium.
The perfusion system design was somewhat unusual for the isolated retina, although a similar design is common for brain slice preparations. Traditionally, an isolated retina rests on the bottom of a perfusion chamber and is completely submerged in flowing perfusion solution. Under these conditions the extracellular space distal to the outer limiting membrane (the subretinal space), which is normally restricted in vivo by the presence of the retinal pigment epithelium (RPE), is open to the perfusate, dramatically reducing light-induced changes of [K+]o in this region. In our chamber, the isolated retina is perfused mostly from the solution that flows through a layer of nylon mesh underneath it. The preparation is on an angle so that perfusate moves by gravity at a flow rate of 0.5 ml/min (i.e., more than the volume of the whole retina per second). Additionally, a very thin film of fluid (˜10 μm thick) still goes over the top (photoreceptor) side of the tissue. To prevent the evaporation of warm solution and drying of the retina, prehumidified gas (95% O2/5% CO2) passes over the tissue at the rate of 5 ml/min. As a result, the retina is supplied with O2 from both sides — from oxygenated perfusion solution in contact with the ganglion cell surface, and from humidified gas from the photoreceptor side. Note that due to the configuration of recordings in the isolated retina the ERG is presented in figures with a polarity which is opposite to conventional recordings (cornea-positive b-wave down; cornea-negative sPIII up).
Flashes of diffuse white light of high scotopic intensity, usually 3 s in duration, were used to evoke local changes in [K+]o and extracellular electrical responses that were simultaneously recorded with double-barreled K+-selective microelectrodes. Fabrication of the K+-selective microelectrodes was similar to that described earlier for fabrication of Ca++-selective electrodes (Dmitriev et al., Reference Dmitriev, Pignatelli and Piccolino1999), but the electrodes were filled with Potassium Ionophore I—Cocktail B (Sigma-Aldrich, St. Louis, MO). Light-induced changes in [K+]o were recorded at different retinal depths (up to 24 depths per individual retina) to obtain the profiles of K+ changes. From 35 isolated retinae 11 good quality K+ depth profiles were collected, and they were similar in the pattern of [K+]o changes across the retina, although slightly different in amplitude. The aim of this work was to compare simulated extracellular MC responses computed based on the K+ measurements with the real voltages, simultaneously recorded in the same tissue at the same retinal depths. Accordingly, the best six K+ depth profiles were chosen to create 3D matrices of K+ changes in the retina ([K+]o vs. retinal depth vs. time), which were used as the data input for the custom-designed computational model of MCs. To achieve a spatial resolution of 1% of retinal depth, the matrix includes the estimated K+ changes that were determined by linear interpolation of values from two spatially adjacent experimental records. Data were acquired at a frequency of 500 Hz, but for computational analysis were reduced to 10 Hz by averaging 50 consecutive data points; thus, the time resolution of the matrix was 0.1 s. Analyzing the data at higher frequency was impractical and unnecessary. It would have significantly increased the size of the data matrix (which in the selected format already had 8100 values of [K+]o), and would not have speeded up the K+ changes, which developed more slowly than the b-wave and were captured completely at 10 Hz.
Three other 3D matrices of K+ changes with the same dimensions were reconstructed from three profiles that were recorded in simplified conditions when all postphotoreceptor light-induced activity, ionic and electrical, was suppressed by Co2+ (2 mM). These matrices were used to determine the optimal electrical parameters of the MC model.
The electrical model of MC
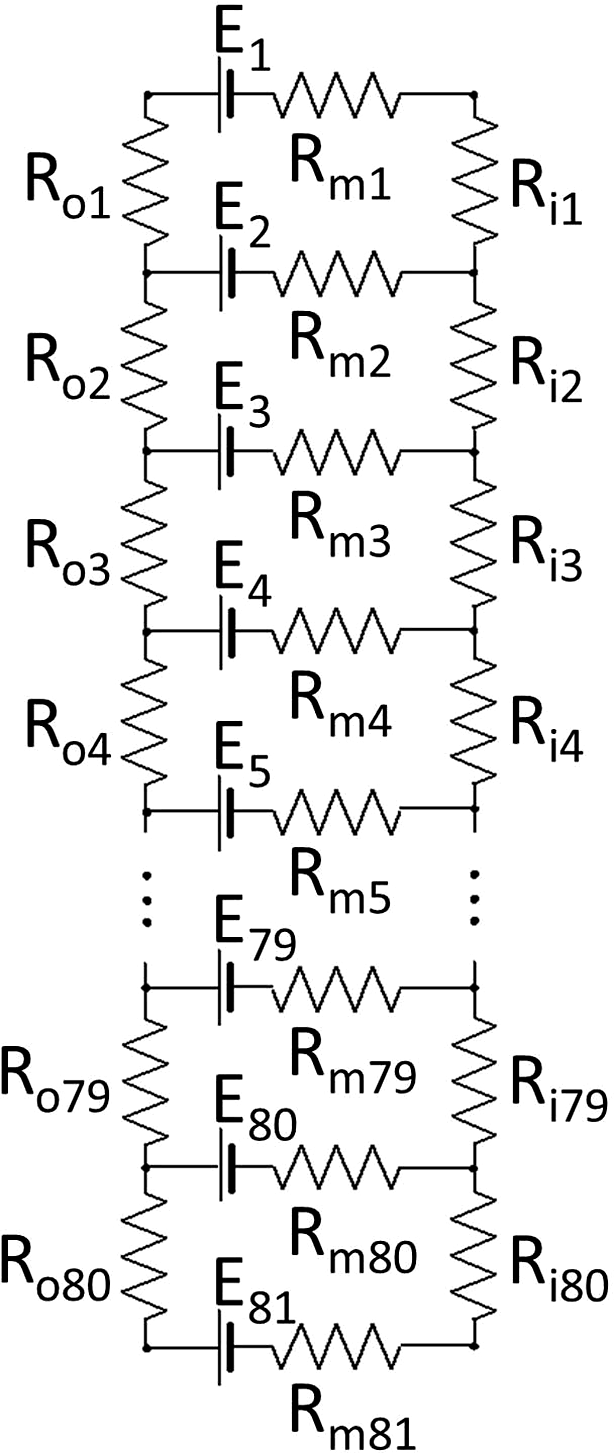
The electrical equivalent cable model (Fig. 1) was used to calculate K+-dependent transretinal potentials generated by MCs. The circuit consists of 81 transmembrane pairs of batteries (Em) and resistors (Rm), 80 extracellular resistors (Ro), and 80 intracellular resistances of MC cytoplasm (Ri). These span 80% of the retina at a resolution of 1% retinal depth, that is, along the entire MC, from the inner limiting membrane to the outer limiting membrane. The circuit does not include any capacitance. Although the results of the model are the changes of the transretinal potential in time, these changes are too slow to be affected by the MC membrane capacitance.
Equivalent electrical model of mouse MC. All explanations are in the text.

MCs possess K+ channels of different types (Bringmann et al., Reference Bringmann, Pannicke, Grosche, Francke, Wiedemann, Skatchkov, Osborne and Reichenbach2006), but the voltage-gated inwardly rectifying K+ channels, Kir, dominate (Newman, Reference Newman1993; Newman & Reichenbach, Reference Newman and Reichenbach1996). Inward rectification can be interpreted as a lower channel resistance for current directed into the cell and a higher channel resistance for current directed out of the cell. However, it seems unnecessary to include this property in the program. Inward and outward currents in the loops generated by MCs in response to K+ changes are always exactly equal to each other, which negates the effect of rectification. The experimentally determined extent of the rectification varies significantly depending on the methods of measurement as well as numerous other conditions: the cell membrane potential, region of the cell (soma or endfoot) tested, retinal area from which the cell was taken (center or periphery), and so forth (Brew et al., Reference Brew, Gray, Mobbs and Attwell1986; Newman, Reference Newman1993; Skatchkov et al., Reference Skatchkov, Krušek, Reichenbach and Orkand1999). Most importantly, in physiological conditions when light-induced changes of [K+]o rarely exceed 1–2 mM (Karowski & Proenza, Reference Karowski and Proenza1977; Steinberg et al., Reference Steinberg, Oakley and Niemeyer1980; Dick & Miller, Reference Dick and Miller1985; Dick et al., Reference Dick and Miller1985; Karwoski et al., Reference Karwoski, Lu and Newman1989) there is not a large difference in the conductance of the K+ channels for inward and outward currents (Skatchkov et al., Reference Skatchkov, Vyklicky and Orkand1995). Accordingly, for the purpose of this computational work, rectification is viewed as an unnecessary complication with no benefit for the results, and it was not included in the model.
The method of calculation was a direct application of Ohm’s law and Kirchhoff’s rules for a complex electrical circuit. Each of the circuit batteries generates a current resulting from the change in extracellular K+ at that location, which branches in all possible loops and runs through all extracellular resistors overlapping with currents from all other batteries. Because of this, about 7000 individual calculations are necessary to resolve the circuit at each time point, but they can be organized with compact computer code (see Supplementary Text S2). This code can be used for an electrical cable in general and has the advantage over the traditional cable equation that it can handle a circuit with any resistor values from 0 to infinity at any position. The same code was used, for instance, for calculation of voltage changes in the Starburst amacrine cell-generated by moving light stimuli (Dmitriev et al., Reference Dmitriev, Gavrikov and Mangel2012).
The values of the batteries and their changes in time were calculated from the matrix of K+ changes that was based on experimental measurements of [K+]o throughout the retina. The steady state extracellular K+ concentration in darkness was assumed to be 3.6 mM in all retinal layers, as in Ames medium; thus Ei,t was determined by the following equation:
where [K+]o,i,t is the matrix of [K+]o (in mM) at each spatial location (index i, corresponding to 1% of retinal depth starting with i = 0 at the vitreal surface of the retina) and at each moment of time (index t, with a resolution of 0.1 s).
The values of the circuit resistors remained constant in time and were determined by calculations based on data available in the literature. The extraction of these values presented a certain challenge, since the range of quantitative parameters obtained from different sources can be quite wide. For instance, the thickness of the retina measured in the same wild type of mouse as we used in our experiments varied from 204 to 260 μm (Ferguson et al., Reference Ferduson, Dominguez, Balaiya, Grover and Chalam2013, Reference Ferguson, Grover, Dominguez, Balaiya and Chalam2014; Berger et al., Reference Berger, Cavallero, Dominguez, Barbe, Simonutti, Sahel, Sennlaub, Raoul, Paques and Bemelmans2014; Dysli et al., Reference Dysli, Enzmann, Sznitman and Zinkernagel2015) depending on the method of measurement, although all used optical coherence tomography.
The location of the OLM, which marks the distal limit of the MC in the retina, also varied in the references cited above (from 71 to 87% of the total retinal thickness). For the model, a value of 80% was chosen (as in Ferguson et al., Reference Ferguson, Grover, Dominguez, Balaiya and Chalam2014); accordingly, the model includes 80 radial elements (Ro and Ri) and 81 transmembrane elements, with Rm1 being the resistance of the MC membrane in the very bottom of the endfoot and Rm2 to Rm81 being the resistances of the cell membrane at each percent of the retinal depth from 1 to 80 until the very distal end. According to Ferguson and coauthors (Ferguson et al., Reference Ferguson, Grover, Dominguez, Balaiya and Chalam2014) the thicknesses of the retinal layers are: RNFL—6%, IPL—28%, INL—16%, OPL—7%, and ONL—23% of the total retinal thickness. Somewhat convenient for this work is that in mouse there is not much variation of thickness or cell density across the retina, in contrast to many other mammals.
Because there is also uncertainty in the values of electrical parameters, it was necessary to do several simulations with different combinations of distributions of Ro, Ri, and Rm, each organized in sets of the model parameters, in order to determine how strongly the results depended on particular choices of those parameters. The values of the model parameters in different sets are defined in the subsequent text.
Extracellular resistance, Ro
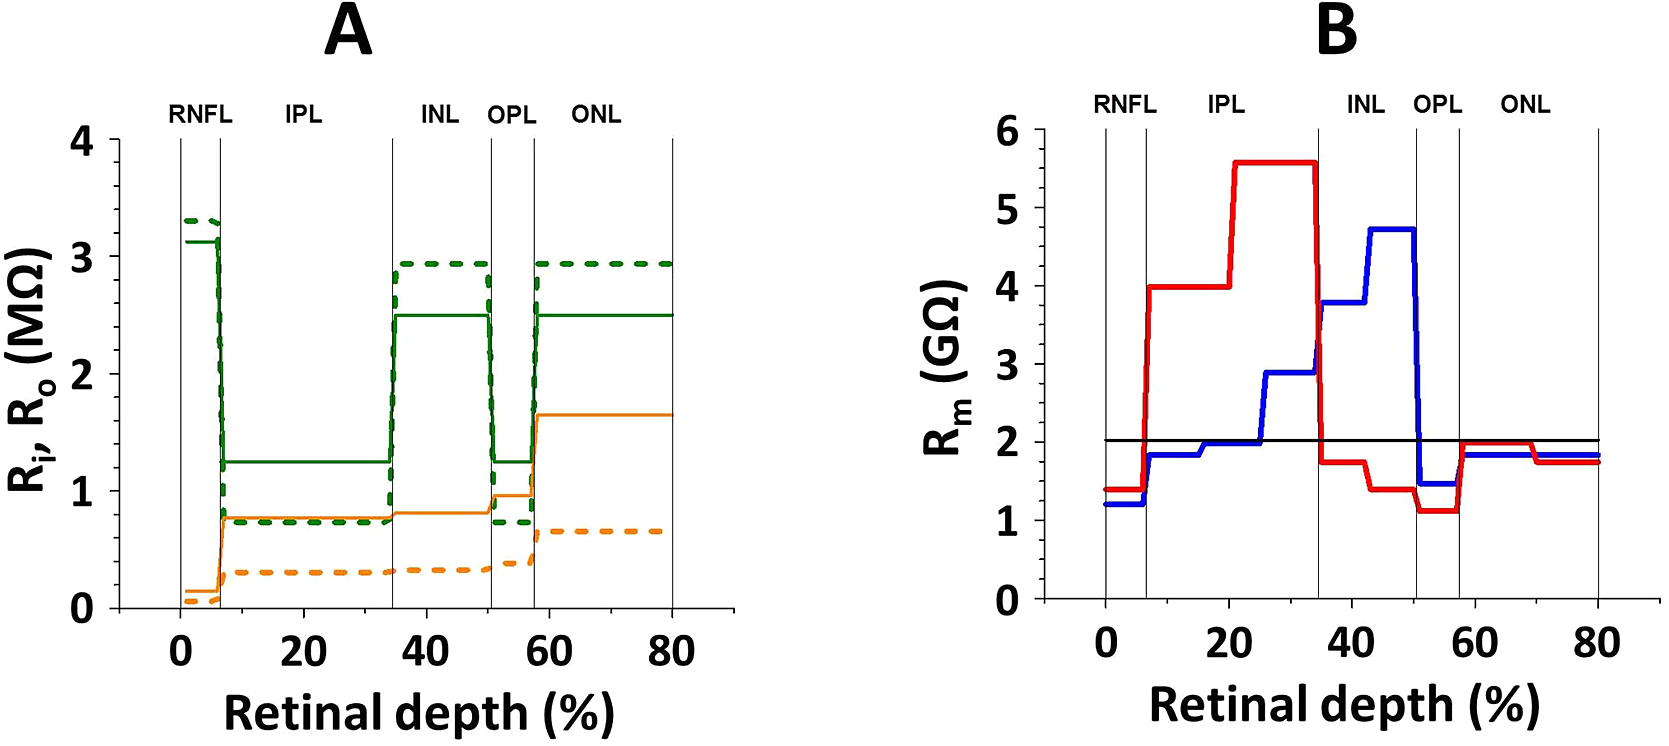
According to electrical measurements (Karwoski et al., Reference Karwoski, Frambach and Proenza1985), the resistivity of the extracellular space in synaptic layers (IPL and OPL) is about four times lower than in the nuclear layers (INL and ONL) and 4.5 times lower than near the MC endfoot in the RNFL. Since the radial resistance of the retina is about 100 Ω/cm2 (Karwoski et al., Reference Karwoski, Frambach and Proenza1985) and the density of MCs in mouse retina is 16,000 cells per mm2 (Chao et al., Reference Chao, Grosche, Biedermann, Francke, Pannicke, Reichelt, Wulst, Muhle, Pritz-Hohmeier and Kuhrt1997), the total resistance of the extracellular space per area occupied by one MC is 160 MΩ. Taking into consideration the difference mentioned above in resistivity between retinal layers, the values of Ro were varied from 3.303 MΩ in the RNFL to 0.734 MΩ in both plexiform layers. This distribution of Ro was used in the model as resistance set o1. An alternative distribution of Ro (set o2) with less drastic differences between resistivity in the layers (2 times less in IPL and OPL than in INL and ONL and 2.5 times less than in the RNFL) was also used. Both sets are graphically illustrated in Fig. 2A and presented in Supplementary Table S1.
Distribution of resistances along the electrical model of mouse MCs. A. The transretinal resistors, extracellular, Ro (green lines) and intracellular, Ri (yellow lines). Dotted lines for set o1 and set i1;solid lines for sets o2 and i2. B. The transmembrane resistors, Rm. Black horizontal line for set m1, a uniform distribution. The blue line is for set m2, extracted from morphometric data of Rasmussen, 1973. The red line is for set m3, extracted from electrophysiological measurements of Newman, 1987. Calculated for Rinp = 25MΩ.

Intracellular resistance of the MC cytoplasm, Ri
Intracellular resistance of the MC cytoplasm, Ri, is expected to be comparable to, but smaller than Ro. The total volume occupied by MCs (from 5 to 14% throughout the retina, except in the nerve fiber layer, RNFL, where the endfoot takes up more than 50%; Rasmussen, Reference Rasmussen1973) is larger than the volume fraction of the retinal extracellular space (from 2 to 11%; Karwoski et al., Reference Karwoski, Frambach and Proenza1985) by a factor of approximately 1.5. Additionally, the coefficient of tortuosity, λ, inside the MC is smaller than in extracellular space by a factor of 1.8 (Newman & Odette, Reference Newman and Odette1984). Tortuosity influences ion diffusion as the square of λ (Nicholson & Phillips, Reference Nicholson and Phillips1981; Nicholson & Rice, Reference Nicholson, Rice, Fuxe and Agnati1991), so that was taken into account here. Thus, it is reasonable to assume that the total resistance of the MC cytoplasm through its length from the endfoot to the microvilli is about 1/5 of the resistance in the surrounding extracellular space (1/(1.5 × 1.82) = 0.206), that is, 32 MΩ. Accepting this total value and a steady increase of the MC intracellular resistance due to the progressive decrease of the MC relative volume from proximal to distal retina (Rasmussen, Reference Rasmussen1973), the individual Ri was varied from 0.060 MΩ in the RNFL to 0.658 MΩ in the ONL (set i1). However, the cytoplasmic resistivity can be 2.5 times higher than the resistivity of the extracellular space (Eberhardt & Reichenbach, Reference Eberhardt and Reichenbach1987); accordingly, in set i2 all Ri were 2.5 times larger than in set i1 (see Fig. 2A and Supplementary Table S1).
Transmembrane resistance, Rm
The distribution of the transmembrane resistance along the MC was assumed to be uniform, with all Rm equal to each other in the simplest case of set m1. In set m2 the Rm distribution was estimated from the data on the variations of the cell membrane surface area in different retinal layers (Rasmussen, Reference Rasmussen1973); the larger the local surface area, the smaller the associated transmembrane resistance of the MC. The values of Rm calculated that way are presented in Fig. 2B (and also in Supplementary Table S2). This approach, however, ignores the real possibility of variation of the K+ channel density along the MC membrane. Alternatively, in set m3 the distribution of Rm was estimated from the amplitudes of MC responses to local puffs of high K+ on different parts of the cell. This is seemingly a better method to evaluate the local transmembrane resistance. The values of Rm calculated from the responses to the K+ puffs on the isolated mouse MC (Newman, Reference Newman1987) are presented in Fig. 2B (and also in Supplementary Table S2). The problem here is that the MC inevitably loses some of its fine processes during isolation, and because of that the local resistance at the area corresponding to both synaptic layers is expected to be overestimated. Fig. 2B demonstrates that the distributions of Rm along the MC calculated on the basis of Rasmussen’s morphometric (blue line) and Newman’s electrophysiological (red line) data are quite different.
The numerical values of the transmembrane resistors obviously depend on total input resistance (Rinp) of the MC. For illustration, the values presented in Fig. 2B are calculated for Rinp = 25 MΩ. There is no agreement in the literature on this subject. Rinp as low as 14.7 MΩ (Newman, Reference Newman1987) and as high as 90.5 MΩ (Reichelt et al., Reference Reichelt, Müller, Pastor, Pannicke, Orkand, Kettenmann and Schnitzer1993) were measured in MCs isolated from mouse retina. A value of 24.7 MΩ was found when Rinp of intact MCs (in the eyecup preparation) was measured (Kofuji et al., Reference Kofuji, Ceelen, Zahs, Surbeck, Lester and Newman2000).
The strategy of computational evaluation of MC
As we can see, some of the model parameters (Ro) can be determined with reasonable confidence, but for others (Rm) only a wide range of values is available. Thus, the first step was to calibrate the model. To do this, the matrices of light-induced changes of [K+]o in the retina treated with Co++ were first used as an input for the program. In this condition, the only source of [K+]o changes was the photoreceptors and the only MC-generated potential was sPIII. Because of the uncertainty noted above, various Rinp were tried to find the best fit between experimentally measured and computationally simulated sPIII in each of 12 combinations of input sets (2 for Ro × 2 for Ri × 3 for Rm). For detailed explanation of the calibration see Supplementary Text S3.
The calibration of the model demonstrated that the combination of resistance sets o2 for Ro, i2 for Ri, and m3 for Rm (o2–i2–m3) with the mean Rinp = 17.3 MΩ produces computed results which fit best to the experimental data. However, the combination of o2–i2–m2 with the mean Rinp = 23 MΩ was almost equally good. That was a bit surprising because set m2, which is based on morphometric measurements (Rasmussen, Reference Rasmussen1973), and set m3, which is based on electrophysiological data (Newman, Reference Newman1987), are strikingly different in distribution of the transmembrane resistances Rm, particularly in the proximal half of the retina (see Fig. 2B). The third best fit was found for the combination of o2–i1–m3 with mean Rinp = 22 MΩ. For computational evaluation of the ability of the MC to generate K+-evoked transretinal potentials in the mouse retina all those three settings (o2–i1–m3, o2–i2–m2, and o2–i2–m3) were used.
Results
Light-induced [K+]o changes in the mouse retina
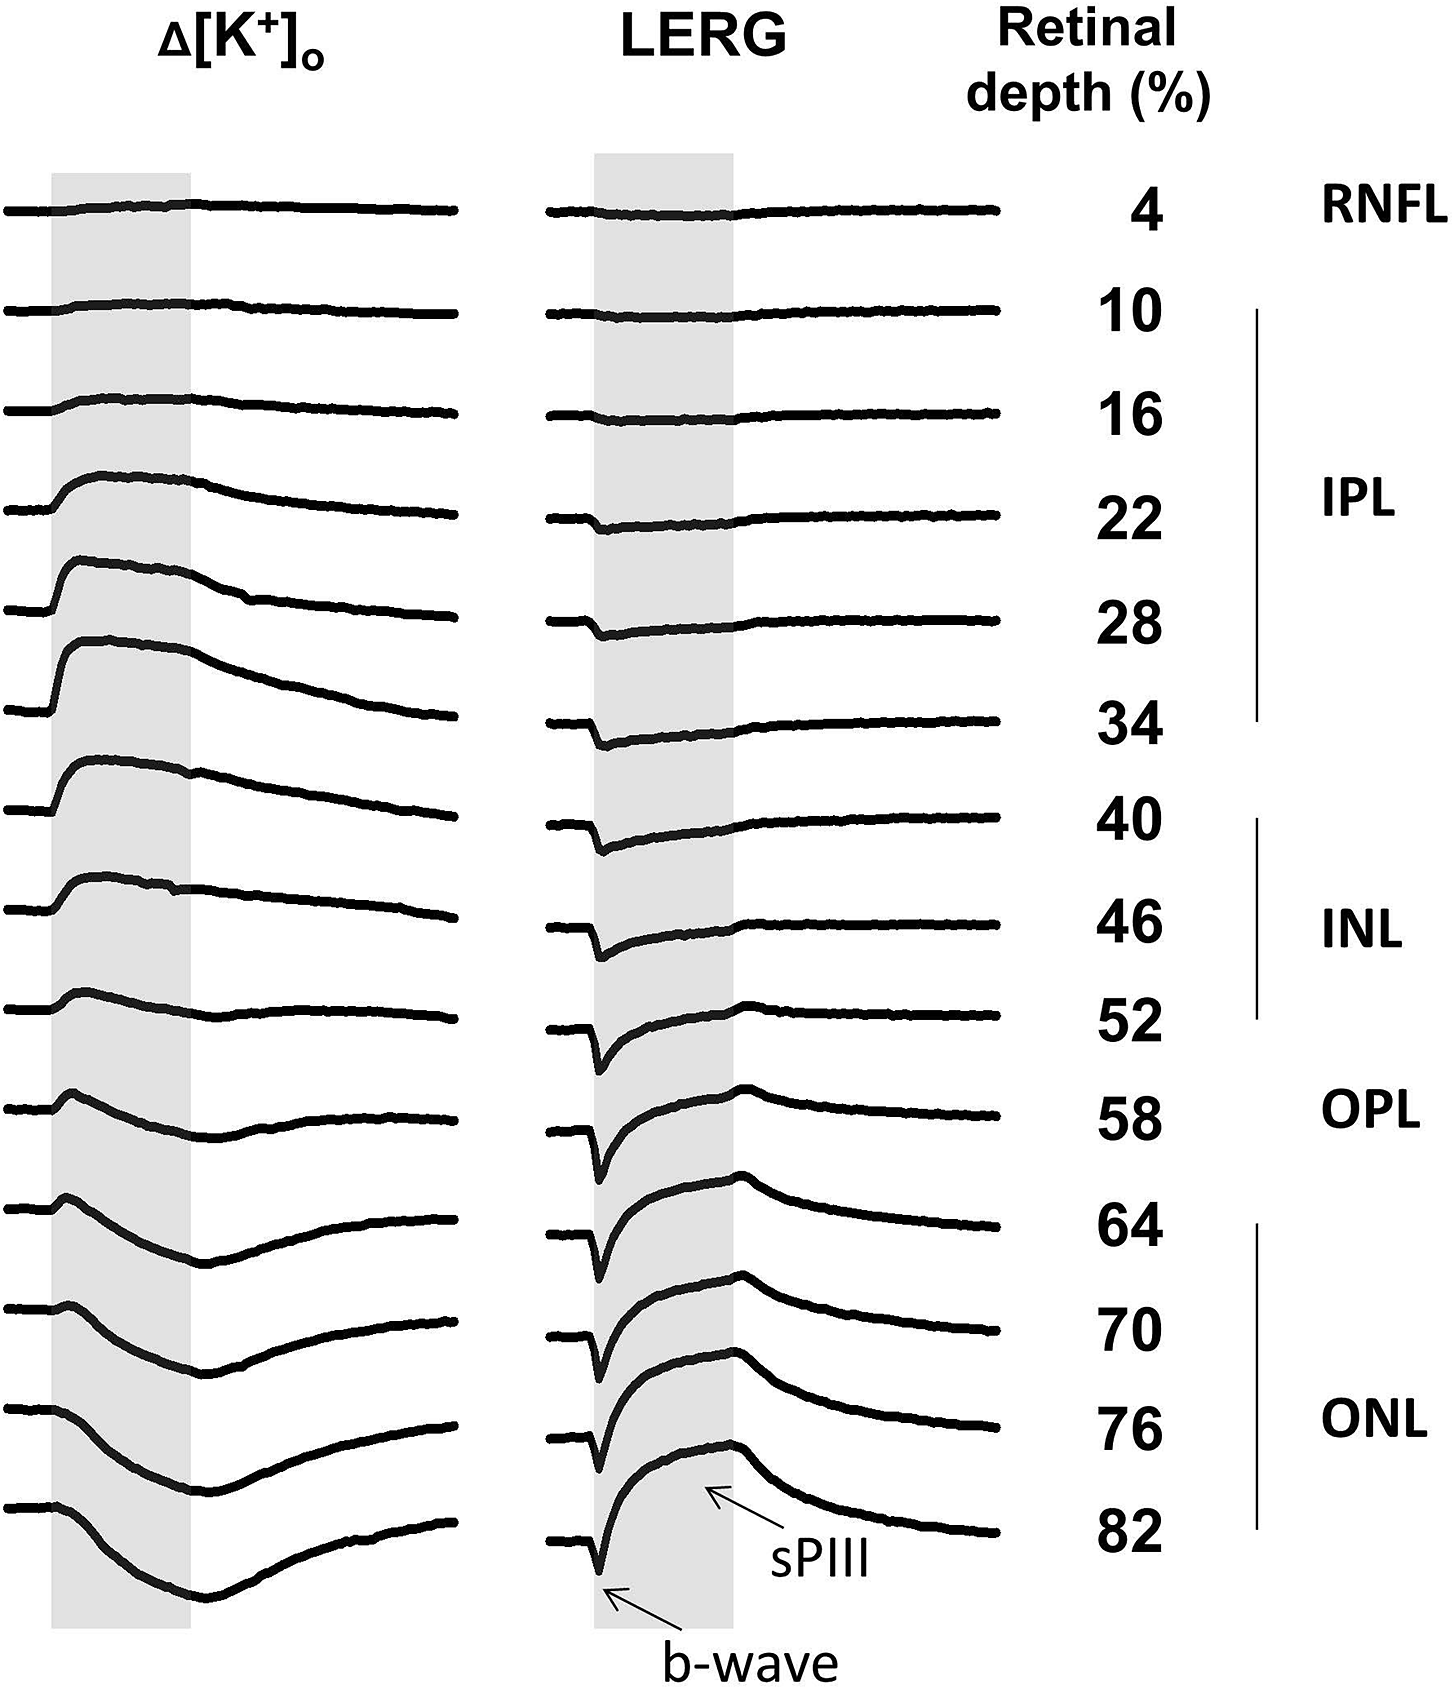
The light-induced [K+]o changes and simultaneously recorded local ERGs (LERGs) at different depths in the mouse retina under dark-adapted conditions are shown in Fig. 3. The LERGs here represent the fraction of the total transretinal ERG that was recorded between the electrode location and the vitreal surface of the retina, which was ground. Due to this recording configuration the b-wave has a negative polarity, as if the cornea were grounded in the intact eye. The amplitude of the b-wave grows as the electrode moves in the distal direction from vitreous to OPL (58% of the retinal depth in the figure), reaching a maximum of 0.819 ± 0.108 mV (mean ± s.e.m., n = 11 sets of recordings like those in Fig. 3 for all statistics in this section). More distally, in the ONL, the amplitude of the b-wave decreases due to overlap with the photoreceptor-generated fPIII, which has the opposite polarity. At the level of the OLM (82% of the retinal depth in Fig. 3) it is 0.412 ± 0.045 mV. At this location sPIII, which is generated by MCs, has the largest amplitude (1.094 ± 0.135 mV). The apparent sPIII amplitude decreases across the ONL (to 0.351 ± 0.091 mV in the OPL) partly due to a decrease of the photoreceptor-generated fPIII which has the same polarity as sPIII. From the INL to the vitreous sPIII overlaps with the dc subcomponent of PII which has the cornea-positive polarity of the b-wave (Brown, Reference Brown1968). In the proximal half of the retina the dc subcomponent is larger than sPIII, so the ERG is cornea-positive at the end of light stimulation.
The depth profile of the light-induced [K+]o changes and local ERGs in the mouse retina. The retinal depth (in %) is measured from the vitreal (grounded) surface of the retina. The grey area marks the light stimulus (3 s in duration). For the amplitude scaling, the space between the start of Δ[K+]o traces is 0.5 mM, and the space between the start of ERG traces is 2 mV. The local ERG (LERG) is presented with a polarity (cornea-negative up) opposite to conventional electroretinography due to the configuration of the recording in the isolated retina. The b-wave and sPIII are labeled at the lowermost LERG. For the reference, the retinal layers are indicated to the right of the retinal depth.

As described in the section “Introduction,” there are three distinct retinal sources of light-induced changes of [K+]o: (a) a large decrease originating in the ONL, (b) a small distal increase around the OPL, and (c) a larger proximal increase which spreads more broadly through most of the IPL and INL. Diffusion and spatial buffering mix the individual [K+]o changes; as a result, the K+ decrease originating in the distal one-third of the retina propagates to other retinal layers. This propagation is not very prominent in the sample presented in Fig. 3, but in four out of the six best K+ profiles a decrease of [K+]o was noticeable as proximally as the RNFL, near the vitreal surface. Despite this mixing, two zones of K+ increases are easily distinguishable by the dynamics of the changes: the distal increase is short-lasting, and the proximal increase has a more sustained character. The distal and proximal K+ increases are also very different in their amplitudes—0.083 ± 0.011 mM for the former and 0.285 ± 0.045 mM for the latter at their maximal depths. The maximum of the distal K+ increase in the mouse retina was localized at an average of 55.2 ± 1.3% of the retinal depth, that is, in the OPL, as in the retinae of other vertebrates, but a fast K+ increase of comparable amplitude appeared both a little distally and proximally to the OPL. The maximum of the proximal increase of [K+]o was found at 35.5 ± 1.6% of the retinal depth, near the border between the INL and IPL, but spreads broadly. The K+ decrease was maximal at the OLM (80–81% of the retinal depth) and had amplitude of 0.501 ± 0.072 mM.
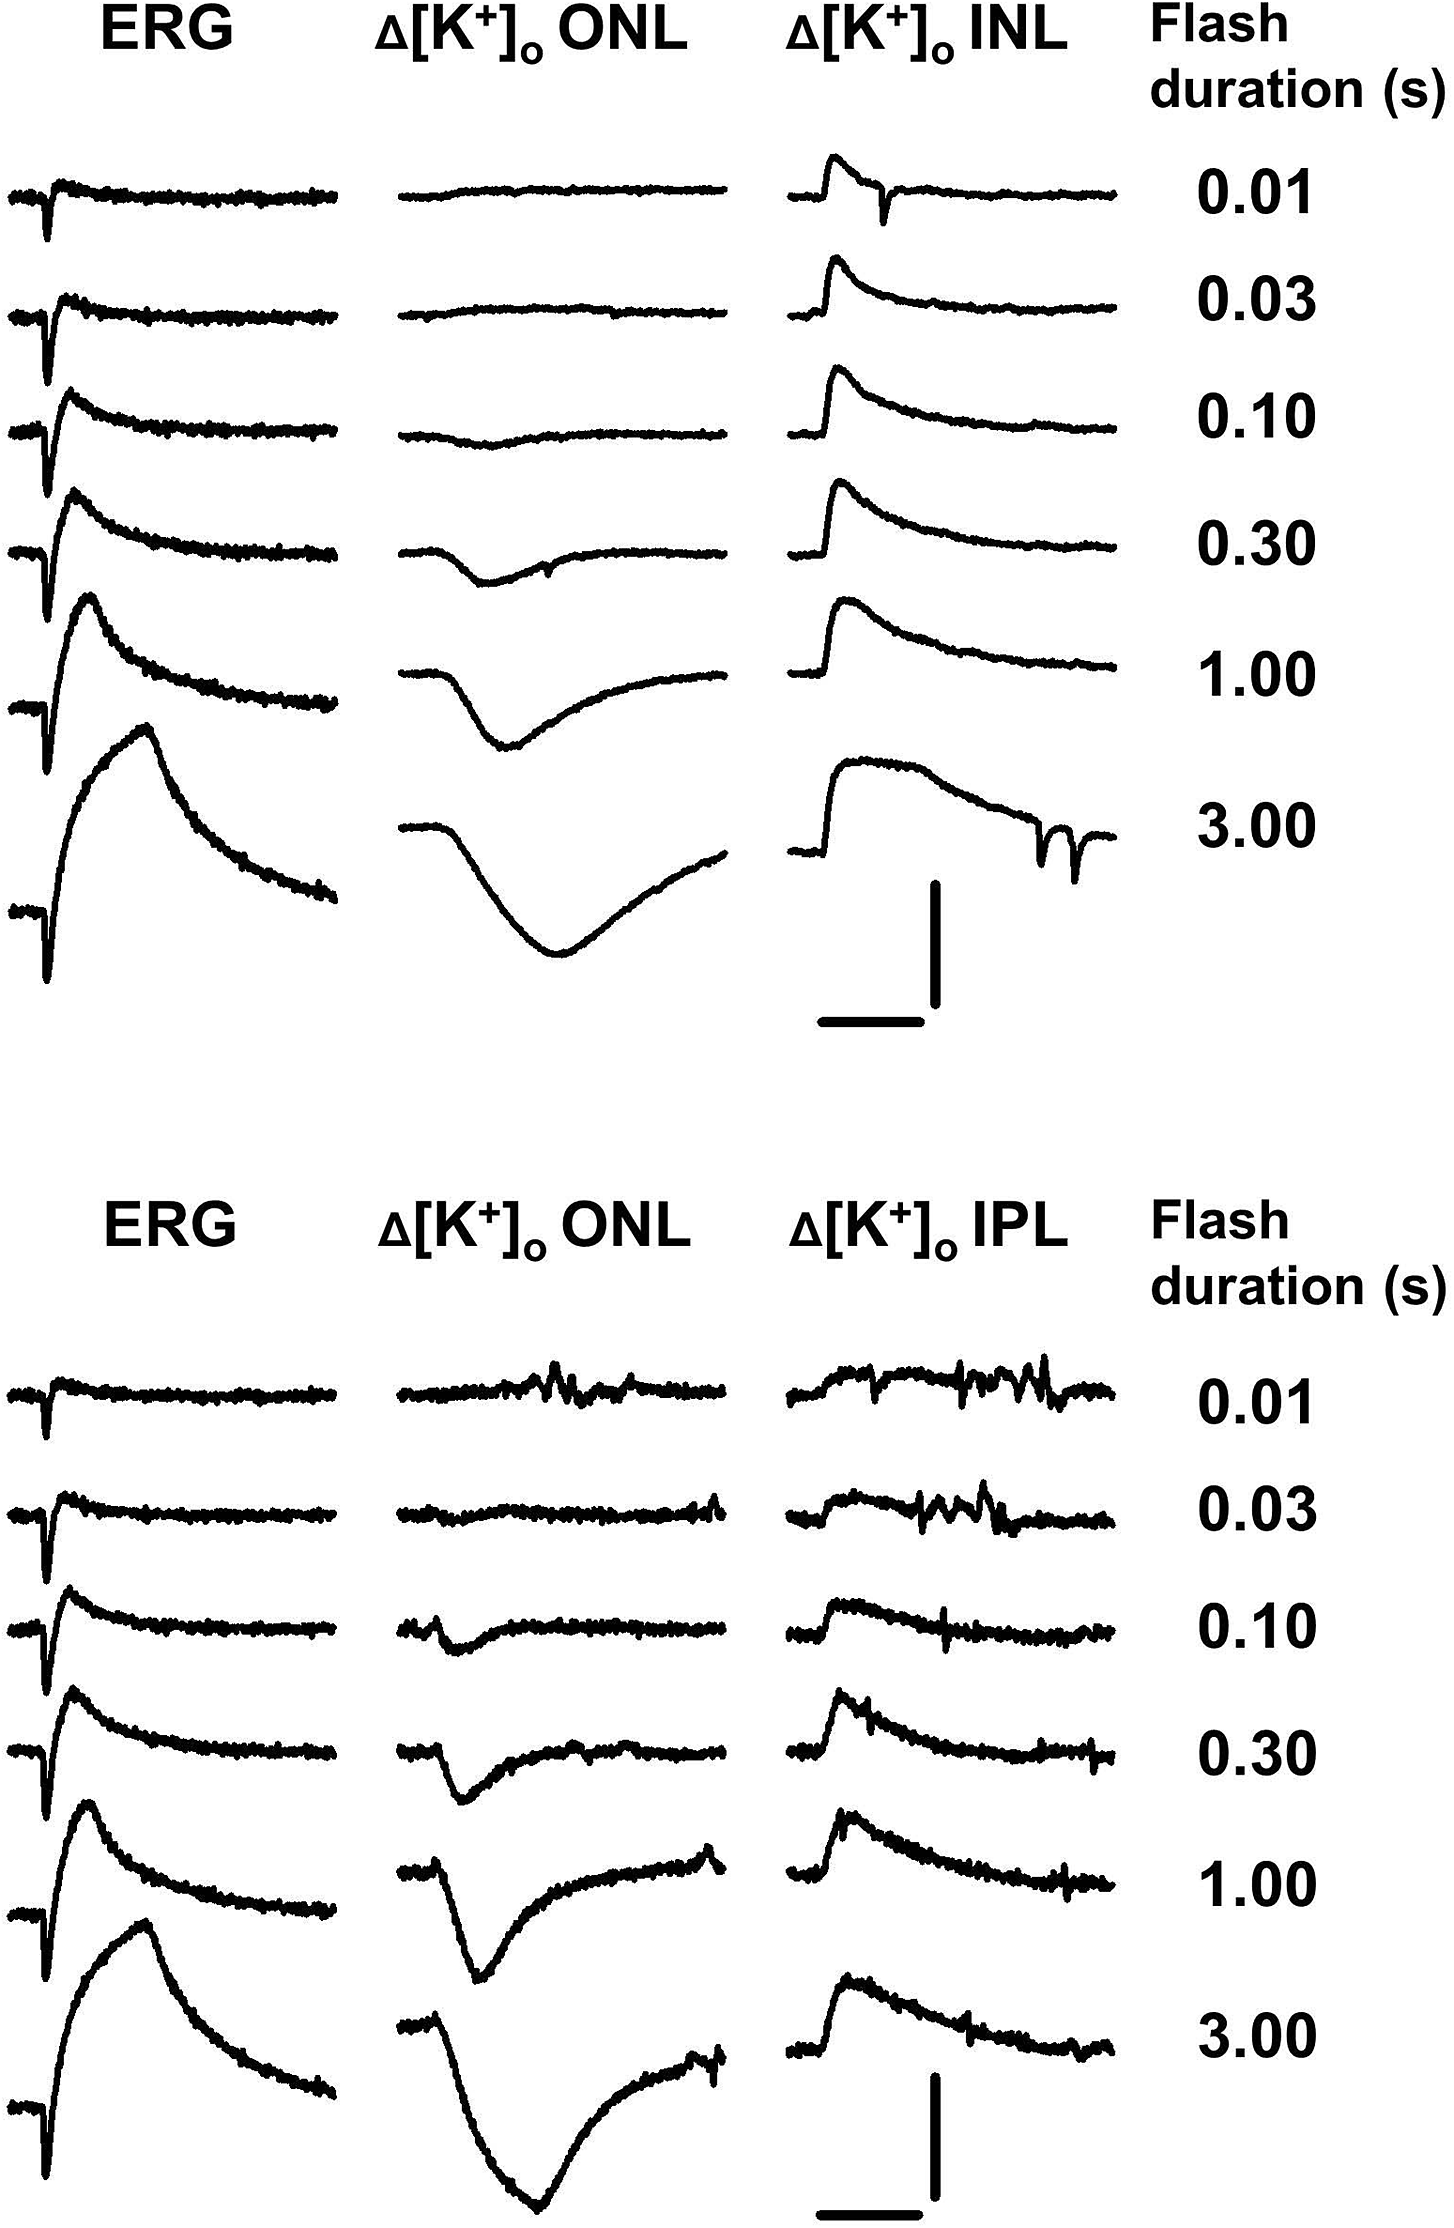
The time to peak is also different for the different K+ changes. The slowly developing decrease of [K+]o reached its peak just after light offset (3 s) and the transient distal and proximal K+ increases peaked at 582 ± 50 and 982 ± 108 ms, respectively. This difference in the dynamics is reflected in a different ability of those K+ changes to temporal summation. Fig. 4 illustrates the dependence of the ERG, the distal K+ decrease, and the proximal K+ increase on the duration of the light stimulus. A light flash of 0.03 s is enough to saturate the amplitude of the b-wave, but the proximal increase of [K+]o measured in both the INL and IPL only saturates with a stimulus of 1.0 s. A stimulus of 3 s in duration is still not enough to completely develop both the distal [K+]o decrease and sPIII.
Time summation of ERG and light-induced changes of [K+]o. ERG and [K+]o changes in distal retina (ONL) were recorded simultaneously; the proximal increases of [K+]o were recorded in separate series with the electrode in the INL (upper part) or IPL (lower part). The records in the upper and lower parts were obtained from different retinas. Scale for vertical bars: 0.5 mM for [K+]o, 1.0 mV for ERG; for horizontal bars: 3 s.

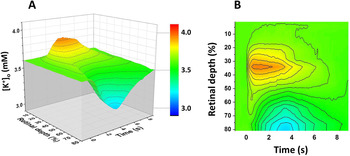
The light-induced changes of [K+]o in isolated mouse retina are well exemplified by the sample shown in Fig. 3. For instance, the amplitudes of the b-wave (0.582 mV at 82% and 0.971 mV at 58% of the retinal depth) and [K+]o increases (0.090 mM proximal and 0.366 mM distal) are close to or a bit larger than the corresponding averages from 11 K+ profiles. The matrix of 8100 [K+]o values was created on the basis of the experimental records in Fig. 3; it is visualized in Fig. 5 as a 3D color map surface (part A) and as a color-filled contour plot (part B). This matrix was used as an input to the program for calculation of the MC electrical response and the results are presented below. Five other matrixes were created from 5 other K+ profiles which were selected as the better samples from the 11 available. They were also used as program inputs.
The matrix of the light-induced [K+]o changes in the mouse retina. A. Visualized as the 3-D color map surface. B. Visualized as the color-filled contour plot. Time= 0 corresponds to the start of the light stimulus that lasts for 3 s. In the dark, [K+]o is assumed to be uniformly 3.6 mM.

K+-dependent MC-generated potential in the mouse retina
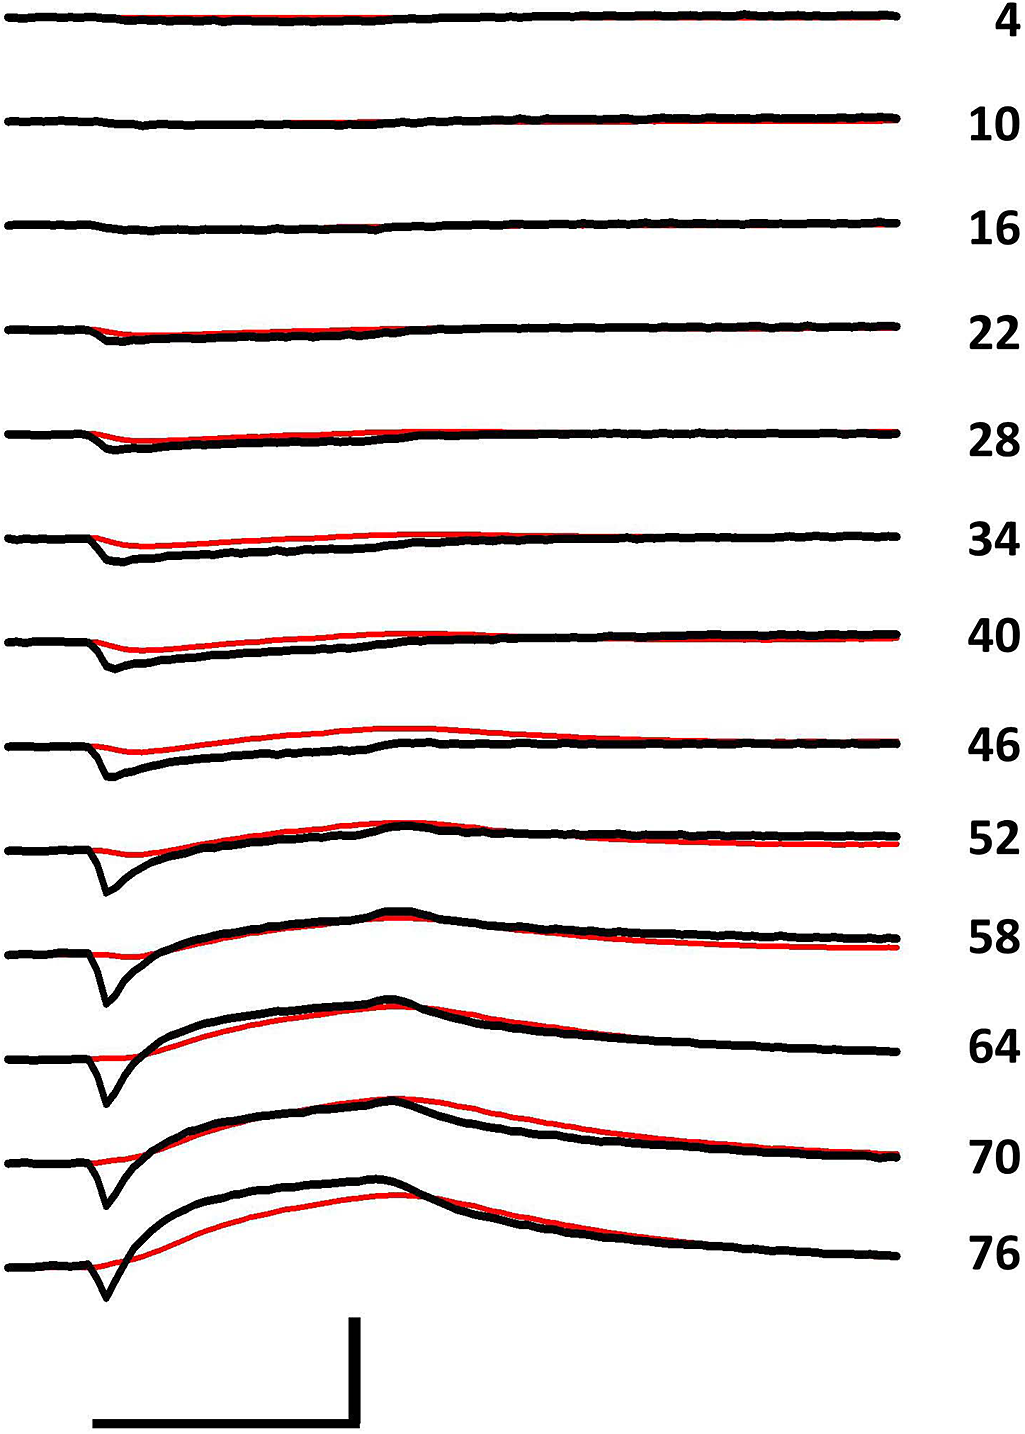
To calculate the transretinal potential generated by MCs in response to light-induced [K+]o changes throughout the mouse retina, the program was loaded with the K+ matrix described above. The program also used the three different sets of resistors that produced accurate simulations of real potentials during the model calibration. The potentials calculated with set o2–i2–m3 are presented in Fig. 6 (red lines), where they are superimposed on the LERGs (black lines) obtained at the corresponding retinal depths in the same retina where data for the K+ matrix were collected.
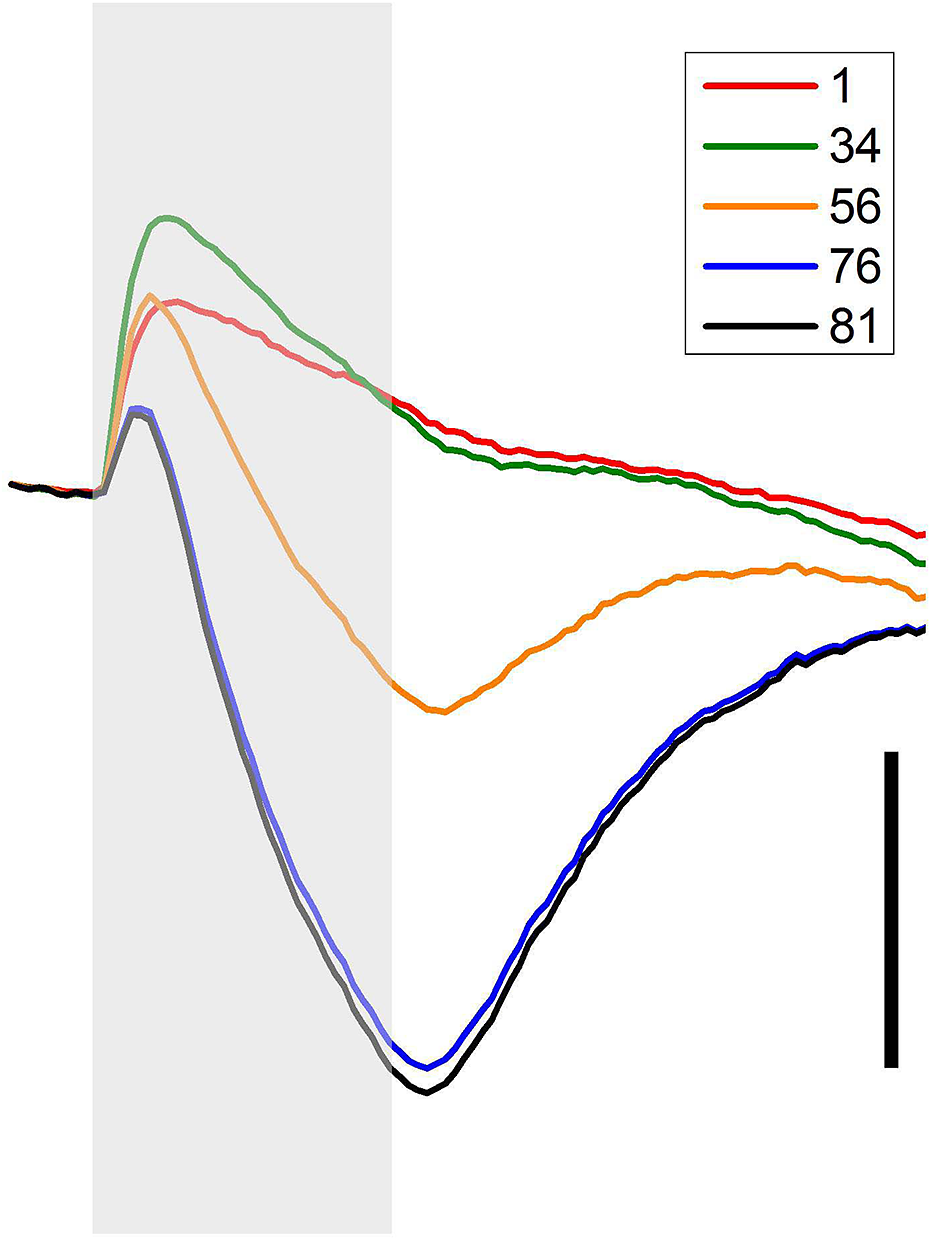
Results of MC response simulations. The calculated responses (red lines) are compared to the real LERGs (black lines) at the same retinal depth. Vertical scale bar: 2 mV; horizontal scale bar: 3 s. The numbers on the right of the traces are the retinal depths (in %) at which they are recorded or calculated.

As expected, the modeled MC generates a cornea-negative (up in this recording configuration) potential with a large amplitude and slow time course, which decreases in more proximal layers. It is also not surprising that the calculated slow potential, which is presumably responsible for sPIII, is not identical in amplitude to the sPIII as we see it in the LERGs. The close similarity between the distal [K+]o decrease, MC hyperpolarization, and sPIII was obvious only in the condition where the extracellular postreceptoral potentials were suppressed and could not interfere with the glial potential (Bykov et al., Reference Bykov, Dmitriev and Skachkov1981; Dmitriev et al., Reference Dmitriev, Bykov and Gavrikov1988). In normal conditions the sustained potential generated by the photoreceptors (fPIII), which has the same polarity as sPIII, is added to it in the ONL and this effect is the greatest in the most distal location (76% of the retinal depth in Fig. 6), where the fPIII is the largest. In more proximal layers (IPL, 46–34% of the retinal depth), the cornea-positive dc subcomponent of PII overlaps with sPIII, so in this region also the MC response does not match the ERG.
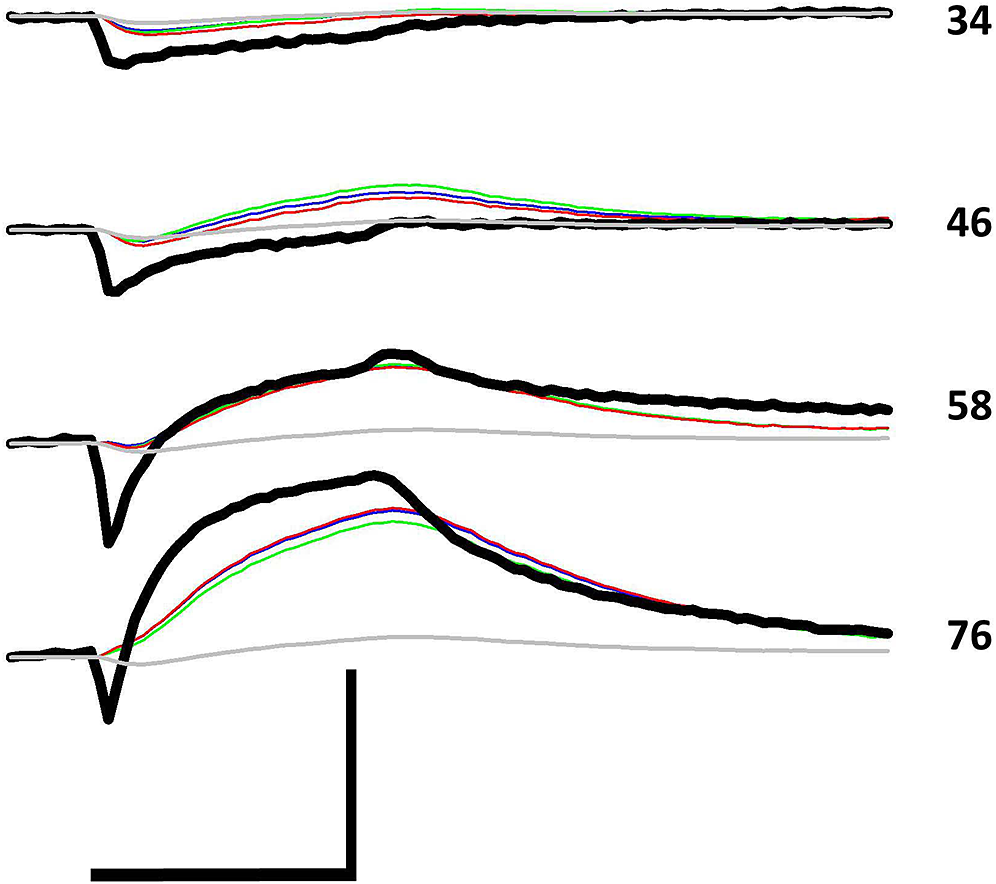
In Fig. 7, the selected real LERGs from four critical depths were compared with corresponding calculations that used different sets of parameters. It is remarkable that, although three sets of the realistic parameters (o2–i1–m3 with Rinp = 22 MΩ, blue lines; o2–i2–m2 with Rinp = 23 MΩ, green lines; and o2-i2-m3 with Rinp = 17.3 MΩ, red lines) were quite different in the distribution of the transmembrane and intracellular resistances of the modeled cell (see Fig. 2), the calculated potentials were very similar at all retinal depths. Thus, we can conclude that the model is robust and not overly sensitive to variations in resistance distributions within realistic limits. The results of calculations depend mostly on localization and amplitude of [K+]o changes, that is, on the most reliable data in our possession.
The real LERGs (black lines) are compared to the results of calculations for the same retinal depth, but with four different sets of parameters: o2-i1-m3 with Rinp= 22 MΩ (blue lines), o2-i2-m2 with Rinp = 23 MΩ (green lines), o2-i2-m3 with Rinp = 17.3 MΩ (red lines), and o2-i2-m4 with Rinp = 20 MΩ (grey lines). Vertical scale bar: 2 mV; horizontal scale bar: 3 s. The numbers on the right of the traces are the retinal depths (in %) at which they are recorded or calculated.

Of course, it does not mean that the results of the model calculations are not affected at all by the distribution of K+ conductance along MC. The fourth set (o2–i2–m4, gray lines) represents a case when 95% of K+ conductance is concentrated in the endfoot (20% in Rm1, 15% in each of Rm2 to Rm6, and the remaining 5% divided equally among the other 75 Rm). Such an extremely uneven distribution was demonstrated in isolated amphibian MCs (Newman, Reference Newman1984, Reference Newman1985), but is strictly different from what was found in isolated mammalian MCs (Newman, Reference Newman1987), and what was used as our set m3 for the transmembrane resistors. Fig. 7 shows that concentration of K+ conductance in the MC’s endfoot (and away from [K+]o changes) results in a dramatic decrease of glial potentials (for a theoretical explanation, see Supplementary Text S1). The calculated sPIII is much smaller than the real sPIII with realistic values of Rinp (20 MΩ, gray lines in Fig. 7), and the calculated amplitude could be close to the real sPIII only with an impossibly low Rinp (<1 MΩ, data not shown).
The important result of the simulations is that the MC does not contribute to the b-wave, as is evident from the comparison of the real LERG and computed MC responses at 76% retinal depth (the bottom traces in Figs. 6 and 7). At this depth (the distal part of ONL, close to OLM) the LERG is almost identical to the transretinal ERG. (The difference is that the LERG at this depth is missing a most distal part of the extracellular photoreceptor response.) There is no visible contribution to b-wave from the MC also at 58% of the retinal depth where the b-wave has maximal amplitude. In more proximal layers the amplitude of the slow wave generated by MC decreases. Also, in the proximal layers, an intraretinal cornea-positive component of the MC response became noticeable. It peaked at 34–40% of the retinal depth, that is, near the maximum of the proximal [K+]o increase, and is obviously related to it, but more detailed analysis is needed to determine the contribution of different sources of [K+]o changes to the positive and negative aspects of the MC-generated potential.
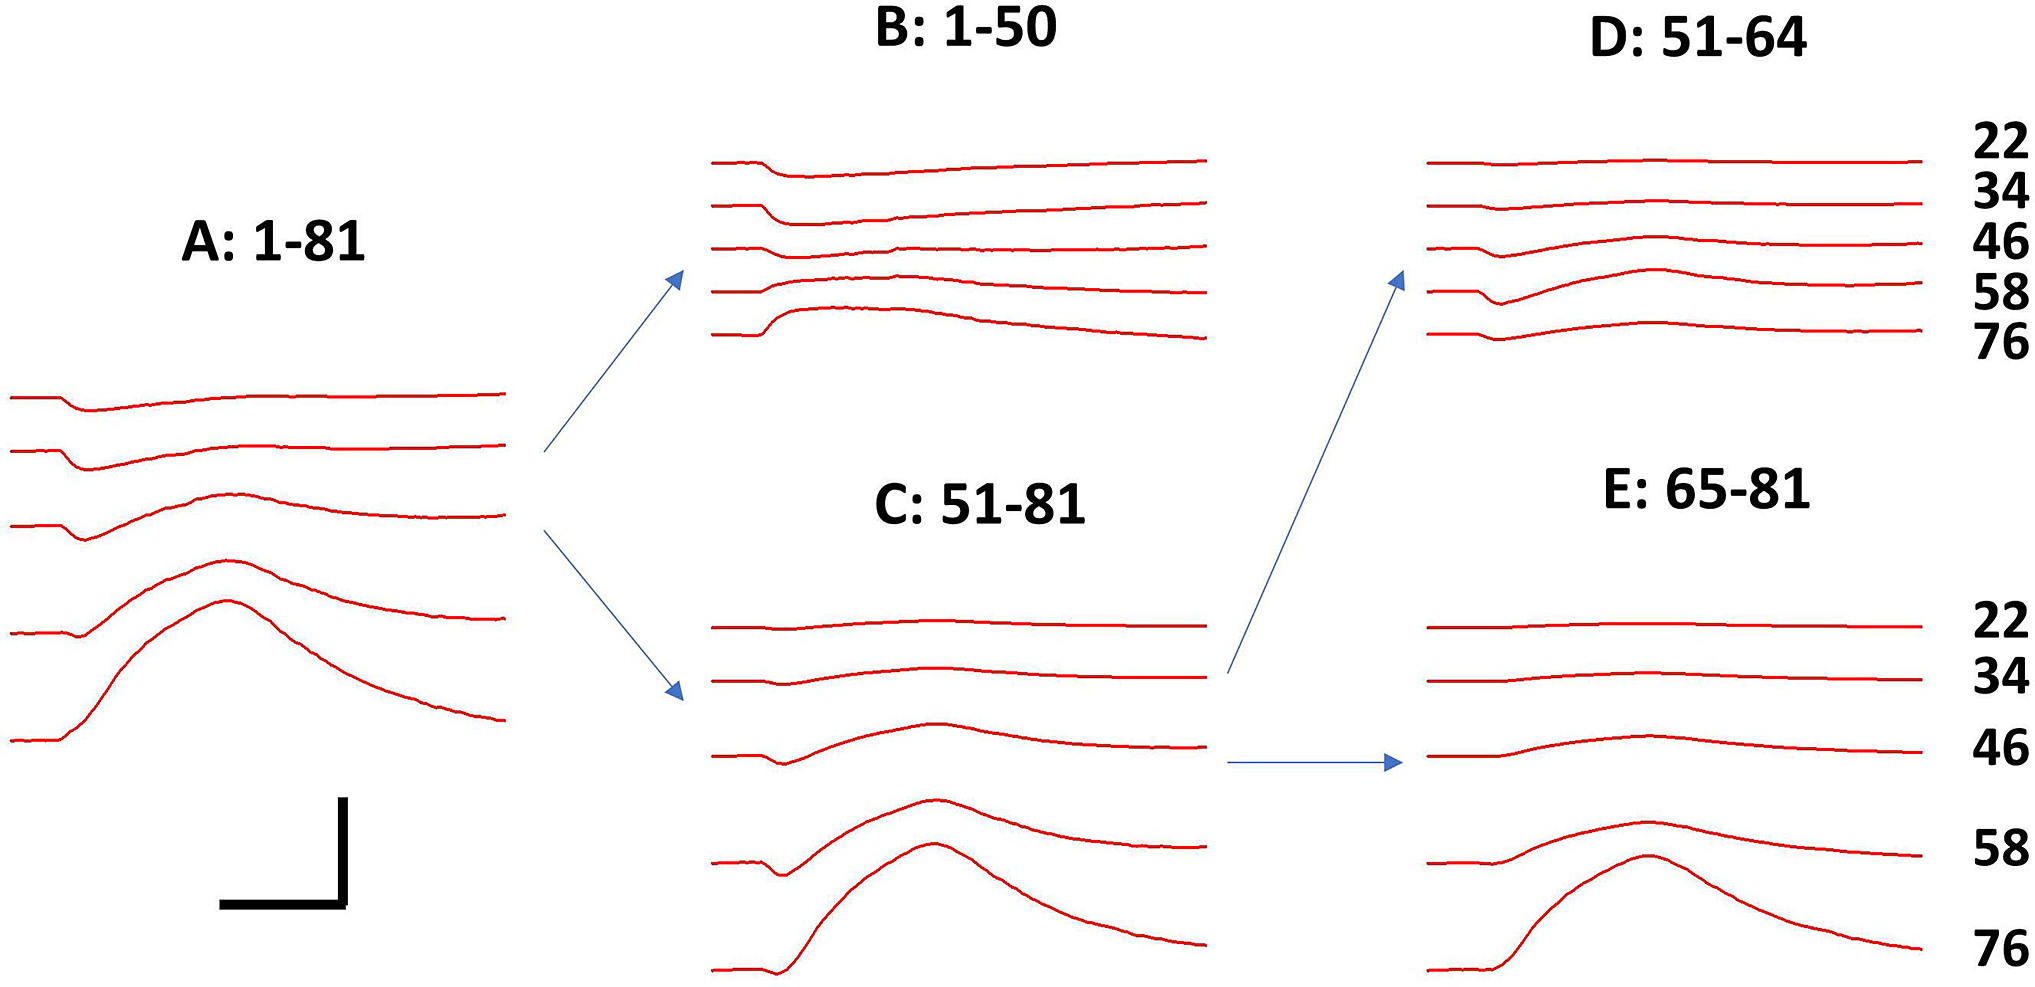
To dissect the MC responses evoked by the three principal K+ changes—the distal decrease, the distal increase, and the proximal increase—from the total transretinal MC-generated voltage, the input [K+]o matrix was modified in such way that only changes in the layers of interest were included, but in all other locations [K+]o remained 3.6 mM at all times. In Fig. 8A, selected simulations from Fig. 6 (at 22, 34, 46, 58, and 76% of the retinal depth, from top to bottom) are presented for comparison. In Fig. 8B, the MC responses at the same retinal depths were calculated in conditions when only the proximal [K+]o increases (from 1 to 50% of the retinal depth) were included. The changes of [K+]o in the distal 31% (from 51 to 81% of the retinal depth), which were ignored in part B, were responsible for the MC voltages presented in Fig. 8C. These MC potentials resulted mostly from the distal decrease, but with some participation from the distal increase. To determine the contribution of this distal increase, only [K+]o changes around the OPL (from 51 to 64% of the retinal depth) were included (Fig. 8D). Finally, MC responses resulting from the [K+]o decrease near the distal end of the cell (65–81% of the retinal depth) was calculated (Fig. 8E).
The K+ source-dependent components of the MC’s transretinal response. The numbers in the labels for parts of the figure are the retinal depths (in %) at which changes in [K+]o were taken into account, when [K+]o in all other layers remained unchanged. The calculations were performed with the set o2-i2-m3, Rinp = 17.3 MΩ. Vertical scale bar: 2 mV; horizontal scale bar: 3 s. The numbers on the right of the traces are the retinal depths (in %) at which they are calculated.

Thus, Fig. 8 illustrates separate contributions of the proximal K+ increase (part B), the distal K+ increase (part D, during the first second of light stimulation), and the distal K+ decrease (mixed with the proximal increase in part C and detached from it in part E) in comparison to the total MC response (part A). It is evident that the K+-dependent MC-generated transretinal potential depends mostly on the distal [K+]o decrease, largely from the decrease in the very distal part of the MC (65–81% of the retinal depth, Fig. 8E). On other hand, very little contribution comes from either of [K+]o increases. For the large proximal K+ increase that contribution consists of a small cornea-negative MC potential (bottom trace in Fig. 8B), which is opposite in polarity to the b-wave. It slightly accelerates the development of sPIII in the first 0.5 s after light onset. The voltage evoked by the distal increase is cornea-positive (initial part of the bottom trace in Fig. 8D), but it is barely visible and has no noticeable effect on the ERG.
In addition to the sample described in section above, five other K+ matrixes were created based on profiles of light-induced changes of [K+]o collected from five other retinae. These matrixes also were analyzed with our program and results are summarized in Supplementary Figs. S1–S5. The data were slightly variable in details (magnitudes and locations of K+ changes, amplitudes of ERG components), but are all consistent in the general result — that MCs are responsible for the sPIII component of the ERG, but do not contribute to the b-wave.
Discussion
In this work, comprehensive data on light-induced changes of [K+]o as a function of depth in the mouse retina were collected. These data were used as an input to a computational model of the mouse MC. The distributions of the transmembrane resistances along the length of the MC and the transretinal resistances both outside and inside the cell were extracted from existing literature, and 12 reasonable settings were assembled. Experimental measurements in simplified conditions (under Co++) where the photoreceptors were the only source of the light-induced [K+]o changes were used to calibrate the model. As a result of the calibration, three combinations of local membrane, extracellular, and intracellular resistances that gave the best resemblance between experimental and computational results were determined (For details on the model calibration, see Supplementary Text S3). The computational model with these best choices of resistors was then used to calculate the K+-dependent MC-generated transretinal potential based on light-induced [K+]o changes that were recorded in the mouse retina under normal dark-adapted conditions. Finally, the computer simulations were compared with the real electrical recordings obtained on the same six retinae from which the K+ data of the best quality were collected.
The computational analysis confirmed the glial nature of the slow PIII component of the ERG. The simulations also showed that the MC has no significant contribution to the b-wave, another ERG component which for a long time was at least in part associated with MCs.
It is important to mention that the three settings of resistance parameters that were used in the calculations were very different in the distribution of K+ conductance along the modeled MC, particularly in its proximal half (Fig. 2B) and in the values of the MC intracellular radial resistance (Fig. 2A). Nevertheless, this difference had little effect on the results, demonstrating that the locations and amplitudes of light-induced changes in [K+]o are the factors that are most responsible for the MC contribution to the transretinal potential. As was described in the section “Introduction,” the unfavorable location of the proximal K+ increase and the small amplitude of the distal K+ increase are among the reasons for doubting the ability of MCs to generate a significant extracellular potential of cornea-positive polarity, like the b-wave. Additionally, changes in [K+]o developed too slowly, and the b-wave survived the application of Ba++, which blocks all K+-evoked MC responses. For a long time now On-bipolar cells have been widely accepted as a main generator of the b-wave (Stockton & Slaughter, Reference Stockton and Slaughter1989; Gurevich & Slaughter, Reference Gurevich and Slaughter1993). Still, the contribution of MCs to the b-wave is often suggested, and the theoretical possibility of it is noted in papers of the 1980s and 1990s. After all, the b-wave was indeed present in the ERG of mice with a Kir4.1 knockout, but it had smaller amplitude than the b-wave in control mice (Kofuji et al., Reference Kofuji, Ceelen, Zahs, Surbeck, Lester and Newman2000). It was thought that MCs could contribute some to the b-wave, but the question was: how much? This work offers a quantitative answer: the sPIII is the only substantial MC-generated potential in the ERG of the mouse.
But how does the MC, which generates a large (more than 1 mV in amplitude) sPIII in response to the distal light-induced [K+]o decrease, produce only a barely noticeable extracellular voltage in response to the proximal [K+]o increase, which is similar in amplitude? To better understand this, let us look at intracellular responses of MCs evoked by [K+]o changes across the retina (Fig. 9). These are the calculated intracellular voltages that resulted in the transretinal potentials presented in Fig. 6. At all depths from the very proximal to the most distal the intracellular responses consist of an initial depolarization followed by a hyperpolarization (note that the response in the distal end of the MC (81%) was practically identical to the response at 76%, which is the most distal location presented in Fig. 6). The largest depolarization of the MC membrane is located near the maximum of the proximal [K+]o increase at 34% retinal depth. The depolarizations both proximally and distally to it are smaller in amplitude, which means that the electrical current resulting from this [K+]o increase runs in two opposite directions, generating extracellular voltages that cancel each other. As mentioned before, the localization of the proximal increase of [K+]o close to the middle of the MC puts it in a very unfavorable position to produce a significant extracellular potential. On the contrary, a decrease of [K+]o located near the distal end of the MC occupies the most advantageous place for this purpose, and the hyperpolarization steadily decreases along the MC length in the proximal direction. Thus, the location of these two large sources of [K+]o changes determines that only one of them is capable of producing a significant transretinal potential. The third source of a possible MC response — the small, short-lasting, and spatially restricted distal [K+]o increase — is not big enough to transform its somewhat favorable location into a perceptible impact on the extracellular potential, as is evident from the bottom trace in Fig. 8D.
Intracellular responses of modelled MCs to light-induced [K+]o changes at different depths in the mouse retina. The numbers to the right of the color traces are retinal depth (in %) at which the transmembrane potential was calculated. Vertical scaling bar: 3 mV.

An extracellular potential generated by MCs in response to the proximal increase of [K+]o was recorded and discussed in the literature as the M-wave (Karowski & Proenza, Reference Karowski and Proenza1977; Sieving et al., Reference Sieving, Frishman and Steinberg1986; Katz et al., Reference Katz, Wen, Zheng, Xu and Oakley1991). But the M-wave is an intraretinal potential, that is, a potential recorded across part of the retina, when the transretinal voltage related to one branch of the K+ current was recorded while the voltage of opposite polarity produced by the current running in the other direction was excluded. The voltages related to the M-wave are simulated in Fig. 8B. The largest cornea-positive M-wave is co-localized with the maximum of the proximal increase of [K+]o at 34% of the retinal depth; the larger amplitude cornea-negative potential would be recorded between an electrode at this depth and ground on the receptor side of the retina. As a result, the total transretinal potential generated by MCs in response to the proximal increase of [K+]o is cornea-negative (the lowest trace in Fig. 8B) and opposite in sign to the b-wave of the ERG. The M-waves described in the literature are larger than presented here, because they were recorded under conditions of light adaptation and local stimulation with small-sized spots of light that significantly enhanced the proximal increase of [K+]o and almost eliminated the distal decrease of [K+]o. Still, the M-wave was a local intraretinal potential, substantial in intraretinal recordings, but barely noticeable in the transretinal ERG.
As a final note, the model described in this paper used cell parameters and K+ measurements appropriate for the mouse retina. However, a generally similar distribution of the transmembrane K+ resistance along the MC (Newman, Reference Newman1987) and light-induced K+ changes (Steinberg et al., Reference Steinberg, Oakley and Niemeyer1980; Dick et al., Reference Dick, Miller and Bloomfield1985; Dmitriev et al., Reference Dmitriev, Henderson and Linsenmeier2016) was demonstrated for cats, rabbits, and rats meaning that the conclusions of this work can be extended at least to other mammals. Whether it is applicable to the amphibian, for which a drastically different distribution of K+ conductance along the MC (95% of all conductance concentrated in the endfoot) was demonstrated (Newman, Reference Newman1984), remains to be investigated.
Acknowledgment
This work was supported by the National Institutes of Health (grant R01EY029306).
Author contributions
A.V.D.: Conceptualization, experiments, software, and writing. A.A.D.: Experiments and software. R.A.L.: Writing.
Supplementary data
To view supplementary material for this article, please visit https://doi.org/10.1017/S0952523821000092