


Introduction
Ice sheets play an important role in the Earth’s climate system and water cycle. Antarctica stores ∼ 70% of the Earth’s fresh water. It its therefore of interest to understand the present state of the East Antarctic ice sheet (EAIS) to estimate future changes in its surface mass balance (Reference Lemke and SolomonLemke and others, 2007). However, estimating the mass balance of the EAIS remains a challenge. The most applicable method for studying such extensive areas as ice sheets is using active and passive remote sensing such as radar or laser altimetry (Reference ZwallyZwally and others, 2005; Reference Wingham, Shepherd, Muir and MarshallWingham and others, 2006) or optical satellite images such as the Mosaic of Antarctica (MOA; Reference Scambos, Haran, Fahnestock, Painter and BohlanderScambos and others, 2007). Several different sensors such as the Cryosat-2 (Reference Drinkwater, Francis, Ratier and WinghamDrinkwater and others, 2004) are available to monitor the EAIS regularly. In order to accurately interpret remotely sensed information on snow, ground observations and in situ measurements are needed that capture the spatial heterogeneity of snow properties over vast areas such as the EAIS. Traverse expeditions provide a unique opportunity to collect ground-truth data for validation of remotely sensed data on snow properties. However, validation of remotely sensed data on snow properties in remote areas such as the EAIS is often limited by the availability of field-observed snow properties that cover large areas and the temporal validity of both the field-observed snow properties and the remote-sensing data since snow conditions can change quite rapidly.
The surface snow conditions in Dronning Maud Land (DML), part of the EAIS, have been of interest and under investigation since the 1950s (Reference LiljequistLiljequist, 1957). As early as 1955, Schytt investigated snow accumulation patterns, snow albedo and snow particle size on the EAIS (Reference SchyttSchytt, 1958). During the International Polar Year (2007–09), the Japanese–Swedish Antarctic Expedition (JASE) 2007–08 traversed the EAIS (Reference FujitaFujita and others, 2011), which provided a unique opportunity to investigate snow properties such as snow particle size and snow surface hardness across a large area. The motivation for determining these snow properties along the route was to aid the interpretation of remote-sensing data since parameters such as snow particle size strongly affect the scattering properties of the snowpack and the reflectivity from the snow surface (Reference Wiscombe and WarrenWiscombe and Warren, 1980; Reference Ulaby and DobsonUlaby and Dobson, 1989; Reference FierzFierz and others, 2009). The effect on scattering properties requires sound knowledge of snow particle-size parameters to correctly interpret synthetic aperture radar (SAR) data (Reference Shi and DozierShi and Dozier, 2000). Furthermore, Reference Wiscombe and WarrenWiscombe and Warren (1980) showed that an increase in snow particle size reduces the albedo of the snow surface, which in turn strongly affects the energy budget of the Earth’s surface (Reference Lemke and SolomonLemke and others, 2007).
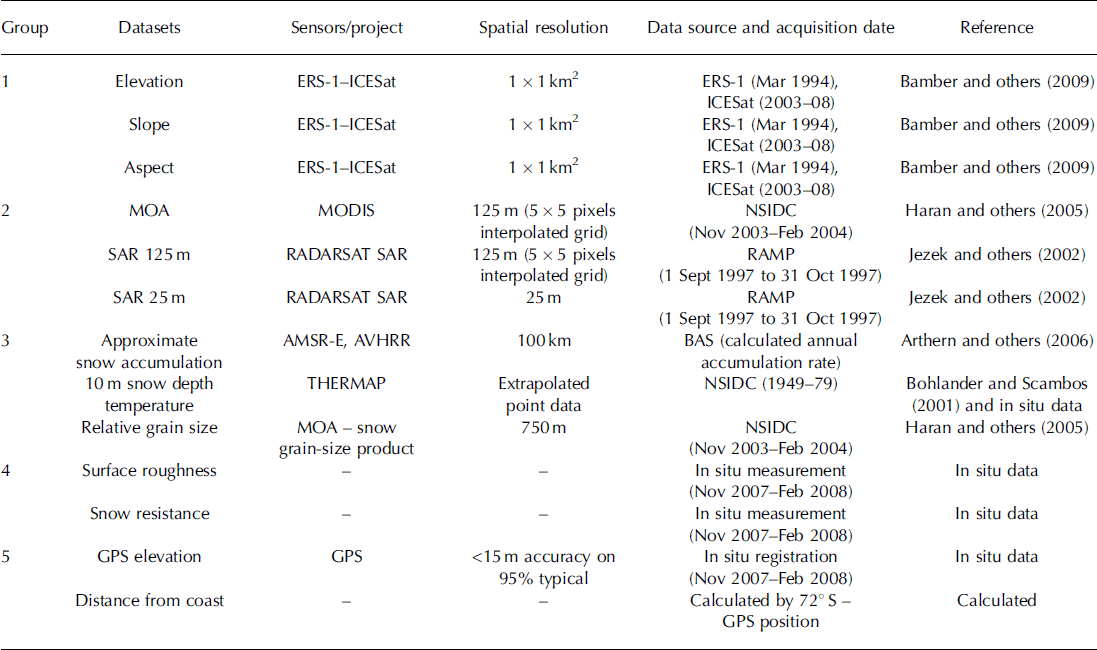
The objective of this study was to evaluate different spatial datasets such as remote-sensing and topography-derived data for their usability to extrapolate point information of field-observed snow particle-size data. Our hypothesis is that the topographic characteristics of DML will affect the correlation between our spatial datasets and the data on snow particle sizes. Here the term ‘snow particle’ is used because the applied field method for estimating size, area and shape metrics of snow grains does not support the distinction between polygranular crystals and polycrystalline grains (i.e. essentially single crystals from aggregated crystals; Reference Sommerfeld and LaChapelleSommerfeld and LaChapelle, 1970). The objective of this study is motivated by the need to extend the existing body of studies that validate remote-sensing data of snow with field-measured data on snow properties. As such, the snow particle-size parameters used in this study are interpreted as a measure for characterizing the scattering body of radiation (Reference Nagler and RottNagler and Rott, 2000). For the study we tested five different groups of spatial data: (1) relief properties such as elevation, slope and aspect; (2) remote-sensing data from Moderate Resolution Imaging Spectroradiometer (MODIS) and SAR sensors (see Table 1 for specification); (3) spatially interpolated data (i.e. 10m maps of snow temperature and approximate snow accumulation); (4) field-retrieved data on surface properties; and (5) in situ elevation and distance from the coast. In order to determine spatial datasets that reflect the observed differences in snow particle size, the available datasets from each group were first correlated with each of the five snow particle-size parameters. A principal component analysis (PCA) was then conducted to identify structure and redundancy among the size parameters and spatial datasets and to identify the snow particle-size parameters that correlated best with the various spatial datasets. Such information potentially could be helpful to better quantify snow properties in remote areas and to improve snow indices derived from remote-sensing data. It could also be used for interpolation purposes.
Group, type of data, sensor, spatial resolution, data source and acquisition date and reference for the spatial datasets used in the statistical analysis performed in this study. The datasets are provided by the RADARSAT-1 Antarctic Mapping Project (RAMP), the British Antarctic Survey (BAS) and the US National Snow and Ice Data Center (NSIDC). The sensors used are the European Remote-sensing Satellite-1(ERS-1), MODIS, RADARSAT SAR, the Advanced Microwave Scanning Radiometer for Earth Observing Sysytem (AMSR-E) and the Advanced Very High Resolution Radiometer (AVHRR). Two of the overarching projects are MOA and THERMAP
Methods
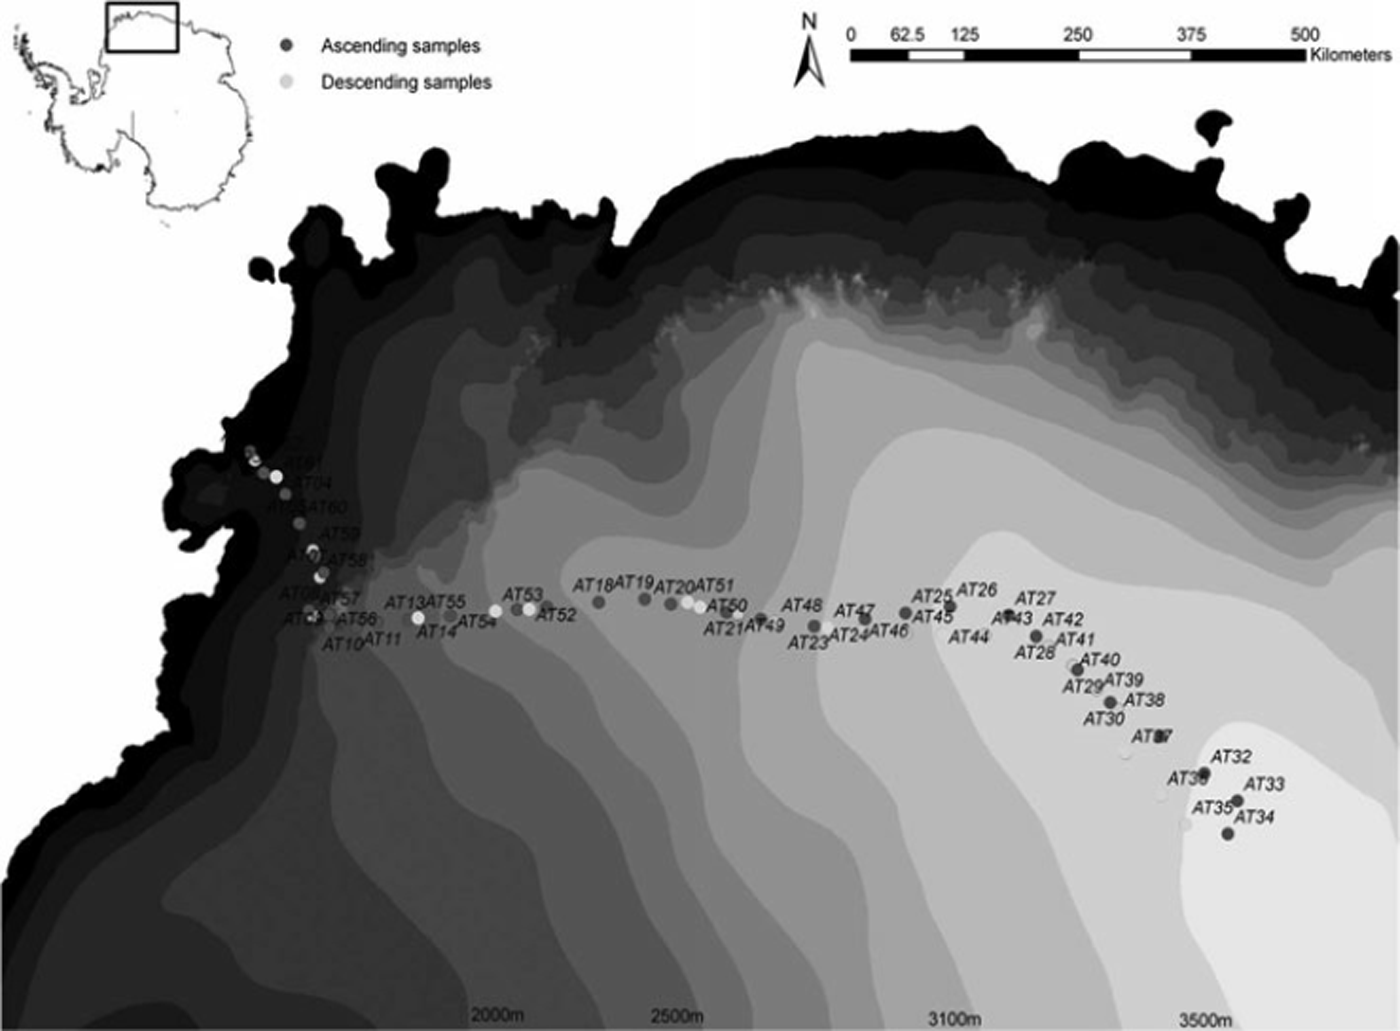
The material for this analysis is based on data collected during the 2007/08 JASE traverse in DML (Reference FujitaFujita and others, 2011). During the Swedish part of JASE, surface snow, defined as the topmost 1 cm of the snowpack, was sampled at 62 sites along the 1800 km route from the coastal Swedish station (73°04′ S, 13°41′ W) to the meeting point with the Japanese expedition team (75°89′ S, 25°83′ W). The locations of the 62 sampling points were randomly selected, but were determined overall by logistical stops during the expedition (Fig. 1). The distance between each sampling site was ∼50km. During each stop along the traverse, a snow sampling site was randomly selected ∼20m away from the expedition vehicles in the windward direction to ensure that the snow surface samples were not influenced by the traverse tracks or vehicle exhaust. At each site a GPS point was taken using a GPS device (Garmin GPS-60, accuracy <15 m, 95% typical) in order to extract information from remotely sensed data (groups 1–3; Table 1) and terrain data observed during the traverse at each site (groups 4–5; Table 1).
Surface sample sites during the JASE traverse 2007/08 overlying a topographic map of Antarctica. Dark grey circles are the ascending samples from Wasa to the meeting point, and light grey circles are the descending sample sites on the return to Wasa station. AT numbers indicate the ID of each sample point.
At each sampling point, five different snow particle-size parameters were estimated from a digital photograph of a snow sample on a micrometer-accurate reference plate. This method has several advantages: the equipment needed to estimate the snow particle-size parameters is quick to assemble and robust to the varying weather conditions, and the snow particle information collected at a certain location is preserved and available for later reanalysis. The snow particle size was then estimated from the digital photograph using the Digital Snow Particle Property (DSPP) method described by Reference Ingvander, Johansson, Jansson and PetterssonIngvander and others (2012). The DSPP method is based on previous methods for determining snow particle sizes such as those by Reference Gay, Fily, Genthon, Frezzotti, Oerter and WintherGay and others (2002) and Karkas and others (2002). The DSPP method was developed as a robust and quick field method that supports existing visual methods used to interpret snow particle-size parameters in the field. However, this method does not aim to achieve the level of detail and precision provided by tomography analysis or specific surface area estimates (e.g. Reference Matzl and SchneebeliMatzl and Schneebeli, 2006; Reference DomineDomine and others, 2008; Reference Gallet, Domine, Zender and PicardGallet and others, 2009; Reference Picard, Arnaud, Domine and FilyPicard and others, 2009). Comparisons have shown that visual methods generally report larger particle sizes than optic equivalent measurements (Reference Aoki, Fukabori, Hachikubo, Tachibana and NishioAoki and others, 2000).
The DSPP method allows the estimation of two-dimensional size parameters of a snow particle using object-oriented image analysis on the digital photograph of a snow sample. The image resolution in the analysis is 0.03 mm, and the smallest detectable objects have an area of 0.015 mm2 (based on image classification lower limit for area set to exclude millimetre markers but detect all larger objects). The object-oriented image analysis generates multiple size parameters by segmenting the image based on shape and colour compactness. The segmented images are then classified into ‘snow particle’ and ‘no snow particle’ areas using thresholds for the brightness (to distinguish bright snow particles from the dark-coloured reference plate), the snow particle area (the area threshold excludes reflections from the sample glass, large grain clusters and the millimetre marker reflections) and the snow particle shape (i.e. excluding elongated shapes that are generally produced by reflections in the sample glass). The size parameters retrieved from each image and used in this study are the length (greatest extension of the particle), the width (perpendicular to the length axis), the area (the area of the particle side that is facing the camera calculated using the pixel size multiplied by the number of pixels included in each particle), the largest enclosed ellipse (LEE; i.e. the radius of the largest ellipsoidal feature enclosed by the particle) and the shape (i.e. the length/width ratio) (Reference Ingvander, Brown, Jansson and Lacoste-FrancisIngvander and others, 2011).
Each of the five snow particle-size parameters was correlated to different spatial datasets. For this study, these spatial datasets are divided into five groups based on the origin and information type of the data (Table 1):
Group 1 – relief properties including: (1) a digital elevation model (DEM) of the surface elevation (m) with a spatial resolution of 1km, which was derived from European Remote-sensing Satellite-1 (ERS-1) and Ice, Cloud and land Elevation Satellite (ICESat) data (Reference Bamber, Gomez-Dans and GriggsBamber and others, 2009); (2) the slope (8) derived from the 1 km DEM of the surface elevation; (3) the aspect (i.e. downslope azimuth direction) derived from the 1km DEM of the surface elevation.
Group 2 – remotely sensed products that constitute images acquired with passive and active sensors: (1) MOA, a composite map (260 images collected during 2003–04) of the roughness of the snow surface of Antarctica produced in 2004 by combining the visible and near-infrared (NIR) bands from the MODIS sensor (Reference Haran, Bohlander, Scambos and FahnestockHaran and others, 2005); (2) RADARSAT SAR Antarctic mosaic from the RADARSAT-1 Antarctic Mapping Project (RAMP) with a spatial resolution of 125m (Reference JezekJezek and others, 2002) representing calibrated radar backscatter data that reflect differences in the surface roughness, dielectric properties and the particle size of the snow; (3) RADARSAT SAR Antarctic mosaic from the RAMP with a spatial resolution of 25 m representing the same properties as the 125 m product.
Group 3 – remotely sensed snow properties derived from remote-sensing data using existing algorithms for parameter retrieval: (1) estimated snow accumulation (kg m−2 ä−1) produced by interpolation of field measurements and satellite images from the Advanced Microwave Scanning Radiometer for Earth Observing System (AMSR-E) and Advanced Very High Resolution Radiometer (AVHRR) instruments (Reference Arthern, Winebrenner and VaughanArthern and others, 2006); (2) interpolated map of field-measured snow temperature at 10m depth using the THERMAP dataset (Reference Bohlander and ScambosBohlander and Scambos, 2001); (3) map of the relative optical grain size retrieved from the MODIS sensor with a spatial resolution of 750 m (Reference Haran, Bohlander, Scambos and FahnestockHaran and others, 2005).
Group 4 – field-observed snow surface properties retrieved concurrent with the snow particle-size photography for each snow sample site: (1) surface roughness (determined visually based on the microtopography) classified into four groups (a – flat, b – ripples, c – sastrugi crest, d – sastrugi valley); (2) surface resistance subjectively classified into four classes (1 – soft, 2 – semisoft, 3 – hard, 4 – super hard) based on penetration of a spatula handle 1.5 cm in diameter.
Group 5 – field-surveyed terrain parameters derived on the basis of the position of each sample site: (1) elevation measured with a Garmin 60 handheld GPS device (vertical accuracy <15 m) at each sample site; (2) distance from coast calculated by subtracting the latitudinal coordinate from 728S as a proxy for distance to moisture source.
The Pearson product-moment correlation coefficient, r, was estimated for each combination of a spatial dataset and each of the five snow particle-size parameters. In addition, a Pearson (n) PCA (Reference JolliffeJolliffe, 2002) was performed on all size parameters and spatial datasets.
Results
Correlation analysis
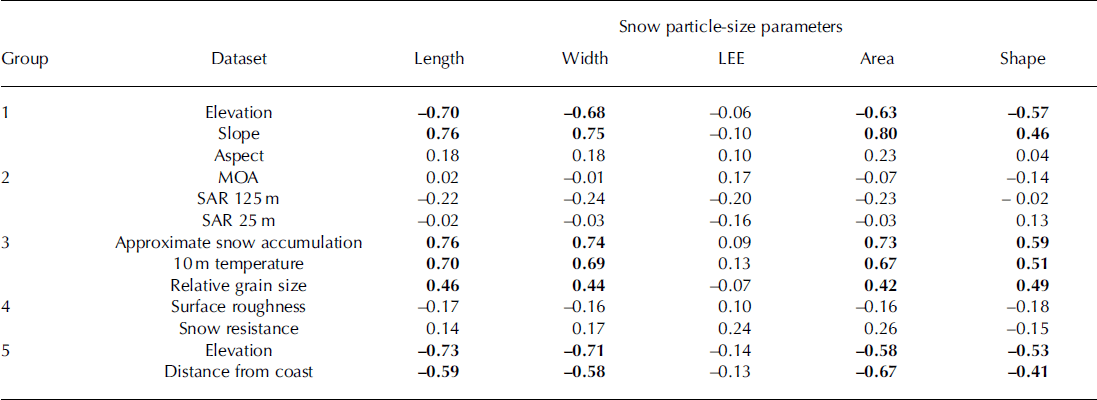
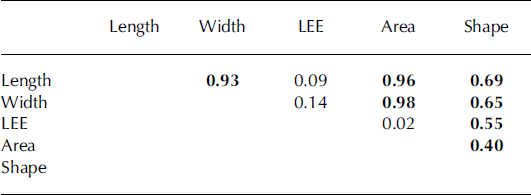
The spatial extent of the in situ measurements used in this analysis covers a distance of 1800 km in DML, and stretches across the coastal region, through a mountain range and up the EAIS plateau. The time period over which the 62 snow samples were taken was 48 days (Fig. 1). Thus, the estimated snow particle-size parameters used in the analysis varied in space and time. The observed snow particle lengths and areas were generally larger in the low-elevation coastal areas than on the EAIS plateau (Fig. 2). Table 2 shows the results of the correlation analysis between the snow particle-size parameters and the evaluated spatial datasets. Of the snow particle-size parameters, the snow particle length, width and area showed consistently the highest correlation coefficients with the spatial datasets. Of the spatial datasets, groups 1, 3 and 5 showed the best correlation coefficients (Table 2). Within group 1 (elevation properties) the relief slope was significantly correlated to the snow particle length (r=0.76), width (r=0.75) and area (r=0.80). In addition, both the snow particle length and width were significantly correlated to the elevation above sea level (r=0.70 and r=0.68, respectively), while the aspect showed generally low correlation coefficients (Table 2). Within group 3 (remotely sensed retrieved snow properties) the snow particle length, width and area were significantly correlated to the approximated snow accumulation (r=0.76, r=0.74 and r=0.73, respectively) and the 10 m temperature map (r=0.70, r=0.69 and r =0.67, respectively). Among the field-surveyed terrain parameters (group 5) both the snow particle length and width showed significant correlations to the GPS-measured elevation (r=–0.73 and r=–0.71, respectively). In addition, the snow particle area was significantly correlated to the distance from the coast. In order to test the correlation between the size parameters (Table 3), length, width, LEE, area and shape were correlated against each other. Significant correlations are found between all size parameters except LEE, which only correlates significantly to shape (r=0.55).

Correlation coefficients estimated between each snow particle-size parameter and spatial dataset. Correlation coefficients that were significant at the 5% significance level (two-sided t test) are highlighted in bold
Correlation coefficients estimated between the separate snow particle-size parameters. Correlation coefficients that were significant at the 5% significance level (two-sided t test) are highlighted in bold
Principal component analysis
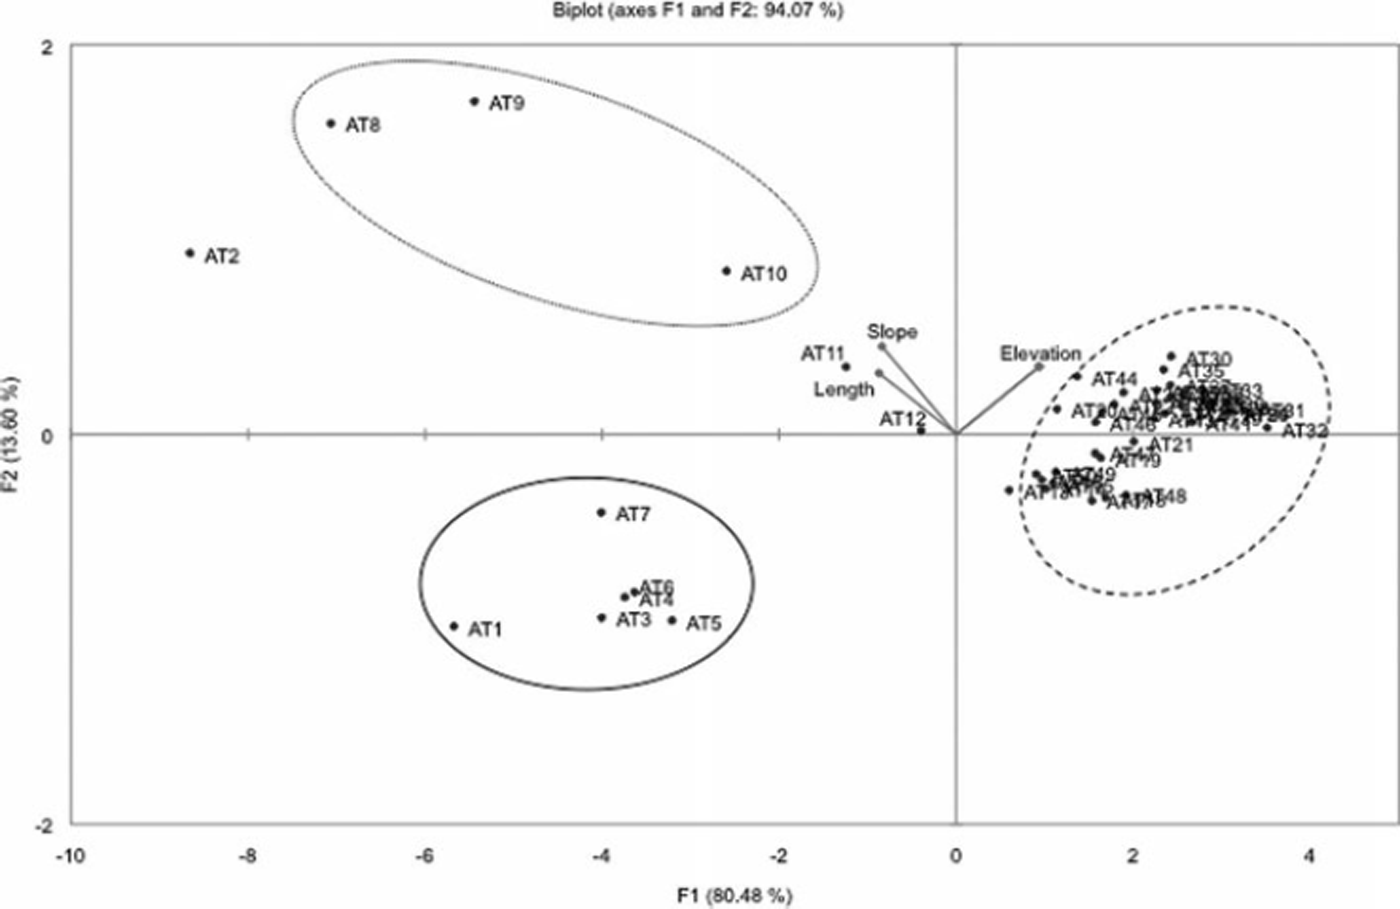
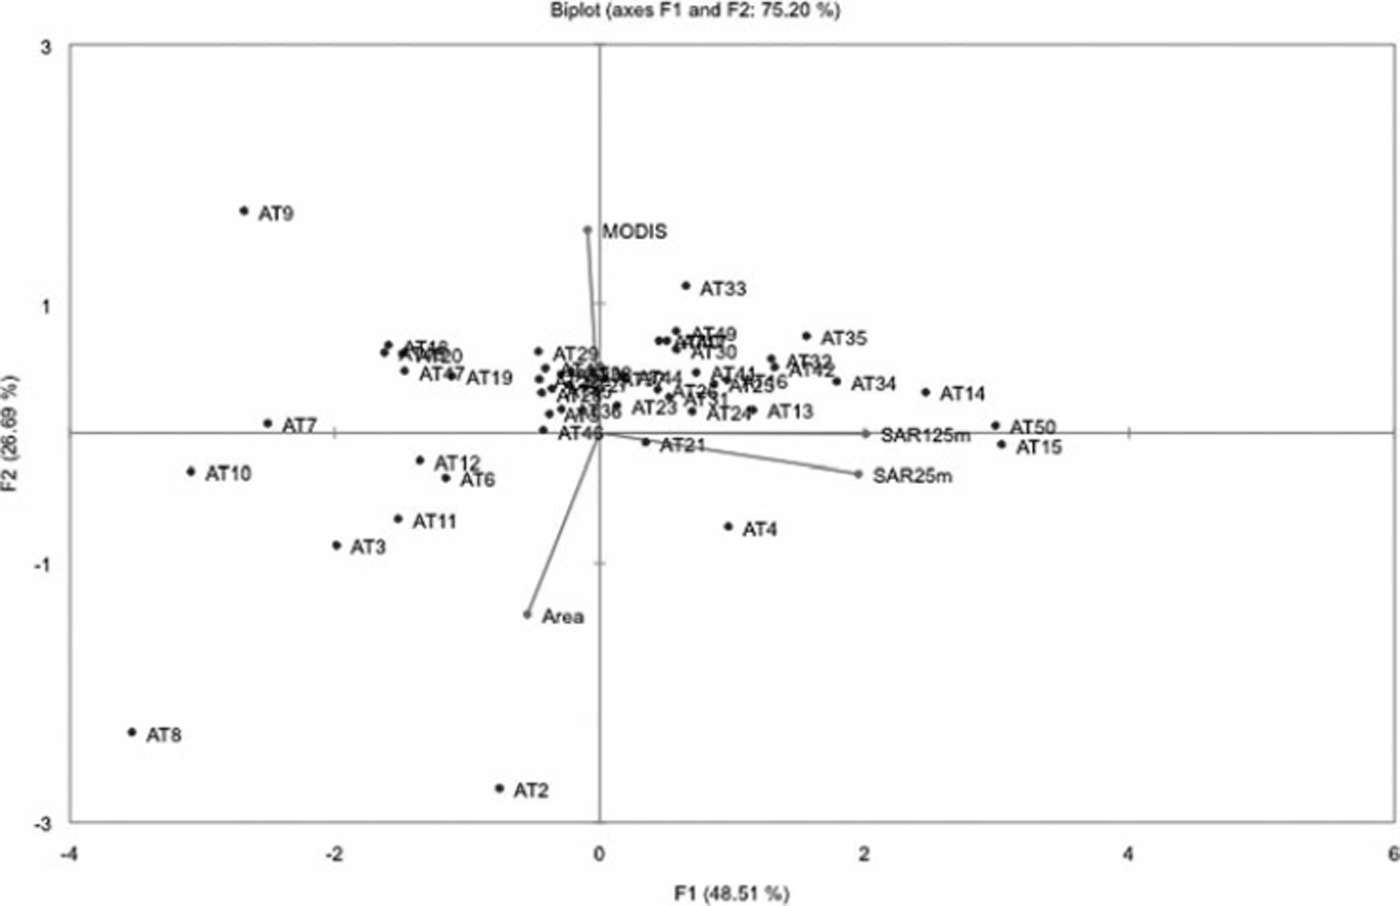
All size parameters were analysed in a PCA with the spatial datasets of each group. As indicated in Figure 3, the satellite-derived surface elevation and terrain slope, which were both significantly correlated with the snow particle length (Table 2), explain 94% of the variance in the snow particle length. Figure 4 shows that both the distance from the coast and the elevation measured with the handheld GPS device are able to explain 96% of the observed variability in snow particle area. In contrast, spatial datasets from groups 2 and 4, which showed low correlation coefficients for all snow particle-size parameters, were not able to explain more than 75% of the variance in, for example, snow particle area (Fig. 5). In Figures 3 and 4, the geographic zonation in DML is evident in the biplots, but this pattern is not distinguishable in the RAMP-derived datasets (Reference JezekJezek and others, 2002) in Figure 5.
Biplot of PCA of snow particle length and group 1 (i.e. slope, elevation and interpolated elevation) variables and observations with ID. Geographical clusters are marked with a solid line for coastal samples, a dashed line for plateau samples and a dotted line for the transition zone between the coast and the plateau. AT numbers indicate the sample ID.
Same as Figure 3, but for snow particle area and group 5 (i.e. handheld GPS elevation and distance from coast).

Biplot of PCA of snow particle area and group 2 (i.e. MOA, SAR 25 m and SAR 125m) variables and observations with ID. In this biplot the geographical separation is not evident and therefore not marked out. AT numbers indicate the sample ID.
Discussion
The DML landscape is characteristic of Antarctica, with the EAIS plateau connecting to the coastal ice surface by outlet glaciers through the mountain range Heimefrontfjella. The EAIS is connected to the coastal region with ice streams flowing through the transition zone in the mountain range. For all size parameters there is a clear pattern of predominantly smaller particle sizes on the plateau compared with the coastal or transitional region (Fig. 2). This difference can be explained by several physical factors, such as precipitation rate (Reference Arthern, Winebrenner and VaughanArthern and others, 2006), moisture content of the air (Reference Connolley and KingConnolley and King, 1993) and air temperature (Reference Connolley and CattleConnolley and Cattle, 1994), which control the size of a snow particle before deposition on the ground. In addition to these factors, the snow is also subject to redistribution and metamorphic processes that alter the size and shape of snow particles (Reference Stephenson and OuraStephenson, 1967). However, the degree to which these factors influence snow particle size is determined to a large extent by the topography of DML. This is suggested by the fact that all spatial datasets from groups 1 and 5 (i.e. terrain-based data), except for the aspect, are significantly correlated to the snow particle length, width, area and shape (Figs 3 and 4). Both Figures 3 and 4 indicate that there is a clear difference in particle size between the coastal and plateau regions. Our hypothesis was that both aspect and slope of the terrain affect the particle size, but interestingly, based on the results of the PCA, the slope has the strongest effect on particle size. This is particularly apparent in the samples taken in the transition zone (Figs 2 and 3). A potential reason for the high correlation between slope and snow particle size could be that the terrain slope influences the preferential deposition of snow and thus the snow depth and the redistribution and metamorphic transformation of snow by wind (Reference Jaedicke, Thiis, Bank, Hjorth-Hansen, Holand, Loset and NoremJaedicke and others, 2000). For example, in the Alps, Reference Lehning, Grünewald and SchirmerLehning and others (2011) found that sheltered areas accumulate more fine particles, while steeper terrain is more exposed to wind and generates more rough snow surfaces. In contrast, the aspect did not show a clear relation to the particle size, as indicated by the correlation analysis (Table 2). This suggests that in DML spatial differences in insolation (i.e. differences in the surface energy balance associated with the differences in aspect) have less influence on the snow particle size and the major effect from insolation comes from the variation in seasonal radiation in Antarctica (Reference Van den Broeke, Reijmer, Van As, Van de Wal and OerlemansVan den Broeke and others, 2005). In addition, the LEE did not show significant correlations to any of the spatial datasets. We hypothesize that this is because the snow particle length, width, area and shape are first-order parameters extracted with the object-oriented image-analysis software (Reference DefiniensDefiniens, 2008), whereas LEE is a calculated parameter determined using an empirical model (Reference Baatz, Schape, Strobl, Blaschke and GriesebnerBaatz and Schape, 2000). Length is the parameter most exposed to change due to metamorphosis (Reference Sommerfeld and LaChapelleSommerfeld and LaChapelle, 1970) as it is the longest axis compared with area, being a function of area and width. However, with this investigation unfortunately we cannot identify metamorphic change to the snow particles. Three of the groups (Table 1) showed significant correlations. We have discussed two of them, groups 1 and 5, as direct topographic parameters. The third group with significant correlations is group 3. Group 3 includes spatial datasets that contain parameters which are affected by the topography and distance from the coast, such as the 10m temperatures and the average annual accumulation. These data are closely correlated to temperature and moisture which are governed by elevation and distance from the coast. The EAIS is characterized by topographic properties that affect the climate in the area, which in turn affects precipitation type and amount and, hence, snow particle size (Reference Arthern, Winebrenner and VaughanArthern and others, 2006; Reference Schlosser, Manning, Powers, Duda, Birnbaum and FujitaSchlosser and others, 2010). The spatial differences in particle size and their association with different topographic regions have been shown previously by Reference Ingvander, Brown, Jansson and Lacoste-FrancisIngvander and others (2011).
The spatial datasets from group 3 showed significant correlations to the size parameters except for the LEE parameter. The highest correlation coefficient was seen between the particle length and the estimated snow accumulation derived from the model of Reference Arthern, Winebrenner and VaughanArthern and others (2006). This can be attributed to the fact that the coastal areas receive generally higher precipitation amounts in the form of snow due to the proximity to the ocean, which also results in larger snow crystal sizes (Reference LibbrechtLibbrecht, 2005). This is further corroborated by the high correlation coefficients of the particle-size parameters with the interpolated 10 m snow temperature. The 10m temperature generally reflects the mean annual air temperature of the area (Reference Cuffey and PatersonCuffey and Paterson, 2010), which is also assumed to have a strong effect on the size of the precipitated snow (Reference LibbrechtLibbrecht, 2005). However, the data used here lack information from the Kohnen and Wasa stations (i.e. the transitional and coastal regions), which would probably improve the correlation if it were added.
The correlation coefficients between the snow particle-size parameters and the relative optical snow grain size estimated in the MOA product compiled by Reference Haran, Bohlander, Scambos and FahnestockHaran and others (2005) varied between r=0.42 and r=0.49 (except for the LEE parameter which showed r=–0.07). We expected that the relative optical snow grain size would show stronger correlation coefficients. However, since the MOA particle-size product was mosaicked from several MODIS images taken in 2003–04 and the field-surveyed particle-size data were sampled during 2007/08, we assume that this correlation coefficient was biased by the large temporal difference between the compared datasets (Reference Scambos, Haran, Fahnestock, Painter and BohlanderScambos and others, 2007).
The remote-sensing-derived datasets in this investigation (groups 1–3) are all derived from compiled products generated as a mosaic of several satellite scenes that were acquired at different times. Thus, these products are temporally not concurrent with the field observations conducted during JASE. However the parameters in groups 1 and 3 are fairly constant (being yearly averages and topographic parameters), so the correlation coefficient is significant. The data in group 2 are also composite products indicating the differences in the surface properties. In group 2, consisting of MOA and RAMP remote-sensing data, we encounter poor correlation. The poor correlation between snow particle size and the RAMP data can be explained by the use of the RADARSAT-1 instrument which operates at C-band (5.3 GHz), penetrating the surface and providing bulk scatter from the snowpack as well as the snow surface (Reference JezekJezek and others, 2002). The MOA dataset is a mosaic product generated out of 260 MODIS images acquired over 4 months in 2003–04. As the snow particles are subject to change due to metamorphism (Reference Sommerfeld and LaChapelleSommerfeld and LaChapelle, 1970), the temporal difference between the datasets (4 years), the seasonal cycles in insolation (Reference Van den Broeke, Reijmer, Van As, Van de Wal and OerlemansVan den Broeke and others, 2005) and by precipitation (Reference Schlosser, Manning, Powers, Duda, Birnbaum and FujitaSchlosser and others, 2010), the correlation coefficients in this dataset are also poor.
Furthermore, the snow surface properties observed in situ in group 4 show insignificant correlations to all snow particle-size parameters. This is an unexpected result as the snow surface in Antarctica is highly variable and exhibits a complex pattern of wind-packed areas and accumulation sites. The strong katabatic winds create sastrugi patterns with lee and onward sides that we assumed would show large differences in particle size (Reference OrheimOrheim, 1968; Reference Frezzotti, Gandolfi, La Marca and UrbiniFrezzotti and others, 2002). However, the sampling locations used to estimate the snow particle-size parameters were chosen randomly and not with respect to the leeward or windward position relative to sastrugi. Thus, the hypothesized snow particle-size difference associated with the redistribution by wind and preferential deposition cannot be tested sufficiently. These small-scale features need to be studied more closely in the future in order to determine the relationship between the particle size and surface roughness type.
When including several spatial datasets and various snow particle-size parameters within a PCA analysis, it is important to understand the errors introduced by the difference in the spatio-temporal resolution and acquisition date of the spatial datasets, the effect of the topography and also the seasonal evolution of the snow surface. Large seasonal differences in the snow properties in Antarctica are caused by seasonal and diurnal radiation and temperature differences (Reference Van den Broeke, Reijmer, Van As, Van de Wal and OerlemansVan den Broeke and others, 2005), strong coastal winds and more unidirectional wind patterns on the Antarctic plateau (Reference King and TurnerKing and Turner, 1997). There are two dominant wind patterns that could influence the snow particle size in the coastal areas and on the polar plateau. At the beginning of the polar summer, katabatic winds transport drier air masses that consist mainly of refrozen evaporated water vapor (diamond dust; Reference Schlosser, Manning, Powers, Duda, Birnbaum and FujitaSchlosser and others, 2010) from the polar plateau to the coastal areas. During this process, snow particles are likely transported by saltation or suspension (Reference Jaedicke, Thiis, Bank, Hjorth-Hansen, Holand, Loset and NoremJaedicke and others, 2000), which could cause the deposition of smaller snow particles in the transition zone. In contrast, at the end of the austral summer, the predominant wind pattern is from the coastal areas to the polar plateau, which causes an orographic uplift of the moist air masses that precipitates snow particles of approximately the same size both in the transition zone and on the polar plateau. This pattern can be recognized in the spatial datasets in groups 1 and 3, as the parameters in group 1 are based on the topographic features that generate the spatial gradients in DML, whereas group 3 are climate parameters generated as an effect of the topographic features of DML. For example, in group 3 the accumulation distribution is effected by the wind patterns of DML.
The statistical analysis presented in this study is based on a unique snow particle-size dataset collected during JASE 2007/08. However, the results reveal that there is a trade-off when comparing spatial datasets, such as the remote-sensing composite products from groups 1–3, with in situ measurements, especially over such vast regions as Antarctica, as both field data and remote-sensing data are sparse and the collection of field data requires great effort. High correlations were found between spatial datasets and snow particle size which explain the large-scale patterns that are determined by physical factors such as the difference in altitude, air temperature and air moisture. However, field observations and remote-sensing images ideally should be acquired at the same time or within a very short time period. In contrast, the sensitivity of the remotely sensed scattering properties of snow to the snow conditions suggests that remote-sensing products such as the MOA or RAMP mosaic products are of limited use for extrapolating snow particle-size information.
Together these results suggest that more research is needed on the spatio-temporal differences in snow properties. In order to improve the correlation between remote-sensing data and field-observed snow properties, field measurements should be synchronized with the repetition cycle of remote satellite sensors to improve the monitoring of the mass balance of the Antarctic ice shelf.
Conclusions
Of the snow particle-size parameters considered, the basic size parameters of length, width and area showed significant correlation with most of the spatial datasets derived from surface topography data. The groups of spatial datasets that showed the strongest correlation were those that included data immediately reflecting the topographic features of the region, such as the coastal area, which is separated from the plateau by the transitional zone. Topographically influenced spatial datasets such as the approximate snow accumulation, relative grain size and 10 m snow temperature likewise showed significant correlation coefficients to all snow particle-size parameters. This is because the snow accumulation and temperature are affected by the differences in elevation and the distance from the coast, which in turn affects the snow particle size based on the temperature and moisture content of the air where the snow particles are formed. In DML, the greater the distance from the coast (moisture source) the higher is the elevation. This generates lower temperatures and drier air, and smaller grains are formed than closer to the coast.
In contrast, spatial datasets derived from remote-sensing products such as the MOA and RAMP datasets showed low correlation coefficients to the snow particle-size parameters. This is due to large temporal differences in the acquisition date of the remote-sensing products and the field-sampled snow particle-size parameters for the MOA data and the issue of subsurface penetration by the RADARSAT-1 sensor in the RAMP. Remotely sensed datasets of less variable data (such as 10 m temperatures and snow accumulation) maintain high correlation to the size parameters, but as the MOA product provides a snow grain-size product on a feature that is highly variable in both time and space, this contributes to the poor correlation between datasets.
Acknowledgements
We acknowledge the Swedish Polar Research Secretariat for logistic support and the Swedish Research Council, the National Institute of Polar Research (Japan), the Swedish National Space Board, the YMER-80 Foundation, the Swedish Society for Anthropology and Geography and the Helge Ax:son Johnsons Foundation for financial support. We thank the field crew and staff of both Swedish and Japanese departments who provided the spatial datasets.



