Introduction
Rapid urbanization is seen as one of the most important social changes of the 20th century. Similar to other developing countries, India has also witnessed rapid urbanization in the past few decades. Recent estimates show that about 31% of the Indian population were living in urban areas in 2011 (Office of the Registrar General and Census Commissioner, 2011), which is almost five times higher than in 1951. The United Nations' projections (medium variant) predict that 41% of the country's population will live in urban areas by 2030 as urban population is expected to grow at a rate of 2.5% per annum compared with less than 1% in rural India during 2010–20 (United Nations, 2006). The rapid increase in urban population in India is characterized by the combined effect of a natural increase and, to a large extent, rural-to-urban migration, mainly due to widespread poverty, indebtedness and under-employment in rural areas (Bhagat, Reference Bhagat2005).
Until the early 1980s, urbanization was invariably viewed as beneficial for health status as it resulted in better access to a wide range of health care services and better developed health infrastructure. Urban health, therefore, was not the main focus of public health policies in developing countries. Moreover, urban groups were perceived as homogenous with respect to economic health status (Rossi-Espagnet, Reference Rossi-Espagnet1984). But in the 1980s and 1990s studies revealed an enormous diversity in the extent and depth of poverty in urban sectors in developing countries and the impact of this on health outcomes (Bradley et al., Reference Bradley, Stephens, Harpham and Cairncross1992; Atkinson, Reference Atkinson1994; Timaeus & Lush, Reference Timaeus and Lush1995; Harpham et al., Reference Harpham, Lusty and Vaughan1998; Brockerhoff & Brennan, Reference Brockerhoff and Brennan1998). The common finding of these studies was that the gap in health status was large between the poor and better-off in urban areas. Along with income inequality, the unhygienic and health-threatening surroundings, irregular use of recommended health practices and affordability of, and accessibility to, health facilities put the urban poor at increased risk of prolonged illness (Mulgaonkar et al., Reference Mulgaonkar, Parikh, Taskar, Dharap, Pradhan and Gittelsohn1994). The urban poor in South Asian countries have witnessed high levels of malnutrition among children due to the synergistic effects of improper food intake as a consequence of poverty and high rates of childhood diseases such as diarrhoea due to unhygienic conditions, resulting in higher infant death rates (Ruzicka & Kane, Reference Ruzicka, Kane, Srinivasan and Mukerji1985; Pelletier et al., Reference Pelletier, Frongillo, Schroeder and Habicht1995).
Studies have also suggested that most economically deprived migrants reside in the slum areas of the urban periphery, and the increasing concentration of the urban population in slum areas is generally equated with increased urban poverty and adverse health outcomes. In many cases, the health of the urban poor is found to be worse than that of the rest of the urban population, and health conditions are often comparable to those of rural areas (Montogomery & Hewett, Reference Montgomery and Hewett2005; Islam, et al., Reference Islam, Montgomery and Taneja2006; Fosto et al., Reference Fosto, Ezeh and Oronje2008). In countries such as Bangladesh, Ethiopia, Haiti and India child malnutrition in slums has been found to be comparable to that of rural areas (UN-HABITAT, 2006). Not only nutritional status, but the chances of child survival were also found to be lower among slum dwellers in comparison with non-slum residents of the same city in Kenya and Pakistan (African Population and Health Research Centre, 2002; Bartlett, Reference Bartlett2003).
Little attention has been paid to understand the utilization pattern of maternal and child health care services among the urban poor in developing countries. The literature suggests that, as for health status, health care utilization is much lower among the urban poor than in the rest of the urban population. For example, in sub-Saharan Africa, the indicators of maternal and child health care were found to vary greatly between rural and urban areas and between the poor and non-poor. Although the urban poor received better antenatal and delivery care than rural residents, the quality of care among the urban poor was worse than that of the non-poor (Magadi et al., Reference Magadi, Zulu and Brockerhoff2003). Another, multi-centre study suggested a close association between household living standard and three health measures: namely, unmet need for contraception, attendance of a trained health care provider at child birth, and young children's height for age (Rutstein et al., Reference Rutstein, Johnson and Montana2005). A few studies conducted in the Indian context have also revealed that health status and health care utilization in urban India are much lower among the urban poor than the non-poor. The antenatal care and safe delivery practices among lower-income groups are significantly worse than those of middle- and higher-income groups (Chattopadhyay & Roy, Reference Chattopadhyay and Roy2005; Agrawal et al., Reference Agrawal, Satyavada and Kaushik2007). Women from poor urban communities face greater health risks because of their social and economic roles, which expose them to more environmental hazards, and the trend has remained static over the years (Ghosh & Shah, Reference Ghosh and Shah2004).
Although a series of other studies have shed some light on the growing rich–poor gap in utilization of basic reproductive and child health care services in India (Ladusingh & Singh, Reference Ladusingh and Singh2007; Mohanty & Pathak, Reference Mohanty and Pathak2009; Pathak & Mohanty, Reference Pathak and Mohanty2010; Pathak et al., Reference Pathak, Singh and Subramanian2010; Pathak & Singh, Reference Pathak and Singh2011), many of them used information on poverty and utilization of maternal and child health care services in a much broader context, i.e. either over a period of time or the differential in outcome measures across urban poor and rural poor. None has tried to explore the growing disparity in utilization of health services within the urban areas themselves. In addition, previous studies focusing on urban areas had some limitations. First is the lack of a proper definition of ‘urban poor’, as most studies have regarded the urban poor as those with a low standard of living index (SLI); however, SLI has been criticized for not taking into account state and rural–urban differences in asset indicators (Mishra & Dilip, Reference Mishra and Dilip2008; Mohanty, Reference Mohanty2009). Second, some studies have considered any slum residents as urban poor, but poverty may have effects beyond the slums. Moreover, these studies have completely ignored the state-level variation in urban poverty and its implications for utilization of maternal and child health care.
Due to the large inter-state variability in socioeconomic and cultural status and lack of a standard definition of urban poor, it becomes important to systematically gauge how far urban poverty is responsible for producing the differential in the utilization of maternal and child health care services in urban areas. Since inequity in health poses a major challenge to achieving the Millennium Development Goals, particularly those related to maternal and child health, assessment of the coverage of disadvantaged populations under reproductive and child health programmes should receive priority. Accordingly, this study was planned with the objective of examining the patterns and determinants of maternal health care service utilization among the urban poor and non-poor in India and across selected Indian states.
Data and Methods
Data source
Data for the study were taken from the National Family Health Survey (NFHS) carried out in India during 2005–06. The NFHS is a large-scale, multi-round survey conducted in a representative sample of households across 29 states of India covering about 109,041 households, 124,385 women aged 15–49 and 74,369 men aged 15–54 representing 99% of India's population. The principal objective of the survey was to provide state- and national-level estimates of fertility, mortality, family planning, HIV-related knowledge and important aspects of nutrition, health and health care.
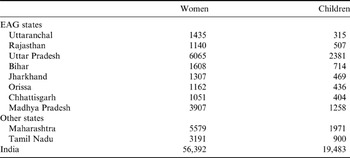
The use of maternal and child health care services was explored in ten states covering almost all geographic regions of the country, except the north-east. The states were selected on the basis of the proportion of urban poor in the state to the national estimate. According to the study on urban poor conducted by the Urban Health and Resource Centre (2008), almost 68% of the urban poor reside in the most economically developed and underdeveloped parts of the country. These states are the eight EAG (Empowered Action Group) states (Bihar, Madhya Pradesh, Rajasthan, Uttar Pradesh, Orissa, Jharkhand, Chhattisgarh and Uttaranchal) and two other states: namely, Maharashtra and Tamil Nadu. Data on ever-married women in the reproductive age group (15–49) with at least one birth in the five years preceding the survey and with their children born in the same periods were examined. The numbers of women and children in urban India and selected states in the sample are given in Table 1.
Sample distribution of ever-married women (aged 15–49) and their children (under age 5) in urban India, 2005–06

In the survey children were not interviewed. The sample of 19,483 children is a sub-sample from 56,392 women who were born in the last five years preceding the survey.
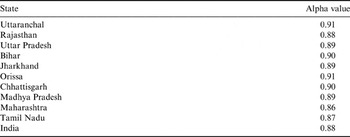
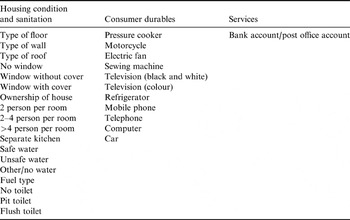
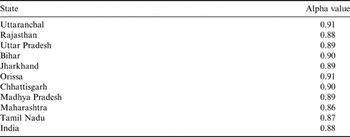
In order to identify the poor and non-poor in the urban areas, a household asset-based wealth index was generated and used in the analyses. In the absence of direct data on income or expenditure in household sample surveys like the NFHS, the use of a wealth index based on the ownership of household assets is widely recognized as a proxy for household economic status (Montgomery et al., Reference Montgomery, Gragnolati, Burke and Paredes2000; Filmer & Pritchett, Reference Filmer and Pritchett2001; Rutstein & Johnson, Reference Rutstein and Johnson2004; Vyas & Kumaranayake, Reference Vyas and Kumaranayake2006; Gwatkin et al., Reference Gwatkin, Rutstein, Johnson, Suliman, Wagstaff and Amouzou2007; Howe et al., Reference Howe, Hargreaves, Gabrysch and Huttly2009; Johnson & Bradley, Reference Johnson and Bradley2008; Rutstein, Reference Rutstein2008). Although the index has been subject to criticism, as it does not take into account the rationale for the selection of indicators, and inter-state and rural–urban differentials in a large and heterogeneous country like India (Mishra & Dilip, Reference Mishra and Dilip2008), studies have noted that the wealth index is an indicator of the level of wealth that is consistent with expenditure and income, and has been widely tested in a large number of developing countries to examine economic inequalities in household income, including India (IIPS & Macro International, 2007; Pathak et al., Reference Pathak, Singh and Subramanian2010; Pathak & Singh, Reference Pathak and Singh2011). In order to overcome the effect of the rural–urban differential in selected indicators used in the existing wealth index, a new wealth index was estimated separately for urban areas using the Principal Component Analysis (PCA) method on a set of durable assets, access to utilities and infrastructure and housing characteristic variables. The alpha values of the country and all the selected states are more than 0.80 indicating that the estimates are reliable (see Tables A1 and A2 in the Appendix).
From the composite wealth index, a percentile distribution was obtained, and the cut-off point of the poor was demarcated as the lower 30%, while the remaining 70% of the population was considered as non-poor. The cut-off point of 30% was decided following the national poverty estimates derived by the Planning Commission 2007, Government of India, using the consumption expenditure data of the National Sample Survey Organisation (NSSO) on a regular basis. The poverty estimate for the period 2004–2005 (61st round) is close to the time period of the NFHS-3 and about 27% of the urban population in the country were below the poverty line in the period 2004–2005 (Planning Commission, 2007). The cut-off point of the lowest 30% may be a methodological limitation, but defining urban poor based on the lowest 20% has a different type of limitation because it only captures the poorest of the poor as the national-level poverty estimate is more than 20% and will not be a true representation of this population sub-group (Ladusingh & Singh, Reference Ladusingh and Singh2007; Joe et al., Reference Joe, Mishra and Navaneetham2009; Mohanty & Pathak, Reference Mohanty and Pathak2009).
Outcome variables
The outcome variables were one indicator of antenatal care, one of delivery care and four of infant vaccination. Although full immunization could have been considered as the indicator for infant vaccination, existing studies suggest that a large proportion of children, especially in the EAG states, do not receive basic vaccinations such as BCG, Polio and DPT (Kumar, Reference Kumar2008). A detailed description of outcome indicators follows.
Antenatal care (ANC) visits during pregnancy
Women were considered to have received antenatal care if they had a minimum of three visits with at least two tetanus toxoid injections and had received iron folic tablets or syrup.
Safe delivery
Women were considered to have a safe delivery if their births (last five years to the survey date) were assisted by a doctor/nurse/or any health personnel in an institution or at home.
Immunization
A child is considered as immunized if he/she had received a single dose of BCG and Measles and the prescribed doses of Polio and DPT. According to the WHO schedule of immunizations, only children aged 12–23 months were considered for analysis.
Socioeconomic and demographic predictors of outcome measures
A set of theoretically pertinent socioeconomic and demographic variables were used in the analyses as follows: maternal education in years of schooling (no education, 1–10 years, more than 10 years), age of mother at delivery in completed years (15–24 years, 25–34 years, ≥35 years), sex of child (male, female), parity (1, 2, 3 and above), mass media exposure (no vs any exposure), caste groups (Scheduled caste, Scheduled tribe, Other Backward Castes, Other), religion of household (Hindu, Muslim, Others) and family structure (nuclear, non-nuclear).
Statistical analysis
Descriptive statistics were obtained for the social and demographic characteristics of women aged 15–49 who had a child in the five years preceding the survey. Cross-tabulations were used to examine the bivariable relationships between poverty status of the household (mother) and the dependent variables. Chi-squared tests were applied to understand the association between health care services and poverty. Logistic regression models were used to calculate the odds ratios and 95% confidence intervals, controlling for all of the independent variables. The results obtained from the logistic regression analysis are presented in the form of predicted probabilities for better interpretation (i.e. the lower the value of predicted probability, the lower will be chances of utilization of services). Appropriate sampling weights were used in the analyses to adjust for the non-response and multi-stage stratified sampling design of the survey. As a measure of inequality, the non-poor/poor ratio is used to understand the relative gaps in service utilization between the groups. Significance was taken at p<0.05.
The concentration curve (CC) and concentration index (CI) were estimated to measure the inequalities in the utilization of maternal health care by economic status. A concentration index is a measure of socioeconomic inequality and has been used previously to capture overall inequalities in desired outcomes across different wealth quintiles (Kakwani et al., Reference Kakwani, Wagstaff and Doorslaer1997). The concentration index is defined as twice the area between the concentration curve and the diagonal, and it varies between −1 and +1. The closer the value is to 1 (absolute), the more unequal is the outcome measure, and the closer the value is to 0, the more equal is the distribution (O'Donnell et al., 2000). The analysis was carried out using Stata10TM release 10.0 (Stata Corporation, College Station, TX, USA).
Results
Descriptive analysis
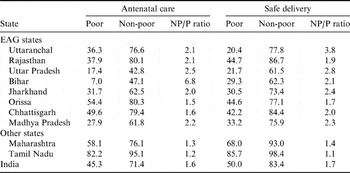
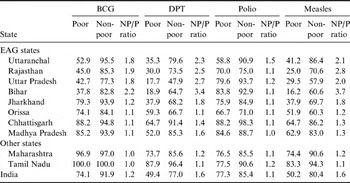
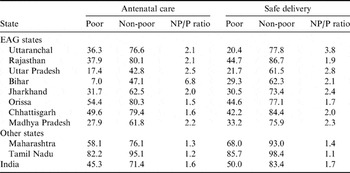
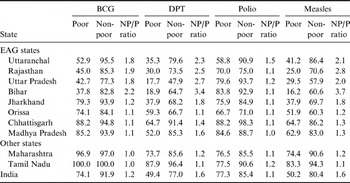
At the national as well as state level, the condition of the urban poor was found to be far behind that of the non-poor in utilization of basic maternal and child health services in 2005–06 (Table 2). For instance, about three-quarters (71%) of urban non-poor women used antenatal care services during pregnancy compared with more than two-fifths (45%) of the urban poor in India. For safe delivery, the difference between the urban poor and non-poor was large as the level of safe delivery among the urban poor was quite low. For example, more than four-fifths (84%) of urban non-poor women had delivered their pregnancy at any institution setting compared with just 50% of the urban poor. The non-poor to poor ratio was found to be similar for antenatal care (1.6) and safe delivery (1.7) in the country. Similar results were observed for different types of immunization (BCG, DPT, Polio and Measles) (see Table 3). The urban poor children were far behind non-poor children for the selected vaccines. However, the differences were greater for DPT and Measles. For instance, 49% of urban poor children were vaccinated for DPT compared with 77% of the non-poor, while only 50% of urban poor children were vaccinated against Measles compared with 80% of non-poor children. These results were supported by the non-poor/poor ratio.
Percentage of women who received antenatal care and safe delivery by urban poor and non-poor status in urban India and selected states, 2005–06
NP/P ratio: non-poor/poor ratio.
Percentage of children who received selected vaccines by urban poor and non-poor status in urban India and selected states, 2005–06
NP/P ratio: non-poor/poor ratio.
Besides the national scenario, similar results were obtained across the selected states. The differences in utilization of maternal and child health care services between the urban poor and non-poor were higher in the EAG states than among other states (Table 2). Antenatal care and safe delivery practices were found to be almost twice as high among the non-poor than among the poor in the major EAG states. In Rajasthan, antenatal check-up use was 80% among the non-poor compared with 36% among the poor. Similarly, safe delivery was 86% vs 45% among the non-poor and poor respectively. In Uttar Pradesh, where 43% of non-poor women received antenatal care, only 17% of poor women did so. There was also a large gap for safe delivery in this state (62% vs 22% among non-poor and poor respectively). The situation was even worse in Bihar, where antenatal care was 47% among the urban non-poor compared with just 7% among the poor. About 62% of births of the urban non-poor were delivered under hygienic conditions and medical/trained personnel compared with only 29% for urban poor mothers. Unlike in the EAG states, the gaps in maternal health care utilization between the urban poor and non-poor were relatively narrow in Maharashtra and Tamil Nadu. The non-poor/poor ratio reflects similar patterns across the states.
In the case of childhood vaccination also, the results were in a similar direction to those discussed above. Differences were more pronounced among the EAG states, and particularly for DPT and Measles vaccines (Table 3). The difference between the poor and non-poor was more profound in the states of Uttaranchal, Rajasthan, Uttar Pradesh, Bihar, Jharkhand and Madhya Pradesh for BCG and Measles. The results indicate that differences in vaccination coverage between the non-poor and poor were larger in Bihar irrespective of type of vaccine. For example, BCG coverage was 38% and 83%, DPT was 19% and 65% and Measles about 16% and 61% among the urban non-poor and poor, respectively. Again, in the states of Maharashtra and Tamil Nadu gaps between the poor and non-poor were negligible for all vaccines. Moreover, the level of vaccination was about universal in these states.
Concentration index
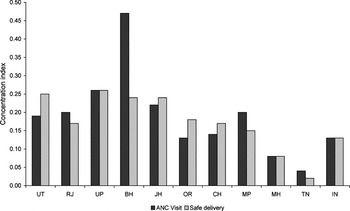
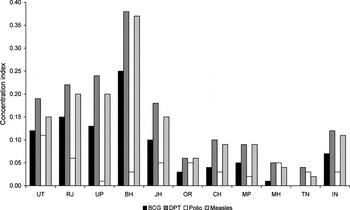
The degree of economic inequality in maternal and child health care utilization for India and the selected states was measured using the concentration index (Figs 1 and 2). Positive values were observed for each health care indicator in urban India and states indicating that the utilization of maternal and child health care is concentrated among the urban non-poor. At the national level, the values of the concentration index for antenatal care and safe delivery were the same (0.13), while for vaccinations it was higher for DPT (0.12) followed by Measles (0.11), BCG (0.07) and Polio (0.03). This shows that the inequality in child vaccination is more profound for DPT followed by Measles and BCG. Wide state-level differences exist in values of the concentration index for each maternal and child health indicator selected for study. For example, the values were high in the northern and eastern states, namely Uttar Pradesh, Bihar and Jharkhand, and low in the southern and western states such as Tamil Nadu and Maharashtra for all the selected indicators, suggesting greater inequality in these states. In general, the results of the concentration index demonstrate that utilization of health care services in India and across selected states is greater among the wealthiest.
Concentration index for selected maternal health indicators, India and selected states, 2005–06.

Concentration index for selected child health indicators, India and selected states, 2005–06.

Multivariate analysis
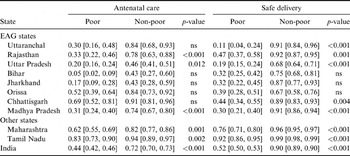
To substantiate the bivariate analysis, multivariate analysis was used to understand the effect of poverty status on utilization of maternal and child health care services. Analysis was conducted for India as well as selected states and the results are presented in the form of predicted probabilities (95% confidence intervals). The analyses demonstrated that after adjusting for the effect of confounding variables, the probability of utilization of maternal and child health care was lower among the poor than non-poor at national and state levels. Table 4 indicates that utilization of antenatal care was higher among the urban non-poor than poor in India. The probability of using antenatal care was 0.44 (95% CI=0.42, 0.46) among the urban poor in India in 2005–06. The corresponding probability among the non-poor was 0.72 (95% CI=0.70, 0.73). The probability of having a safe delivery among the urban poor was 0.52 (95% CI=0.50, 0.53) versus 0.90 (95% CI=0.89, 0.90) among the non-poor in the country. Similar results were observed across the states. The probability of using antenatal care and safe delivery was higher among the urban non-poor compared with urban poor across all the selected states. However, the gap in utilization of maternal services was comparatively higher in the states of Uttaranchal, Uttar Pradesh, Bihar, Jharkhand and Madhya Pradesh compared with Orissa, Chhattisgarh, Maharashtra and Tamil Nadu. This pattern hold true for both services.
Predicted probability and 95% confidence intervals showing the effect of poverty on receiving antenatal care and safe delivery in urban India and selected states, 2005–06
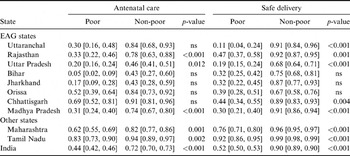
ns, not significant.
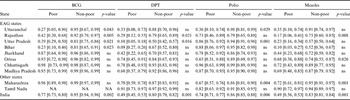
Like maternal health care, the probability of childhood vaccination was higher among the urban non-poor in India for all vaccines (Table 5). The urban non-poor had a higher chance of receiving BCG, DPT, Polio and Measles vaccines compared with their poor counterparts. The statewise results revealed a similar pattern. However, the gap in the probability of vaccination among the urban poor and non-poor was much higher for DPT and Measles vaccines than for Polio and BCG across states.
Predicted probability and 95% confidence intervals showing the effect of poverty on utilization of childhood vaccines in urban India and selected states, 2005–06

NA, not applicable due to small sample size; ns, not significant.
Discussion and Conclusion
Data from large-scale, population-based surveys such as Demographic and Health Surveys (DHSs) are increasingly used to estimate the economic differentials in health and health care utilization within and between countries. These estimates are largely used by planners and policymakers to understand the accessibility and outreach of health care services, as well as to monitor the impact of various programmes implemented by government and non-government organizations and to build health-related policies. Of the health and health care indicators, most attention has been given to maternal and child health as this is crucial for the understanding of the health of a population. Accordingly, this is the prime focus of the Millennium Development Goals. Moreover, the health status of mothers and children is often compared between more affluent and less affluent economic groups, as poverty seems to have a large influence on health status, either directly or indirectly. Though one of the major limitations of DHSs is the absence of information on household income and expenditure, the use of economic proxies to assess household economic status is standard practice and has been widely used to assess gaps in health status and health care service utilization.
Following a similar approach, with a robust measure of poverty, the present study attempted to understand the level and pattern of selected maternal and child health care indicators among the urban poor and non-poor in India and selected states. The poor were identified based on selected economic proxies that were reasonably and statistically able to reflect the economic status of households in urban areas. The results indicated that the urban poor are in a disadvantageous position compared with the non-poor in utilizing maternal and child health services in the country. The cross-state results show a similar picture, but the condition was more vulnerable in the major EAG states, namely Rajasthan, Uttar Pradesh, Madhya Pradesh and Bihar. These states are at the initial stage of urbanization and lack basic health and health care services, amenities and infrastructure. Moreover, the large proportions of urban population of these states are attributed to massive interstate rural–urban migration. These migrants may have little awareness of basic health care as well as weaker kinship networks in their new urban setup. The study demonstrates that the level of maternal and child health care utilization is very low among the urban poor in the country as well as in the states. The condition is even worse in the case of delivery care, i.e. safe delivery. Barely one-third of the urban poor in the country and the states has used safe delivery, presumably because delivery care is more costly. Interestingly, non-poor/poor gaps are negligible for Polio vaccination in the country as well in the states. This is because of the massive Polio rehabilitation campaign launched by the Indian government over the last decade.
While the economic status of households appeared to be a factor in the gap in health care utilization in urban India, the education status of women contributed to mitigating the non-poor/poor gap in maternal and child health care service utilization. With increased maternal education the non-poor/poor difference in services care was minimized, and this is true for all selected indicators, i.e. antenatal care, safe delivery and childhood vaccinations (result not known). Evidence elsewhere has also indicated that educated mothers are more aware of the benefits of antenatal care and safe delivery and, therefore, the utilization of antenatal services and safe delivery was greater among them. On the other hand, non-poor/poor differences in service utilization was greater for higher birth orders and among older women. The non-poor/poor gap in safe delivery was also low among women who went for antenatal care during pregnancy. This indicates that women who are more likely to use antenatal care during pregnancy are also more likely to use safe delivery. For childhood vaccination, use of antenatal care by the mother and possession of a health card were important factors in decreasing the non-poor/poor gap. Substantive non-poor/poor gaps were also evident for other independent variables such as religion and ethnicity. However, the non-poor/poor differences did not differ within subgroups. This indicates that religious and ethnic inequality is not more pronounced in urban setting.
Health care services are concentrated among the urban non-poor in India and states, as seen from the concentration index. The values are higher for antenatal care and safe delivery practice compared with vaccinations in the country as well as states. Again it appears that service utilization is highly concentrated among economically affluent groups in the major EAG states like Bihar, Uttar Pradesh and Rajasthan. After adjusting for the effect of potential socio-demographic confounders, poverty status of households appeared to be a significant barrier to utilization of maternal and child health care services in urban India. Cost seems to be the major barrier for utilization of maternal services. Since most women prefer to go to private providers, mainly due to concern about the quality of public health infrastructure, often cost is a major barrier. Consequently, the majority of child births are delivered at home without skilled medical assistance. Though the coverage of institutional deliveries has increased over time (from 26.8% to 34.1% in 1992–98, and further to 41% in 1998–2006), the progress has been sluggish and inequitable. The coverage of deliveries at public health institutions has increased marginally (from 16.2% in 1998 to 19% in 2005), but this increase was largely observed among the non-poor rather than poor mothers. The extent of increase in utilization of public health facilities was highest in Tamil Nadu followed by Maharashtra. For Uttar Pradesh it remained at the low side.
This study has some important conclusions. The first is that the health status of urban poor mothers and their children is not satisfactory in India, or in the selected study states. The condition is more vulnerable in those states where the level of urbanization is very low. Previous studies have shown that the urban poor have less access to services than people who live in rural areas (African Population and Health Research Centre, 2002; UN-HABITAT, 2006 Gupta et al., Reference Gupta, Thakur and Kumar2008), forcing them to live in more miserable conditions than their counterparts in rural areas. The second point is that the poor/non-poor gap is more pronounced in the case of safe delivery, where not only are the poor far behind their non-poor counterparts, but the level of safe delivery itself is very low reflecting the fact that the urban poor may not be able to afford costly health care services. The findings draw attention to the need to improve the delivery care component. Similar to previous studies, this paper stresses the need to regulate private health facilities in India, especially for the urban poor, in catering for the basic needs of maternal health care, particularly for poor mothers. Overlooking the lethargy, unpreparedness and inefficiency of public health facilities, and unregulated private health facilities in India may exacerbate the high-risk pregnancy outcomes and economic distress on the household, particularly among the poor (Ram et al., Reference Ram, Ram and Singh2006). Finally, non-poor/poor gaps have disappeared or are negligible for Polio vaccination in the whole analysis. This is because of government initiatives in Polio rehabilitation over the last decades. But at the same time attention should be given to other vaccines.
The evidence indicates rapid urbanization in India with substantive differences across the states. However, at present less than a quarter of the country's population is residing in urban areas. Looking at the present scenario, there is huge potential for urban growth in the near future. This rapid urban growth may lead to adverse health conditions among the urban poor. There are very few specific health-related programmes for the urban poor, unlike the National Rural Health Mission (NRHM) which caters specifically for maternal and child health services among the rural population. Therefore, this study argues that policy-makers and programme managers should focus on the urban poor, as well as the rural poor. Special attention should be given to the states of Uttar Pradesh, Madhya Pradesh, Rajasthan and Bihar where the condition of the urban poor is more critical. The successful example of the Tamil Nadu model may be learnt from and replicated in these low-performing states, where unskilled birth attendance constitutes more than three-quarters of all births in the state, and where the majority of those who sought skilled birth attendance during 1992–2006 used private health care institutions (Pathak et al., Reference Pathak, Singh and Subramanian2010). However, before adopting this model an in-depth enquiry into the supply-side variables and quality of care component of the public health delivery system is required. It will not be possible to meet the unmet need among the urban poor and deprived women without expanding the public health system and without improving the quality of physical and human infrastructure in the less developed parts of urban settlements. The public health system must also think about providing better and easier access to emergency care during pregnancy and delivery so that poor and deprived women can use public health facilities at lower cost. Finally, addressing the issue of equity in maternal health care, this continues to pose a formidable challenge, and may hold the key to the achievement of the Millennium Development Goals for India in the near future.
Acknowledgment
An earlier version of this paper was presented at the 8th International Conference on Urban Health, Nairobi (20–24th October 2009), and the comments of the participants helped in the revision of this paper. The authors acknowledge the editor and two anonymous reviewers whose suggestions helped to improve the paper.
Appendix
Variables used in the computation of the wealth index for the urban poor and non-poor in India and selected states, NFHS 2005–06
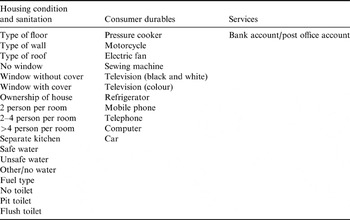
Alpha (reliability) test values for India and selected states, NFHS 2005–06