
Introduction
Graphene with its unique electrical and optical properties has been considered important phenomena[Reference Abbasi, Akbarzadeh, Kouhi and Milani1] that can be explored for designing biosensor devices that can specifically and sensitively detect protein, RNA, and DNA biomarkers from various biologic samples. Graphene oxide (GO) and reduced graphene oxide (rGO) are oxidized counterparts of graphene with different electrical and optical properties. In addition to GO's application in various memory devices and supercapacitors,[Reference Yan, Zhang, Hou, Liu, Liu, Liu and Zhang2] it is currently used in various biologic applications, which include cellular delivery of drugs, nucleic acids, and proteins, mainly because of high affinity binding of GO for these macromolecules.
MicroRNAs are small oligonucleotides of 18–23 base long single-stranded RNAs endogenously expressed in cells and regulate expression levels of various genes.[Reference Viswanathan, Narayanan, Aran, Fink, Paredes, Ajayan, Filipek, Miszta, Tekin, Inci, Demirci, Li, Bolotin, Liepmann and Renugopalakrishanan3, Reference Sekar, Mohanram, Foygel and Paulmurugan4] MicroRNA biogenesis include several intermediates of single- and double-stranded RNAs, and RNA/DNA hybrids.[Reference Macfarlane and Murphy5, Reference Ha and Kim6] MicroRNA detection and visualization in clinical examples is a powerful approach for a wide range of neoplastic and non-neoplastic diseases. In addition, synthetic microRNA mimics and antisense RNA oligos complementary to endogenous microRNAs are currently used as drugs for treating cellular pathogenesis including cancer and neurodegenerative disorders.[Reference Ha7, Reference Kitade and Akao8] In addition, microRNAs expressions are dysregulated in cancer and other cellular diseases. Moreover, circulating microRNAs in the blood stream are very stable; hence, profiling a group of microRNAs associated with each disease is considered important biomarkers for disease diagnosis and treatment evaluation.[Reference Martinez and Peplow9–Reference Gustafson, Tyryshkin and Renwick11] But the need of rapid and sensitive assay systems for profiling these microRNAs with high accuracy is imperative for clinical application of these systems.
Fluorescence spectroscopy, field effect transistor (FET)-based electrical impedance spectroscopy (EIS), and Raman spectroscopy are very sensitive assay readout platforms for measuring the presence and activities of various biomolecules from biologic samples including microRNAs.[Reference Viswanathan, Narayanan, Aran, Fink, Paredes, Ajayan, Filipek, Miszta, Tekin, Inci, Demirci, Li, Bolotin, Liepmann and Renugopalakrishanan3, Reference Madni, Noreen, Maqbool, Rehman, Batool, Kashif, Rehman, Tahir and Khan12, Reference Jang, Kang, Lee, Oh, Vilian, Lee, Han, Park, Cho, Roh and Huh13] Especially promising is fluorescence spectroscopy and has the advantage of being a sensitive probe typically at with a detection limit in the range of 0.5 nM.[Reference Ma, Liu, Wu, Chen, Zheng and Wang14] But to develop these assay systems, biomaterials with electrical, electronic, and spectroscopic properties are needed. Single monolayer graphene and GOs possess all these properties. Especially, the wide spectral absorbance of graphene and its derivatives (GOs and rGOs) provides opportunity to develop assays based on fluorescence.[Reference Hasan, Senger, Mulford, Ryan, Doan, Gryczynski and Naumov15] Several graphene-based sensors have been attempted for measuring various biomolecules of cells for diagnostic applications in biomedicine.[Reference Suvarnaphaet and Pechprasarn16, Reference Wang, Wu and Wei17] Hence, the sensor composed of a single monolayer of graphene designed with microfluidic devices can quantify multiple microRNAs in a single device and also with thermal regulatory mechanism needed for capturing specific microRNAs with specificity from biologic samples, and also can potentially solve the problem of variability between samples with partial automation. Hence in this study, we preliminarily evaluated the potential use of rGO with its specific binding property to nucleic acids along with its optical property for microRNA quantification and to structurally differentiate microRNAs of single- and double-stranded counterparts from biologic samples. We also preliminarily developed and evaluated a prototype device for microRNA quantitation in a monolayer graphene device with FET readout as a proof of concept study to develop future array sensors for microRNAs patterning from tissue and blood samples.
Materials and methods
Materials
RNA oligos of Cy5-conjugated antisense microRNA-21 (Cy5-antimiR-21: Cy5-UCAACAUCAGUCUGAUAAGCUA) and sense-microRNA-21 (miR-21: UAGCUUAUCAGACUGAUGUUGA) with phosphorothioate linkage was synthesized from Protein and Nucleic (PAN) Facility at Stanford University to a purity of 98%. Lipofectamine 2000 transfection agent, RNase A and RNase T1 were purchased from Invitrogen (Thermo Fisher Scientific, Waltham, MA, USA). The other buffers and reagents used were of analytical and molecular biology grade from different vendors approved by Stanford University. Restriction enzyme buffer used for the study was from New England Biolabs (NEB, Ipswich, MA, USA). Cell culture plates, fetal bovine serum, penicillin, streptomycin, sodium bicarbonate, cell culture medium and phosphate-buffered saline were purchased from GIBCO BRL (Frederick, MD, USA).
Methods
Synthesis of rGO
rGO was synthesized at Rice University by the improved GO method.[Reference Muchharla, Narayanan, Balakrishnan, Ajayan and Talapatra18] In brief, the synthesized GO was dispersed in water (0.02 wt.%) with the aid of sonication (bath sonicator, 2–3 h) and was then heated to 80 °C. Subsequently, 3 mL of ascorbic acid was added in 200 µL fraction at different intervals. Immediately upon addition of the ascorbic acid, the color of the solution changed from brown to black, implying the initiation of the reduction, i.e., the formation of rGO. After the complete addition of ascorbic acid, the solution was allowed to stir for an additional 45 min. The rGO powder was then collected by filtration and re-dispersed in a necessary solvent to allow stable dispersions before used for different experiments.
Evaluation of the fluorescence efficiency of single-stranded (Cy5-antimiR-21) and double-stranded (Cy5-antimiR-21-miR-21 hybrid) microRNA-21, and their binding efficiency to rGO by fluorescence quenching assay
To evaluate the fluorescence property of single-stranded (Cy5-antimiR-21) and double-stranded (Cy5-antimiR-21-miR-21 hybrid)RNA oligos, we used 10 pmol of Cy5-antimiR-21 or 10 pmol each of Cy5-antimiR-21 and miR-21 hybridized by annealing in a 50 µL volume containing 1× NEB restriction enzyme buffer 1. The fluorescence signals were measured by spectral scanning from 650 to 800 nm with the excitation wavelength set at 630 nm. Similarly to evaluate the fluorescence quenching efficiency of rGO for Cy5-antimiR-21, we prepared rGO to a stock solution of 0.5 mg/mL in sterile double-distilled water. The solution was briefly probe sonicated for maintaining a homogeneous solution. To evaluate the binding efficiency of both single-stranded (miR-21) and double-stranded (miR-21-antimiR-21 hybrid) RNA oligos to rGO, 10 µg of rGO was mixed with 10 pmol of Cy5-antimiR-21 or 20 pmol of Cy5-antimiR-21-miR-21 hybrid (10 pmol Cy5-antimiR-21 and 10 pmol miR-21 hybridized by annealing) in a total volume of 50 µL containing 1× NEB restriction enzyme buffer 1. The sample was mixed well and incubated at room temperature for 30 min and measured fluorescence by spectrally scanning between 650 to 800 nm with the excitation of 630 nm. The peak value measured at 667 nm was used for relative quantitation of fluorescence signals.
Evaluation of the releasing kinetics of single-stranded-miR-21 (ss-miR-21) and double-stranded-miR-21-antimiR-21 hybrid (ds-miR-21) from rGO
To evaluate the releasing kinetics of ss-miR-21 and ds-miR-21 from rGO, we complexed 10 µg of rGO with 10 pmol of Cy5-antimiR-21 in 25 µL of samples buffer in four replicates. After incubating at room temperature for 30 min, the samples were hybridized with miR-21 of different concentrations (0, 2.5, 5 and 10 pmols) in 25 µl of sample buffer. The samples were further incubated for 30 min at room temperature and measured for Cy5 signal as mentioned above. The peak signal from different samples measured at 667 nm (triplicates for each condition) was used for plotting dose–response graph for single- and double-stranded miRNA binding to rGO.
Evaluation of the concentration-dependent fluorescence quenching efficiency by rGO
To evaluate the concentration of Cy5-antimiR-21 that can be fluorescently quenched by 1 µg of rGO, we prepared different concentration of Cy5-antimiR-21 (62.5 fmol to 2 pmol) with and without 1 µg of rGO in 50 µL of 1× sample buffer. The samples were incubated for 30 min at room temperature and fluorescence signals were measured by spectral scanning as described above. The results were quantitatively plotted to compare the efficiency of quenching rendered by 1 µg of rGO.
RNase (RNase A and RNase T1) treatment to improve the sensitivity of the assay while differentiating ss-miRNA from ds-miRNAs from biologic samples
To evaluate RNase-mediated cleavage of ss- and ds-miRNA samples, different combination of samples with various conditions mentioned in the above methods were separated for both rGO and rGO-free fractions by centrifuging at 2000 g for 5 min. We evaluated fluorescence signal from both the fractions before and after treatment with ten units of either RNase A or 100 units of RNase T1 by incubating at room temperature for 10 min. In addition, the RNase treatment was also performed before the addition of rGO to test the effect of different structural form of miRNAs in producing Cy5-fluorescence signal.
Quantitation of intracellular ss-miRNA by rGO-mediated fluorescence quenching
To differentiate intracellular single- and double-stranded microRNA-21 in intact cells, we plated MDA MB231 cells in 12-well plate (1 × 10⁵ cells/well). The cells were transfected with 100 pmol of Cy5-antimiRNA-21 using lipofectamine 2000 transfection agent by following the manufacturers protocol. After 24 h, the cells were washed twice to remove any untransfected miRNA, and treated with 50 µg of rGO in the medium for further 24 h. The cells were imaged by fluorescent microscope for Cy5 signal.
MicroRNA functionalization in a single-layer graphene and measurement of single- and double-stranded microRNAs by EIS
The graphene layer placed on a SiO2 dielectric insulator was washed with anhydrous dimethylformamide (DMF) to remove any residual impurities. The device was then incubated with 5 mM solution of 1-pyrenebutanoic acid succinimidyl ester (in anhydrous DMF) for 2 h at room temperature and washed twice with anhydrous DMF and once with deionized water. As obtained linker-modified graphene device was incubated with 200 pmol of amino functionalized antisense-miR-21 in 100 mM Na2CO3–NaHCO3 buffer (pH 9.0) for 2 h at 42 °C, and rinsed three times with sterile double-distilled water to remove any unreacted oligonucleotides. The device was then incubated for 30 min with 0.1 M ethanolamine to deactivate any excess reactive linker molecules on the graphene surface. The washed device was then used for hybridization with miR-21. The device was then incubated with 58 pmols of miR-21 in TE buffer [10 mM Tris-HCl (pH: 7.5; 1 mM EDTA)] for hybridization by incubating in a humid chamber for 30 min at 42° C. After washing three times with sterile distilled water, the device was subjected for impedance measurement. The device was also measured for change in electrical resistance every step after functionalization.
Results
Evaluation of fluorescence signals of single-stranded (Cy5-antimiR-21) and double-stranded microRNA (Cy5-antimiR-21-miR-21 hybrid) reveals the self-quenching properties of fluorescence signal by the complementary strand upon hybridization
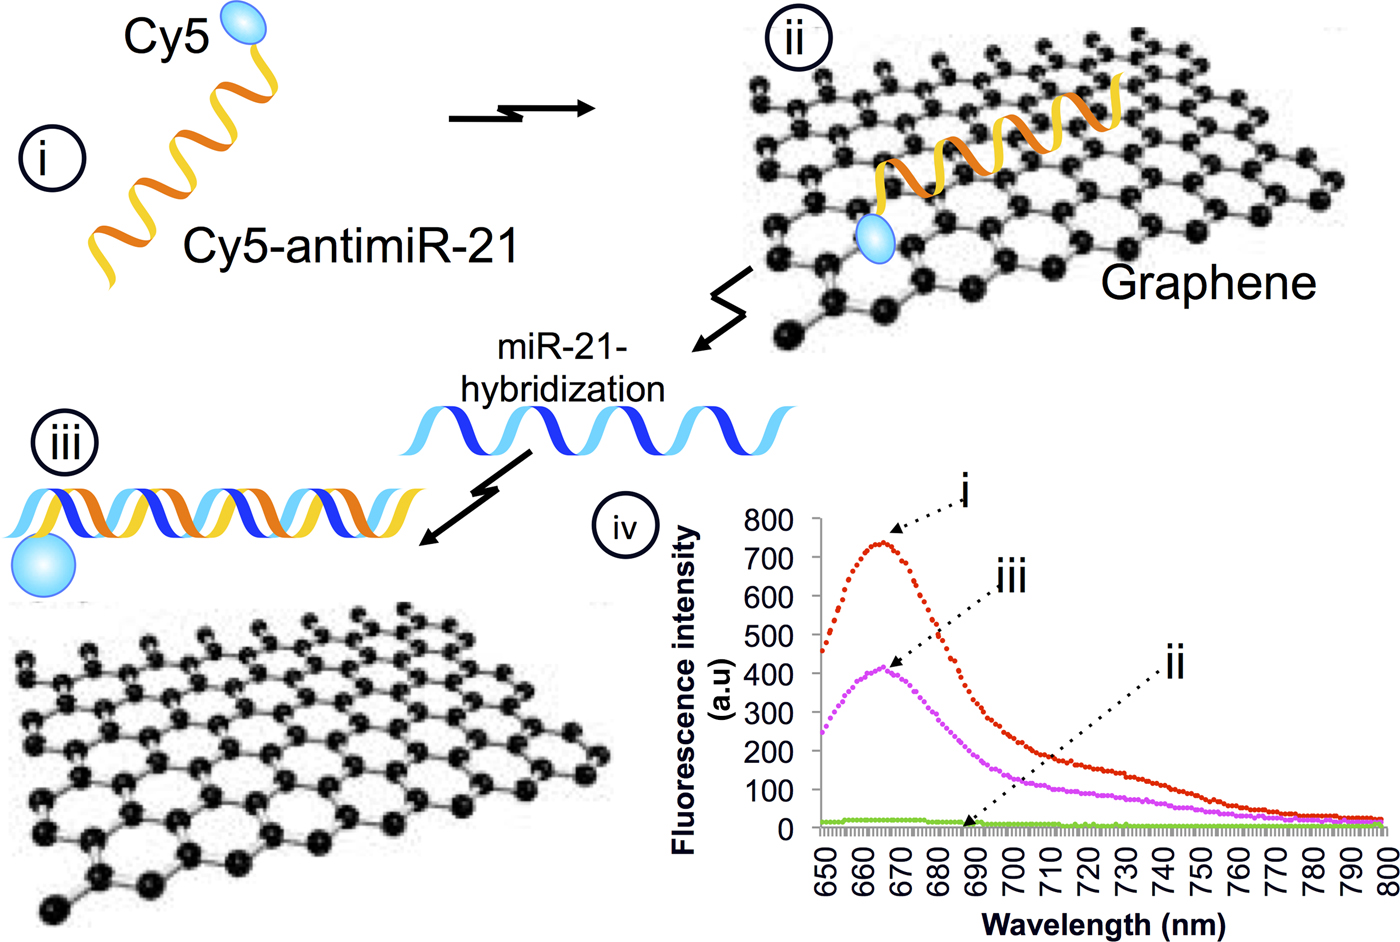
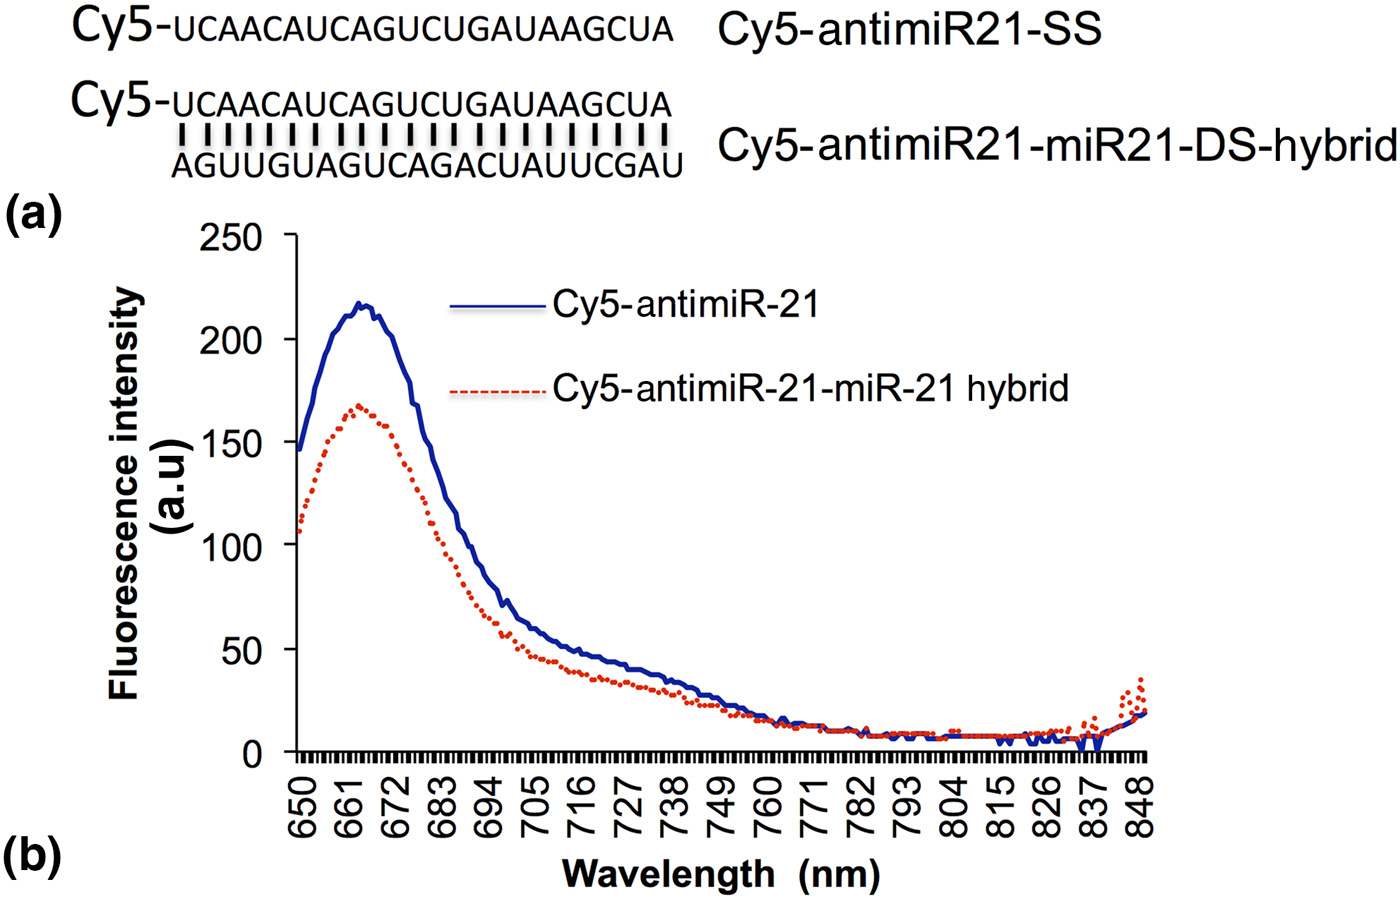
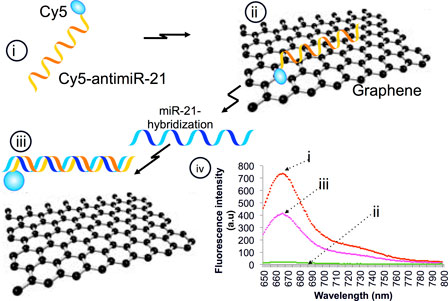
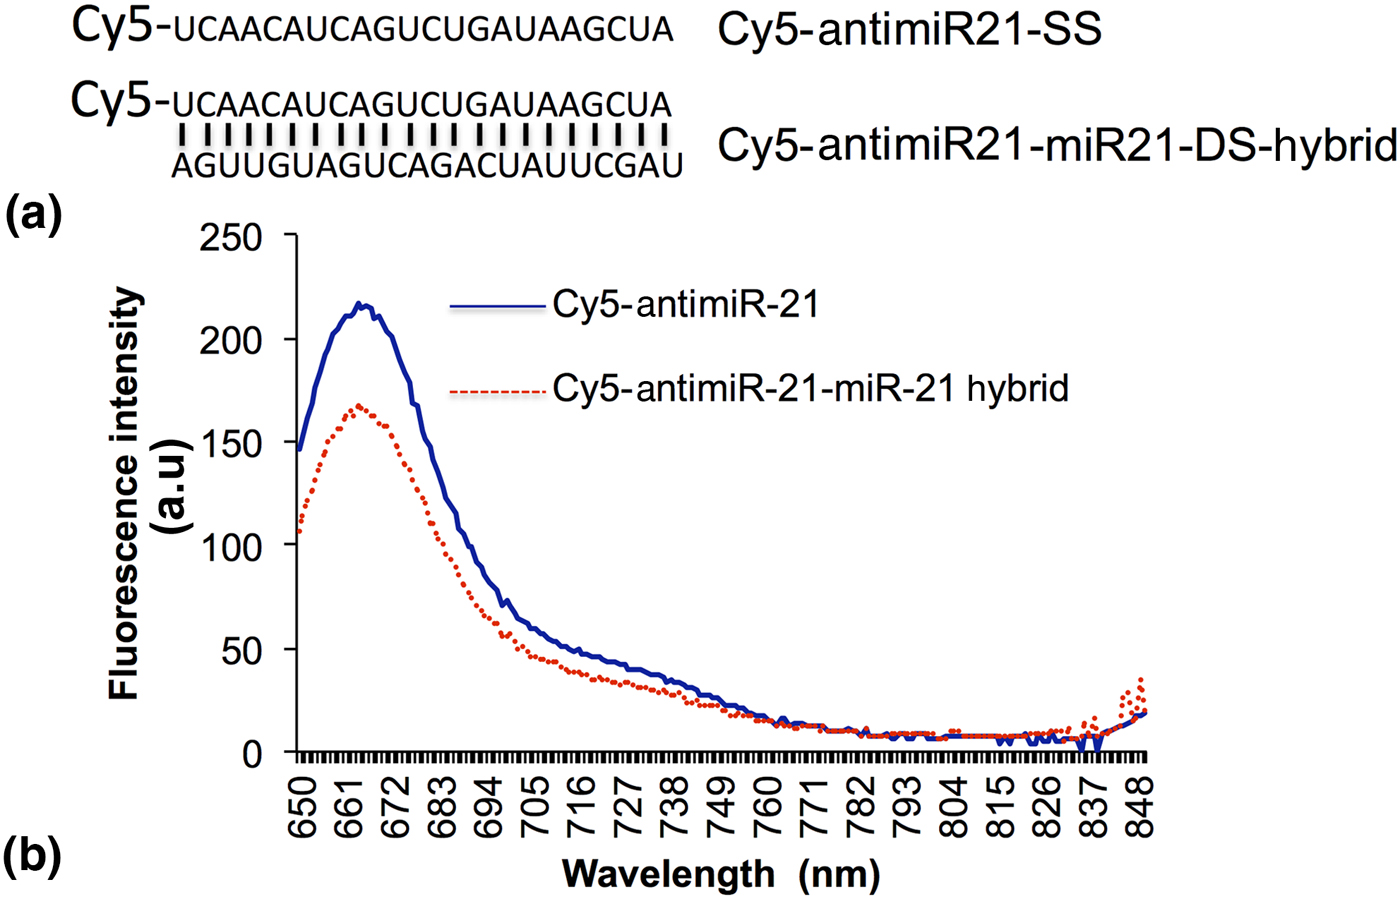
The aim of this study is to explore the potential use of graphene derivatives for developing fluorescence sensors that can distinguish single- and double-stranded microRNA sequences for various biologic applications including the one for the development of future array sensors for quantitative detection of multiple microRNAs from clinical samples. We first wanted to use the wide spectral light absorption property of rGO for developing fluorescence quenching sensors to differentiate single- and double-stranded miRNA hybrids (Fig. 1). We synthesized 5’-Cy5-fluorphore tagged antisense miR-21 (Cy5-antimiR-21) and a complementary microRNA-21 without fluorophore. We measured the fluorescence emission signal intensity of 1 pmol of Cy5-antimiR-21 before and after hybridization with equimolar concentration of miR-21. The result shows significant loss of fluorescence signal (20 ± 5%) when a complementary strand is hybridized to a fluorescently labeled microRNA (Fig. 2).
Schematic work flow explaining the concept of rGO-mediated fluorescence quenching that measures the miRNA hybridization-associated fluorescence recovery: (i) Cy5-antimiR-21, (ii) rGO in contact with Cy5-antimiR-21 quenches fluorescence through strong electrostatic proximity binding with hydrogen bonds, (iii) hybridization of miR-21 to Cy5-antimiR-21 releases miR-antimiR hybrid and recovers fluorescence signal, and (iv) graph showing the theoretical fluorescence signal expected at different stages of this work flow.

(a) Nucleotide sequences of single- and double-stranded miRNA-21 with its Cy5 fluorophore at the 5’ end, and (b) graph showing Cy5 fluorescence measured from Cy5-antimiR-21 and Cy5-antimiR-21-miR-21 hybrids by spectral scanning from 650 to 800 nm with the excitation set at 630 nm.
rGO concentration-dependent evaluation revealed the optimal concentration of miRNA to rGO ratio is essential for achieving efficient quantification of miRNA
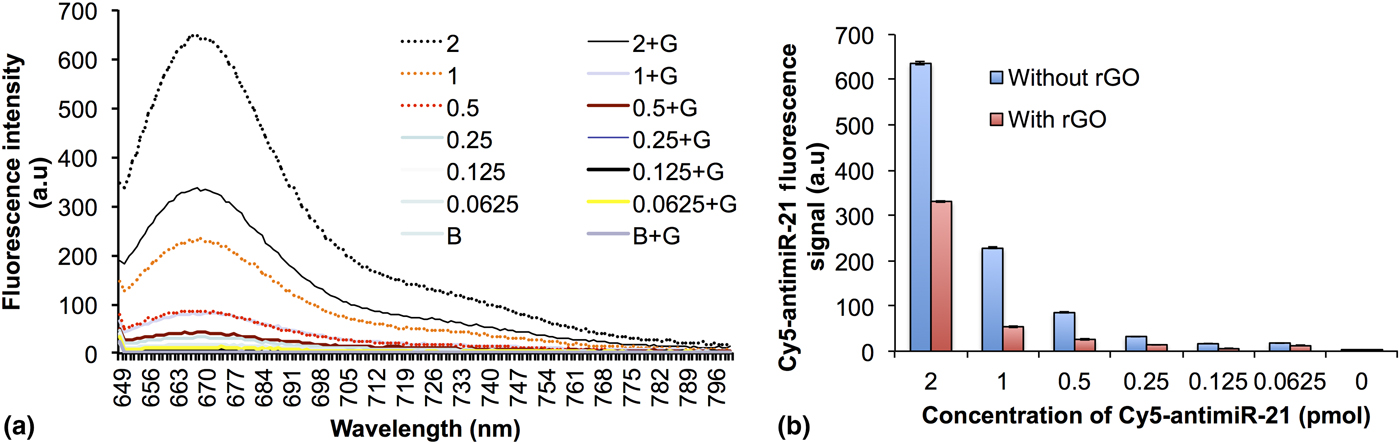
We further evaluated the minimum concentration of rGO needed for successful quenching of Cy5 fluorescence signal produced from Cy5-antimiR-21 by using 1 µg of rGO with different concentration of Cy5-antimiR-21 (62.5 fmol to 2 pmol). The spectral scanning of fluorescent signal measured from different samples revealed that 1 µg of rGO can efficiently quench Cy5 signal that arises from 1 pmol of Cy-5-antimiR-21 without much background signal (Fig. 3) compared with 2 pmol. Hence we used 1:1 ratio (1 pmol of Cy5-antimiR-21 to 1 µg rGO) of Cy5-antimiR-21 to rGO for all other experiments.
(a) Graph showing the rGO-mediated Cy5-antimiR-21 fluorescence quenching evaluated by spectral scanning by exciting at 630 nm, and (b) quantitative graph showing the quenching efficiency of rGO.

Studying of binding efficiency of single-stranded (ss-miR-21) and double-stranded miR-21 (ds-miR-21) to rGO reveals a single-stranded miRNA exhibits stronger binding affinity compared with its double-stranded counterpart
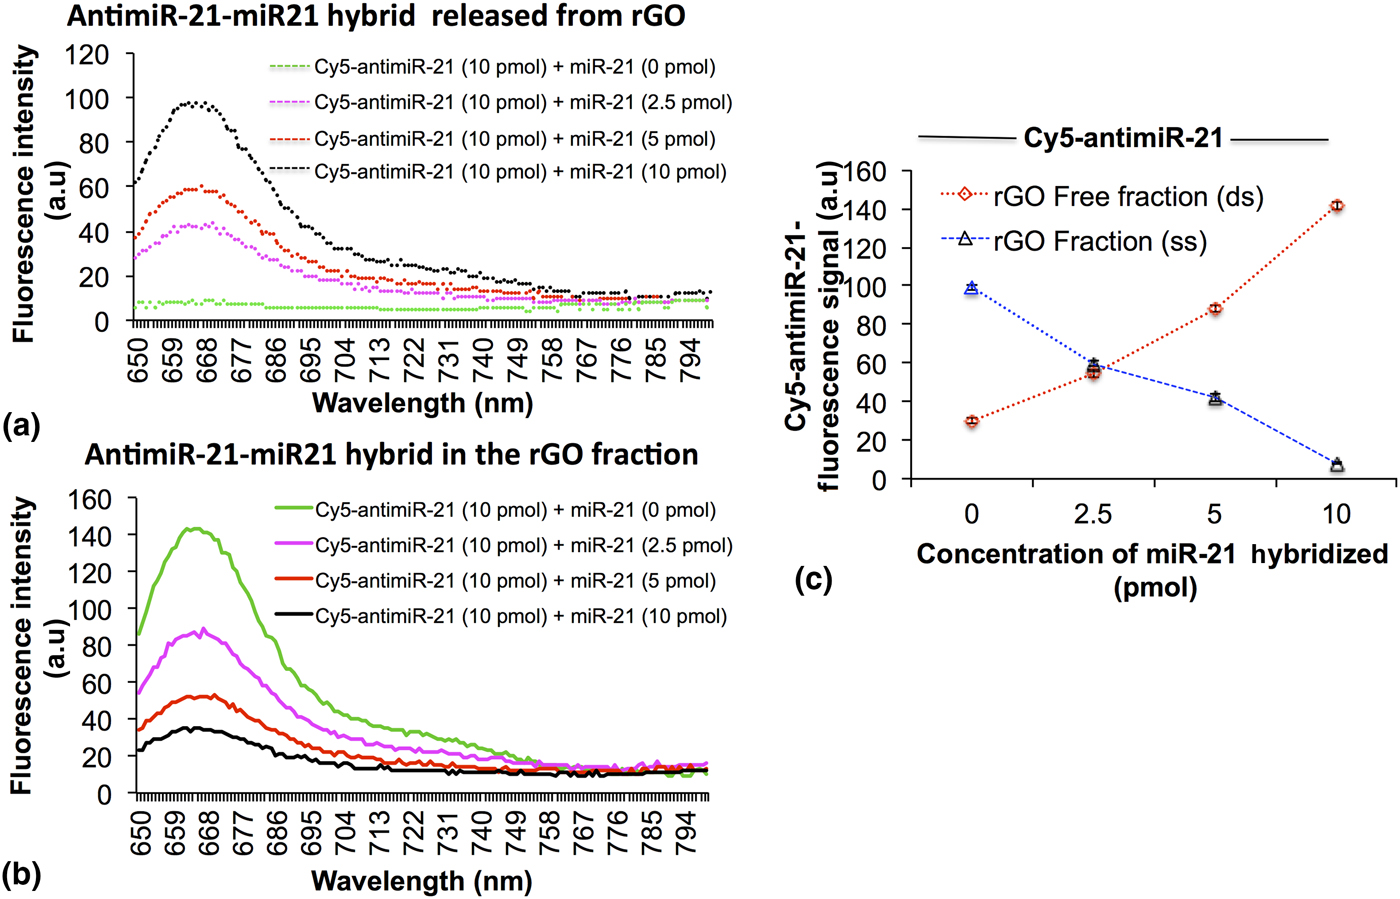
To evaluate the binding efficiency of both ss-miRNA and ds-miRNA, 10 pmol of Cy5-antimiR-21 without and hybridizing with different concentrations of miR-21 (2.5, 5, and 10 pmols) were evaluated for the level of recovered fluorescence signal after complexing with 10 µg of rGO. The rGO-bound and rGO-free fractions were separated by centrifugation and measured for Cy5 fluorescence signal. The result shows miR-21 concentration-dependent recovery of fluorescence signal from Cy5-antimiR-21-miR-21 hybrid in the rGO-free fraction. In contrast, the Cy5 fluorescence from Cy5-antimiR-21 was completely quenched by rGO through its strong binding affinity to ss-miRNA [Fig. 4(a)]. Upon hybridization of miR-21, the ds-antimiR-21-miR-21 hybrid released from rGO recovered fluorescence signal. The fluorescence signal showed a concentration-dependent recovery from miR-21 hybridization to the Cy5-antimiR-21 [Fig. 4(b)]. The results of fluorescence signals from ss-miR-21 and ds-miR-21 showed dose–response with significant level of correlation [Fig. 4(c)].
Fluorescence signal of Cy5-antimiR-21 measured from rGO fraction and the rGO-free fraction before and after hybridizing with different concentrations of miR-21: (a) fluorescence signal measured from rGO-free fraction, (b) fluorescence signal measured from rGO fraction, and (c) quantitative evaluation showing the concentration-dependent hybridization in different fractions.

RNase A treatment significantly improves the sensitivity of miRNA quantification by increasing the intensity of fluorescence signal
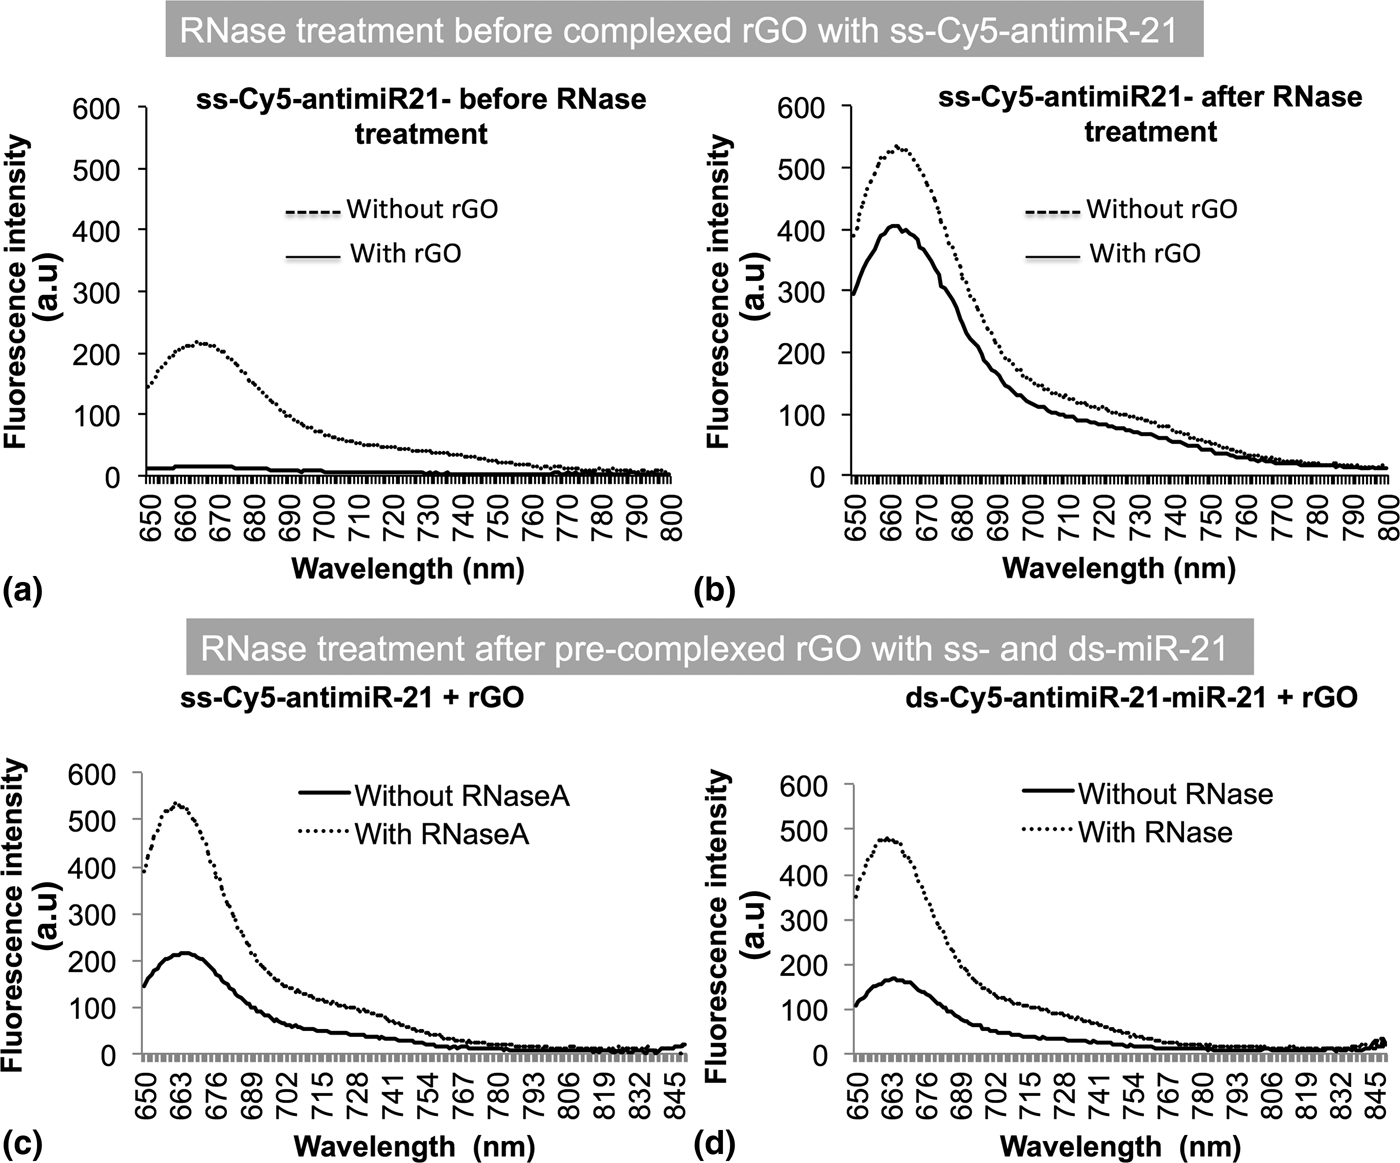
All the above results clearly demonstrated that ss-Cy-5-antimiR-21 signal shows nearly 20% reduction in Cy5 signal when it was hybridized with miR-21 through self-quenching by ds-hybrid. Similarly, rGO is able to completely quench fluorescence signal that arises from ss-Cy5-antimiR-21 with its strong binding while showing no quenching effect on ds-Cy5-antimiR-21-miR-21 hybrid. We asked ourselves weather treatment of rGO-bound and rGO-free fractions with RNase A before fluorescence measurement can have any improvement in the sensitivity of the assay system. Hence we complexed 1 pmol of ss-Cy5-antimiR-21 with and without the use of 10 µg of rGO and measured fluorescence signal before and after treated with 10 units of RNase A. The result shows nearly threefold stronger fluorescence recovery from samples measured after RNase A treatment compared with the same before [Figs. 5(a) and 5(b)]. In addition, RNase A treatment recovers similar level of sensitivity from both ss-Cy5-antimiR-21 and ds-Cy5-antimiR-21-miR-21 hybrids [Figs. 5(c) and 5(d)]. We further tested 1 pmol of either ss-Cy5-antimiR-21 or ds-Cy5-antimiR-21-miR-21 hybrid after complexed with 10 µg of rGO and measured for fluorescence signal before and after RNase A treatment. The result showed complete quenching of fluorescence signal from ss-Cy5-antimiR-21. In contrast, even though, ds-Cy5-antimiR-21-miR-21 is not expected to bind to rGO, the proximity of this molecule with hybrid RNA significantly reduced fluorescence signal. But when treated with RNase A before measurement, the fluorescence recovery, as expected, was almost equal to ss-Cy5-antimiR-21 (Fig. 5).
Sensitivity of fluorescence enhancements and the RNase A cleavage efficiency-associated fluorescence enhancements of Cy5-antimiR-21 and Cy5-antimiR-21-miR-21 hybrids with and without rGO measured by spectroscopy; (a) ss-Cy5-antimiR-21 measured for fluorescence signal after complexing with and without rGO, (b) ss-Cy5-antimiR-21 treated with RNase A and measured for fluorescence after complexing with and without rGO, (c) ss-Cy5-antimiR-21 complexed with rGO and measured for fluorescence signal before and after treatment with RNase A, and (d) ds-Cy5-antimiR-21-miR-21 hybrid complexed with rGO and measured for fluorescence signal before and after treatment with RNase A.

Evaluation of RNase T1 as a selective enzyme for differentiating ss-miRNA from ds-miRNA for potential improvement of detection sensitivity and specificity while adopting its use of specific applications in differentiating these molecules in intact cells
RNase A can digest both single- and double-stranded RNAs of any lengths. In contrast, RNase T1 is an enzyme that selectively digests single-stranded RNA while leaving ds-RNA–RNA hybrid unaffected. Since our interest was not only to develop assay that can quantify microRNAs, we are also interested in selectively differentiating ss-miRNA from ds-miRNA hybrids in tissue samples where we use our antimicroRNA therapy. Hence we asked if complex microRNAs isolated from cells or tissues after treatment using antisense microRNAs with rGO and the use of a separation protocol along with RNase T1 treatment could potentially quantify both single- and double-stranded miRNAs accurately and solve the problem, which is currently very difficult to address.
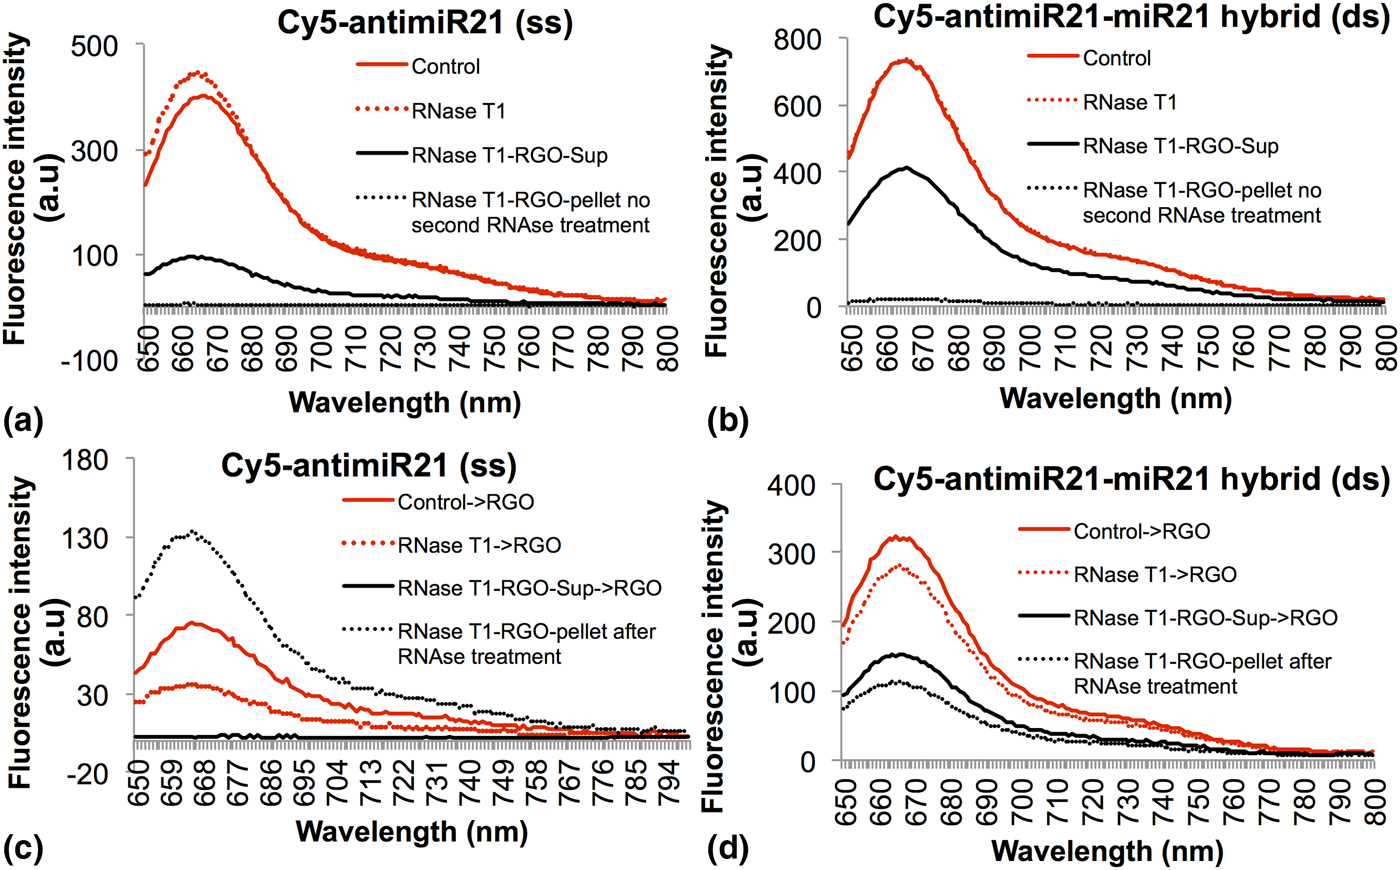
To characterize the efficiency of RNase T1 in addressing various concerns, such as activity level in a wide range of buffers, cleavage efficiency in various conditions, and rapid and complete cleavage of all ss-RNAs present in the sample, we first evaluated fluorescent signal levels of ss-Cy5-antimiR-21 and ds-Cy5-antimiR-21-miR-21 hybrids with and without RNase T1 treatment. As expected, the Cy5 signal from ss-Cy5-antimiR-21 showed slight increase in signal, while no difference was observed from ds-Cy5-antimiR-21-miR-21 hybrid [Figs. 6(a) and 6(b)]. Similarly, when we measured fluorescence signal from rGO-free fractions of RNase T1-treated ss-Cy5-antimiR-21 and ds-Cy5-antimiR-21-miR-21 hybrids, we found significant level of Cy5-signal in ds-miRNA sample compared with ss-miRNA. The rGO fractions of both the samples showed no fluorescence signal [Figs. 6(a) and (b)]. In addition, when both ss-Cy5-antimiR-21 and ds-Cy5-antimiR-21-miR-21 hybrids were pretreated with RNase T1 before addition of rGO, the result showed significantly lower level of fluorescence signal from ss-miRNA compared with ds-miRNA [Figs. 6(c) and 6(d)].
Evaluation of RNase T1 as a potential enzyme for the characterization of single- and double-stranded miRNAs: (a) ss-Cy5-antimiR-21 measured for fluorescence signal before and after RNase T1 treatment, and after separation of rGO-bound and rGO-free fractions from RNase T1 treated samples, (b) ds-Cy5-antimiR-21 measured for fluorescence signal before and after RNase T1 treatment, and after separation of rGO-bound and rGO-free fractions from RNase T1 treated samples, (c) ss-Cy5-antimiR-21 measured for fluorescence signal by treatment with RNase T1 and mixed with rGO, and the rGO-bound and rGO-free fractions further treated with RNase T1 of the miRNAs of different forms present in the fractions, and (d) ds-Cy5-antimiR-21 measured for fluorescence signal by treatment with RNase T1 and mixed with rGO, and the rGO-bound and rGO-free fractions further treated with RNase T1 for the miRNAs of different forms present in the fractions.

rGO-mediated fluorescence quenching of intracellular ss-miRNA in cells pre-delivered with ss-Cy5-antimiR-21
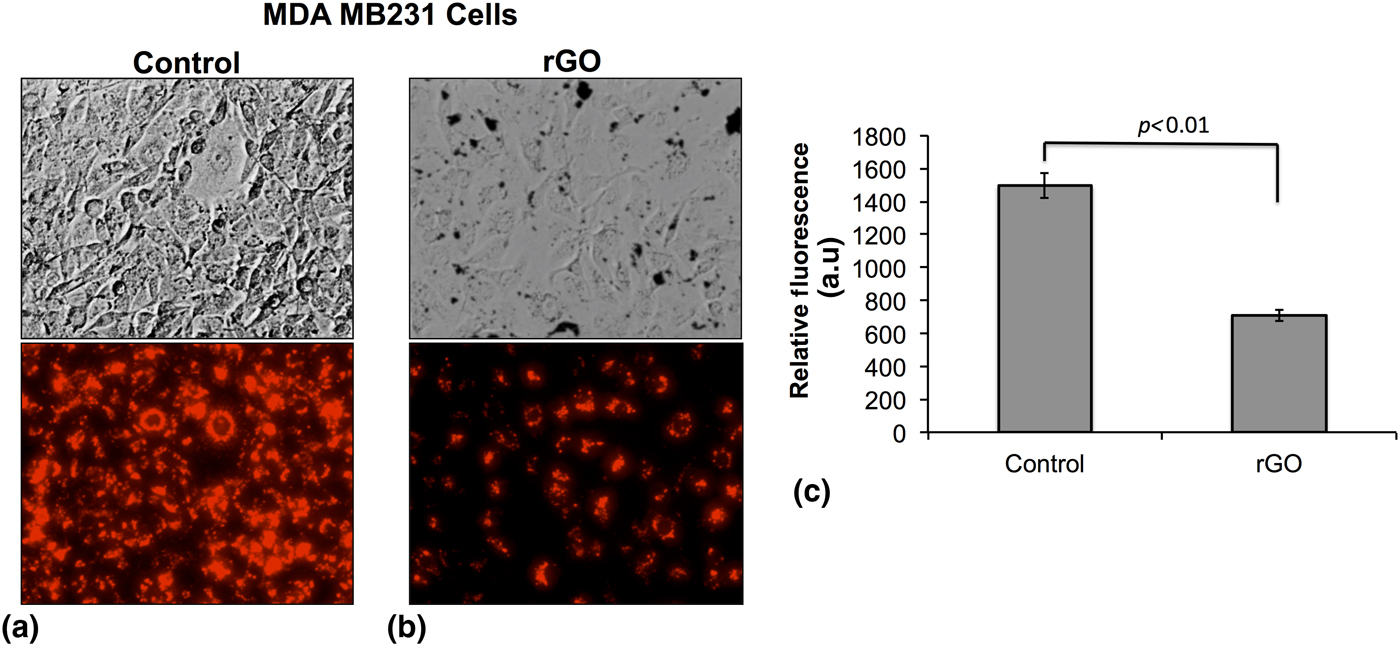
To further address an important biologic problem of differentiating intracellular single- and double-stranded microRNA-21 in intact cells, especially during antisense microRNA therapy, we used MDA MB231 cells transfected with 100 pmol of Cy5-antisense miRNA-21. After 24 h, the cells were washed twice to remove any untransfected miRNA, and treated with 50 µg of rGO in the medium for further 24 h. The cells transfected with Cy5-antisense miRNA-21 and not treated with rGO served as control. The cells were imaged by fluorescent microscope for Cy5 signal. In both the cells, the endogenous microRNA-21 is expected to hybridize with the transfected Cy5-antimiR-21 leaving excess Cy5-antimiR-21 as ss-form. Hence, when we deliver rGO, it binds to ss-Cy5-antimiR-21 and quench its fluorescence leaving the Cy5 signal arising from ds-Cy5-antimiR-21-miR-21 hybrid for detection. As expected the cells treated with rGO showed nearly twofold lower fluorescence signal compared with untreated cells (Fig. 7).
Evaluation of fluorescence signal from MDA MB231 cells transfected with Cy5-antimiR-21 and treated with 50 µg/mL of rGO for 24 h: (a) MDA MB231 cells transfected only with 1 pmol of Cy5-antimiR-21 (top: bright-field image and bottom: Cy5 fluorescence signal), (b) MDA MB231 cells transfected with 1 pmol of Cy5-antimiR-21 and treated with 50 µg/mL rGO measured for Cy5 fluorescence signal, and (c) quantitative graph showing the amount of Cy5 fluorescence signal measured from cells shown in (a) and (b).

Single-layer graphene-based FET sensor specifically differentiated between ss-antimiR-21 and miR-21-antimiR-21 hybrids
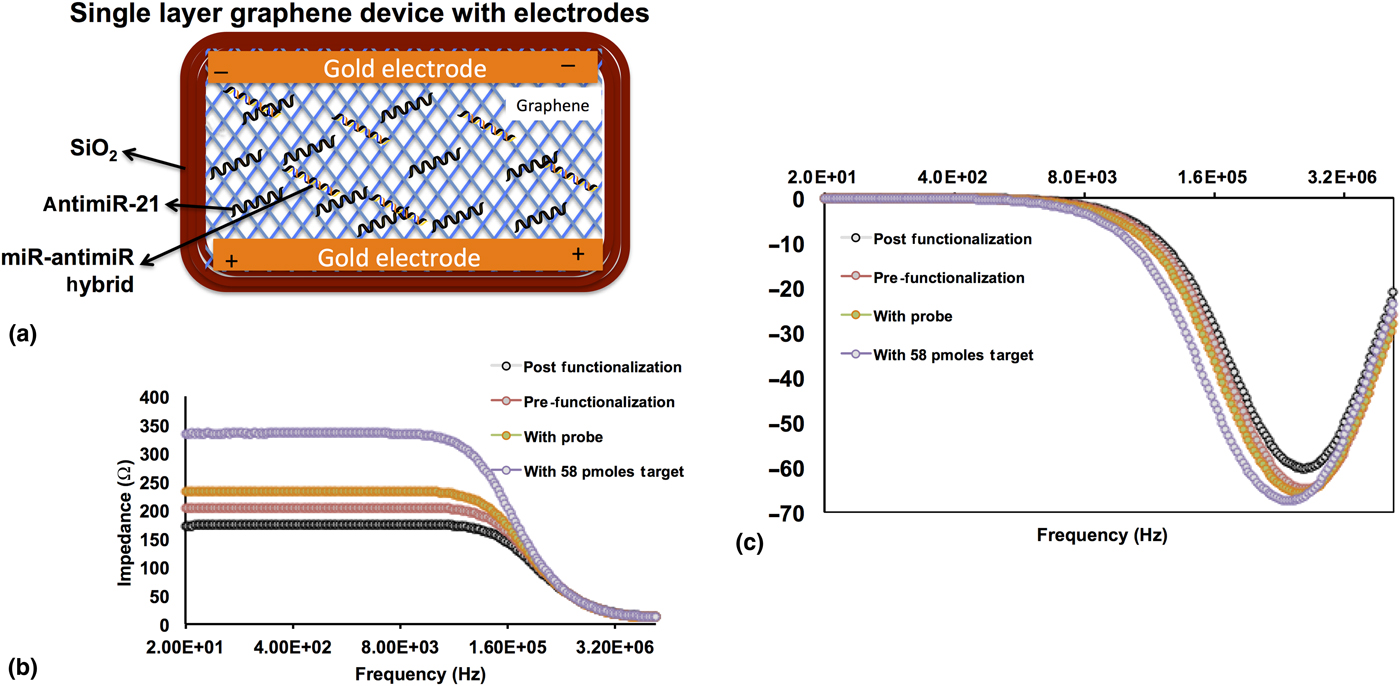
We prepared a single monolayer of graphene, in between two gold electrodes. The graphene covers 5 mm (length) × 3 mm (width) area, and underneath, there is a dielectric insulator layer (500 nm thick silicon dioxide) fabricated on a silicon substrate [Fig. 8(a)]. To selectively capture miRNAs, we grafted N-terminal amino-modified antisense miRNA-21 on the graphene sensors via a linker molecule (1-pyrenebutanoic acid succinimidyl ester). One end of this linker attaches firmly to the graphene surface through p-p interaction with a pyrene group and on the other end covalently reacts with the 3’-amino group on the antisense miRNAs. Then the sense miR-21 was hybridized by incubating at 42 °C followed by slow cooling to room temperature before washing. We analyzed the sensors at each stage after functionalization (before linker conjugation, after linker conjugation, after antimiR-21 functionalization, and after hybridization with miR-21) using electrical impedometry. The result shows significant change in resistance after each step [Figs. 8(b) and 8(c)]. The result clearly confirms the feasibility of this strategy for sensor automation with microfluidic devices for future application for microRNA patterning from clinical samples.
Single-layer graphene device tested for microRNA structural differentiation by field effect transistor-electrical impedance spectroscopy (FET-EIS). (a) Schematic illustration of FET-EIS sensor with various components and structural ss-miRNAs and ds-miRNAs, (b) and (c) EIS measurements of FET sensor before and after functionalized with linker, and antimiR-21 and antimiR-21-miR-21 hybrids.

Discussion
In this study, we evaluated the potential value of graphene as an electrical two-dimensional nanomaterial for developing sensors that can detect, quantify, and structurally differentiate microRNAs in solution and inside intact cells. We used fluorescently labeled microRNA-21 with its complementary RNA oligo for the study. rGO and a single layer of graphene placed on a silicon oxide dielectric insulator were used for initial evaluation for their potential use. We first exploited the wide spectral absorbance property of rGO as a quenching material for designing sensors for fluorescently labeled microRNAs. We showed proximity-based quenching as a strategy for measuring single- and double-stranded microRNAs labeled with Cy5 fluorophore. The Cy5 signal that arose from ss-Cy5-antimiR-21 showed some drop in fluorescence (20 ± 5%) when annealed with sense microRNA as Cy5-antimiR-21-miR-21 hybrid. In contrast, ss-Cy5-antimiR-21 showed almost >90% drop in fluorescence signal when combined with rGO. While rGO quenched fluorescence signal from single-stranded Cy5-antimiR-21 dose dependently, it also clearly confirmed its very high-affinity binding for single-stranded RNA compared with RNA–RNA hybrid (Figs. 3–5). In addition, our results also show that Cy5 fluorescence from ss-Cy5-anti-miR-21 was significantly quenched by the miR-21 hybridization through its intramolecular absorbance even before the addition of rGO. Hence, we hypothesized that the RNAse digestion of rGO fraction after hybridization can digest all RNA molecules and the released free Cy5 can potentially increase the fluorescence signal intensity, which can further improve the sensitivity of the assay system. As expected, we observed a significant increase in fluorescence signal from rGO and rGO-free fractions upon RNAse treatment (Fig. 5). Previously, it has been shown that desorption/ionization mass spectrometry along with rhodamine-complexed GO (R6G-GO) through simple π–π stacking and electrostatic interaction showed increase in signal upon binding of ss-miRNA.[Reference Huang, Chiu, Li and Huang19] This study also used microRNAs without any labeling for its quantification.
MicroRNAs are currently serving as therapeutic targets in several diseases including cancer.[Reference Muchharla, Narayanan, Balakrishnan, Ajayan and Talapatra18] In particular, oncogenesis has been shown to be associated with dysregulated expression of microRNAs.[Reference Kitade and Akao8, Reference Akao, Nakagawa, Hirata, Iio, Itoh, Kojima, Nakashima, Kitade and Naoe20–Reference Reshmi and Pillai23] Inhibition or restoration of endogenous miRNA is a unique and effective strategy to restore cellular homeostasis, and is considered a promising new generation of molecularly targeted treatment for cancer therapy.[Reference Kota, Chivukula, O'Donnell, Wentzel, Montgomery, Hwang, Chang, Vivekanandan, Torbenson, Clark, Mendell and Mendell24, Reference Liu, Kelnar, Liu, Chen, Calhoun-Davis, Li, Patrawala, Yan, Jeter, Honorio, Wiggins, Bader, Fagin, Brown and Tang25] The chemically modified oligonucleotides of 18–22 bases have been used as antisense miRNAs to block the functions of endogenous miRNAs that are involved in major cellular processes.[Reference Krutzfeldt, Rajewsky, Braich, Rajeev, Tuschl, Manoharan and Stoffel26, Reference Ross, Carlson and Brock27] Antagonizing miR-10b by antisense-miR-10b has been reported to be an effectively inhibited metastatic spread to the lungs, without affecting the growth of previously metastasized tumors in a mouse model of human breast cancer.[Reference De Palma and Naldini28, Reference Ma, Reinhardt, Pan, Soutschek, Bhat, Marcusson, Teruya-Feldstein, Bell and Weinberg29] Others and we have used miRNAs as therapeutic targets in breast, hepatocellular carcinoma, lung, and brain cancers.[Reference Devulapally, Foygel, Sekar, Willmann and Paulmurugan30–Reference Cheng, Bahal, Babar, Pincus, Barrera, Liu, Svoronos, Braddock, Glazer, Engelman, Saltzman and Slack37]
Antisense RNA-mediated knockdown of endogenous miR-21 has been reported to impair tumor cell growth, induce apoptosis, and reduce the migration and invasion of cancer cells expressing miR-21 at high levels.[Reference Asangani, Rasheed, Nikolova, Leupold, Colburn, Post and Allgayer38–Reference Zhu, Wu, Wu, Nie, Sheng and Mo44] Even though microRNA therapy has been extensively studied, and is currently at various levels of clinical trials, still there is no method available that can differentiate single- and double-stranded miRNAs in antisense miRNA therapy in intact cells. In this study, we evaluated the use of rGO to indirectly measure the intracellular RNA–RNA hybrids by quenching single-stranded RNA fluorescence in cells (Fig. 7). Since miR-21 and antimiR-21 hybridize efficiently in vitro and in vivo inside the cells at their native environment, we extended our evaluation for the real device we plan to use in this study. We used monolayer graphene sheet on a silicon oxide dielectric insulator layer for functionalizing amino-conjugated antimiR-21 (NH2-C6-antimiR-21). The conjugation of antimiR-21 was used as a capture molecule for quantifying miRNAs through hybridization. At each stage of functionalization process, we measured the change in the resistance of the sensor. After antimiR-21 functionalization, the device was hybridized with different concentration of miR-21 (232, 116, 58, and 29 pmols) and tested for the resistance using FET-EIS. The results showed significant increase in resistance after hybridization (Fig. 8). The results showed significant level of dynamic range. The current minimum detection rate was estimated to be 58 pmols. We are currently working on combining this strategy with microfluidic channel-based hybridization and washing steps with thermal control to improve the efficiency with minimal variability.
In summary, we have preliminarily evaluated the potential use of single-layer graphene and rGO for designing sensors for measuring microRNAs using fluorescent spectroscopy and electrical resistance impedometry. The high-affinity binding of ss-miRNA to rGO and the wide spectral absorbance property of rGO facilitate for designing fluorescence-based sensors, while the electrical property provides options for developing FET-based impedance sensors. Developing array sensors with this platform for a panel of microRNAs in combination with microfluidic automated processing system for isolating microRNAs from blood and other clinical samples would benefit the translational clinical application of this nanomaterial from bench to bedside and benefit the patient community.
Funding sources
This research in part was supported by the Center for Cancer Nanotechnology Excellence for Translational Diagnostics (CCNE-TD) at Stanford University through an award (Grant no: U54 CA199075) from the National Cancer Institute (NCI) of the National Institutes of Health (NIH).
Acknowledgments
The authors thank the Canary Center at Stanford, Department of Radiology for facility and resources. They also thank SCi3 small animal imaging service center, Stanford University School of Medicine for providing imaging facilities and data analysis support. Dr. Jey Ananta and Dr. Devulapally for their technical helps in some experiments are acknowledged. Dr. Venkatesan Renugopalakrishnan owes his inspiration toward pursuit of miRNA to Suraj Renugopalakrishnan.