Introduction
Facing the developing globalization and intense market competition, companies’ survival has greatly depended on their rapid responses to customers’ merging expectations and their products’ comprehensive performances, including functions, technologies aesthetics, and so on. Designers need to analyze customer needs precisely to decompose design tasks properly into factors and take them into account during the whole design process. Specifically, aesthetic factor has been viewed as dramatically important in recent years. Product form not only serves for function but also serves as an interface to users showing the product's style, fashion, and taste. Style is considered as aesthetic agreement between people by Burns (Reference Burns2006). Visual aesthetic is highlighted by Knight and Sass (Reference Knight and Sass2010) for multiple design domains. Visually aesthetic value can be conveyed through the alignment and properties of form factors like lines, curves, and paddings. Aesthetic elements can be extracted from product forms with computational methods (Catalano et al., Reference Catalano, Giannini, Monti and Ucelli2007). Given the fast-developing intelligent computing technologies (Wu, Reference Wu2020; Cio et al., Reference Cio, Ma, Vadean, Beltrame and Achiche2021; Longo et al., Reference Longo, Padovano, Cimmino and Pinto2021), aesthetics quantification is increasingly important to enhance form design performances.
Aesthetic measure is a promising new method for aesthetics quantification in the product form design process, especially applicative in the evolutionary design process. Aesthetic measure was proposed by Birkhoff (Reference Birkhoff1933) and validated by Davis (Reference Davis1936) based on the understanding of humans’ perceptions and the feeling mechanism of beauty. It was later applied for webpages design (Ngo and Byrne, Reference Ngo and Byrne1998) and screen design (Ngo et al., Reference Ngo, Lian and Byrne2003). As it proves to be extremely efficient and valid, it has been extended to 3D objects and utilized in many areas like vehicles, engineering machines, and so on (Hsiao et al., Reference Hsiao, Chiu and Lu2010; Lo et al., Reference Lo, Ko and Hsiao2015; Deng and Wang, Reference Deng and Wang2020; Zhou et al., Reference Zhou, Ouyang, Su and Zhang2020). Mayer and Landwehr (Reference Mayer and Landwehr2018) proposed four measures to predict aesthetic preference based on the processing fluency theory and examined them through user experiments. As a crossing-field of psychology, computer science, and design methodology, aesthetic measure is recently involved with evolutionary design by prior studies (Wannarumon et al., Reference Wannarumon, Bohez and Annanon2008; Mars et al., Reference Mars, Grabska, Slusarczyk and Strug2020) and has shown the advantages.
Existing studies confirmed that the application of aesthetic measure in product form design requires customization for specific scenarios. For example, aesthetic dimensions for webpages are balance, equilibrium, symmetry, sequence, cohesion, unity, proportion, simplicity, density, regularity, economy, homogeneity, rhythm, and complexity. The users consider webpage as the integration of frame (boundary of webpage) and objects (lines, blocks, and so on). Different aesthetic formulas use alignment parameters of webpage as variables to calculate multidimensional aesthetic values (Ngo et al., Reference Ngo, Lian and Byrne2003; Wan et al., Reference Wan, Ji, Wu, Jia, Zhan, Yuan and Wang2021). Another application in all-in-one stereos design (Lo et al., Reference Lo, Ko and Hsiao2015) uses aesthetic dimensions such as balance, equilibrium, symmetry, proportion, unity, and minimalist. Only components and no boundary are considered in those aesthetic formulae.
Aesthetic measure in product form design is worthy of further researching for two main reasons. One reason is its powerfulness in accurate aesthetic evaluation, which is used to be a very vague and subjective task requiring intense manpower and time cost. Rather than interviews or questionnaires, computational formulae are used for decomposed aesthetic dimensions. Another reason is that its computational formula makes it suitable for recent evolutionary design methodologies. For example, Wannarumon et al. (Reference Wannarumon, Bohez and Annanon2008) combined aesthetic measure, human survey results, and long-lasting symbols in the fitness function of their evolutionary art form generation algorithm. Mars et al. (Reference Mars, Grabska, Slusarczyk and Strug2020) proposed a fuzzy evaluation method for architectural designs by adapting aesthetic measure and used it for the fitness function of evolutionary algorithm. Generally, the evolutionary design algorithms generate design schemes in the integrated automatic process instead of the traditional stage-by-stage process. Aesthetic measure can be useful to facilitate such design algorithms.
Currently, some challenges remain to be tackled for aesthetic measure to be more useful and suitable for real design scenarios. Firstly, the selection of aesthetic dimension is essential but still relies on subjective decision-making. According to aesthetic theory, many aesthetic dimensions contribute to the feeling of beauty but with variant stimulus strength. The balance of different dimensions is the key issue of aesthetic study. The strengths are impacted by product characteristics, backgrounds, and so on, and difficult to be predicted currently. Secondly, the aesthetic measure method lacks a proper mechanism to exploit traditional design evaluation expertise in the aesthetic quantification process. Expert-based decision-making is a more credited way than aesthetic measure. Neglecting it can cause some fundamental problems. This paper focuses on above challenges. To facilitate more reasonable aesthetic dimension selection, this paper proposes a combined aesthetic measure integrating with expert-based decision-making through heuristic particle swarm optimization (PSO) algorithm. Expert decisions are employed to lead the filtering of candidate aesthetic dimension formulas. Furthermore, aesthetic dimension formulas are introduced into evolutionary design parameter optimization to generate form design schemes. This evolutionary form design method consisting of PSO-based aesthetic dimension selection and multiple object optimization (MOO)-based design scheme generation is carried out in a bicycle form design case. To our best knowledge, no prior study has treated above challenges at the same time. The method proposes a new heuristic aesthetic dimension selection mechanism, which uses design evaluation expertise and MOO for more complex form design with more parameters than existing simple design cases. This method aims to enhance the product design quality by designer in engineering practice as well as the reliability of aesthetic evaluation results.
The rest of paper is organized as follows. The section “Related work” reviews the literatures related to aesthetic measure, PSO algorithm, and MOO studies. The section “Evolutionary form design method” illustrates the proposed evolutionary product form design method. The section “Case study” uses bicycle structure design as a case study, gives details about application process, and discusses sensitive analysis of the proposed method. The section “Conclusions” concludes this paper with advantages, weaknesses, and further expectations.
Related work
Aesthetic measure for user preference elicitation
As a crossing-field of multiple disciplines, aesthetic measure has been applied in many areas like psychology, arts, and neuroscience (Liu, Reference Liu2003; Hartmann et al., Reference Hartmann, Sutcliffe and De Angeli2008; Rigau et al., Reference Rigau, Feixas and Sbert2008; Perlovsky, Reference Perlovsky2010). Generally, a visual scene is seen as stimulus, from which scheme is progressively extracted. It is then perceived as the integration of visual components with key properties. Human eyes are sensitive to some of them, and through further mechanisms, high-level visual perceptions and sense of beauty are generated. Scientists accordingly summarize formula to directly catch the key properties of the target's visual alignment to calculate the aesthetic value. Aesthetic measure was first proposed by Birkhoff (Reference Birkhoff1933). It was further evaluated and tested effectively by Davis (Reference Davis1936). From then on, aesthetic measure has attracted research interests from many areas. Lo et al. (Reference Lo, Ko and Hsiao2015) introduced it into all-in-one stereos form design. Wu and Li (Reference Wu and Li2019) adopted aesthetic measure in interface design inspirations.
As a computational way of aesthetic product form evaluation, aesthetic measure is one of the common approaches addressing the subjectivity and uncertainty of user judgement. Pairwise form design selection is an intuitive way to derive user preference, and prior study further used an interactive genetic algorithm (GA) to learn user preference (Kelly et al., Reference Kelly, Wakefield and Papalambros2011a). Similarly, Ren and Papalambros (Reference Ren and Papalambros2012) viewed the preference elicitation in iterative query schemes as optimization problem and analyzed the query types and algorithms. Ren et al. (Reference Ren, Scott and Papalambros2014) further proposed a query algorithm to select proper query scheme. Another way of using user preference in product form is to analyze relations between coarse- and fine-grained geometric features according to users’ evoked emotions (Orbay et al., Reference Orbay, Fu and Kara2014). As aesthetic measure relies on the prior knowledge of relations between evoked aesthetic feeling and product form, it is very convenient without requiring user experiment in practice and wins in convenience.
Aesthetic dimension formulae are based on mathematic form representation and description. Geometric parameterization by experts is a widely used method (Lo, Reference Lo2018; Zhou et al., Reference Zhou, Ouyang, Su and Zhang2020). Shape grammar is another method which requires higher level of domain expertise (Orsborn et al., Reference Orsborn, Cagan, Pawlicki and Smith2006), given some prior work on automatic extraction of shape grammar (Orsborn et al., Reference Orsborn, Cagan and Boatwright2008; Orsborn and Cagan, Reference Orsborn and Cagan2009). Sketch is intuitive description of product forms, but its graph-based representation for further design exploration is still complex (Fuge et al., Reference Fuge, Yumer, Orbay and Kara2012; Orbay and Kara, Reference Orbay and Kara2012; Orbay et al., Reference Orbay, Yumer and Kara2012). Generally, geometric parameterization is more common and efficient than other methods, and thus, it is applied with aesthetic measure in this paper.
Generally, existing literatures on user preference elicitation or prediction for product form design apply computational methods including aesthetic measure to combat subjectivity and uncertainty. Requiring user experiment and domain expertise in design form representation are major disadvantages of current methods, comparative to aesthetic measure. For current literatures that apply aesthetic measure specifically, how to select proper aesthetic dimensions has not been addressed. This paper proposes to address this with evolutionary algorithm.
Feature selection
Feature selection is an important tool of data preprocessing before building models. More descriptive and valuable features are retained to clean the dataset, which ensure that more concise and comprehensive models are built. Feature selection is fundamental when dealing with high-dimensional data. However, it is also needed when features are redundant or inappropriate. For product form design, major aesthetic dimensions are a small group from all dimensions. In practice, some dimensions may have little contributions to overall aesthetic assessment, or even contradict with each other. Therefore, feature selection methods can be adopted here for aesthetic dimension selection.
Information theory-based, sparse learning-based, and statistical methods are typical methods for feature selection (Li et al., Reference Li, Cheng, Wang, Morstatter, Trevino, Tang and Liu2018). To the best knowledge of authors, existing studies related to feature selection have not been implemented for aesthetic dimension selection yet. This paper proposes to adopt a feature selection method based on the PSO method for this purpose. The PSO-based method transforms feature selection into an optimization problem by using model performances as selection fitness evaluation and solves the problem with evolutionary algorithm. This method is proven effective in many areas, such as gene selection, disease prediction, and so on (Joloudari et al., Reference Joloudari, Saadatfar, Dehzangi and Shamshirband2019; Almomani, Reference Almomani2020; Shukla et al., Reference Shukla, Tripathi, Reddy and Chandramohan2020; Song et al., Reference Song, Zhang, Guo, Sun and Wang2020). As it is easy to implement and fast to converge, it is employed in this paper for aesthetic dimension selection.
PSO algorithm is a heuristic optimization algorithm (Kennedy and Eberhart, Reference Kennedy and Eberhart1995; Shi and Eberhart, Reference Shi and Eberhart1998). Inspired by the birds, the evolutionary algorithm starts from random solutions and goes through iterations to reach final positions. Fitness evaluation is also applied in PSO but different from GAs, PSO does not include cross or mutation operations. Instead, individuals’ experiences and global performances are utilized in determining the direction of update. Typically, an individual's update is determined by inertia, its optimum position, and global optimum position, as shown in Eqs (1) and (2):
 $$v_{t + 1} = w\ast v_t + c_1\ast {\rm rand}( ) \ast ( p{\rm best}_t-x_t) + c_2\ast {\rm rand}( ) \ast ( g{\rm best}_t \\-x_t),$$
 $$x_{t + 1} = x_t + v_t,$$
where v t is the individual’ speed at tth iteration step, x t is its position, pbestt is its best position up to tth iteration, gbestt is the best position among individuals, w is the inertia weight, c 1 is the local optimum weight, c 2 is the global optimum weight, and rand() gives a random number between 0 and 1.
Genetic algorithm
GA (GA) is a noted evolutionary bionic algorithm for optimization. A population of individuals simulates the nature process of chromosome reproduction by iterative crossing, mutation, and selection. For years, various techniques have enriched GA algorithms and enabled good adaptation to different scenarios. Chromosome initialization can be randomized or in a certain pattern. Cross operation introduces new solutions from two father solutions and also promotes the spread of superior solutions. High crossing probability accelerates convergence. Mutation operation introduces new solutions by random, which ensures the ability to jump out of local optimum for global optimum solutions. Selection operation keeps those more promising chromosomes. The scalar fitness value traditionally used determines the probability of being selected into next iteration.
To solve more complex MOO problems, two types of GA variants are often relied on linear weight-based ones and pareto front-based ones. The first type methods aggregate multiple objects by weights into a single-objective optimization problem, such as random weight genetic algorithm (RWGA) and vector-evaluated genetic algorithm (VEGA). The second type aims to find pareto front solutions, such as multi-objective genetic algorithm (MOGA) and non-dominated sorting genetic algorithm (NSGA). Improved NSGA (NSGA-II) is proposed by Deb to improve the quality of pareto front (Deb et al., Reference Deb, Pratap, Agarwal and Meyarivan2002). After crossing and mutation operations, the fast non-dominance sorting and selection based on crowdedness are employed during each iteration. The selection process embodies elite strategy with a tendency to reach more dispersed pareto solutions. Compared with other MOO algorithms, NSGA-II has the advantage of strong convergence and high speed.
NSGA-II has been successfully applied in various areas. Aydin uses NSGA-II to solve the dynamic demand model for product line design for both remanufactured and new products (Aydin et al., Reference Aydin, Kwong and Ji2014, Reference Aydin, Kwong and Ji2016). Koo introduces NSGA-II into a simulation–optimization model for optimal refinery supply chain design and operation (Koo et al., Reference Koo, Adhitya, Srinivasan and Karimi2008). Kwong uses NSGA-II to solve the comprehensive optimization model to integrate affective design, engineering, and marketing for defining design specifications of new products (Kwong et al., Reference Kwong, Jiang and Luo2016). NSGA-II is also being applied in structural design optimization, thermal performance optimization areas, etc. (Cao et al., Reference Cao, Mihardjo and Parikhani2020; Wu et al., Reference Wu, Huang, Chen, Zhu and Li2022). In the product form design area, evolutionary algorithms are widely integrated in design synthesis (Eckert et al., Reference Eckert, Kelly and Stacey1999; Yang et al., Reference Yang, Zhou, Yu and Yu2019; Zeng et al., Reference Zeng, He, Tang and Wang2020). Hsiao et al. (Reference Hsiao, Chiu and Lu2010) applied GA in coffee machine form design. Kelly et al. (Reference Kelly, Maheut, Petiot and Papalambros2011b) focused on the balance between form and function performances, and employed evolutionary algorithm to generate optimal designs. Such balance was also highlighted and properly handled by evolutionary algorithms in automotive form design (Reid et al., Reference Reid, Gonzalez and Papalambros2010, Reference Reid, Frischknecht and Papalambros2012). Above studies by Hsiao et al. (Reference Hsiao, Chiu and Lu2010), Reid et al. (Reference Reid, Gonzalez and Papalambros2010, Reference Reid, Frischknecht and Papalambros2012), and Kelly et al. (Reference Kelly, Maheut, Petiot and Papalambros2011b) prove the feasibility and value of evolutionary algorithms in form design. However, the design scheme evaluation metrics they use are limited, and correlations between aesthetic dimensions have not been considered. This paper uses a specific dimension selection step to filter out unimportant or correlated aesthetic dimensions and to reduce the number of evaluation metrics. Due to the powerfulness of NSGA-II, it is adopted in this paper for form design parameter optimization.
Evolutionary form design method
The evolutionary product form design based on aesthetics consists of four sequential steps, as in following parts.
Parameterization
Product form design follows a principle from whole to part. Overall structure is firstly defined. Then, more detailed parts are being considered. In this paper, we focus on aesthetic form design that is highly valued in overall structure design. Parameterization starts with extracting the overall structure of design target. A complex structure can be viewed as a layout composed of simple objects. Then appropriate parameters are summarized to describe the major geometric characteristics of the layout and objects. These parameters should be sufficient, concise, and easy to use for design modeling. They are supposed to describe major characteristics of product form and as less as possible, for example, lengths, diameters, angles of objects, and ratios of them. Finally, bounds and constraints are defined for them. Currently, only constraints that can be described by parametric inequations are available. The design parameters are denoted as Y = (y 1, y 2…y p), bounds are denoted as D = {d 1, d 2…d p}, and constraints are denoted as F = {f k}. Equations (3) and (4) need to be satisfied:
 $$\forall f_k\in F, \;f_k( Y) < 0,$$
 $$y_j\in d_j, \;j = 1, \;2, \;\ldots p.$$
Aesthetic dimension selection based on PSO
Aesthetic dimension selection is based on aesthetic measure and expert decision-making. Several design schemes are prepared for both methods. For each selection sequence, that is, a list of selected aesthetic dimensions, aesthetic measure results of design schemes are compared with expert analysis to evaluate the rationality of that selection. The ones with optimal performance are obtained as final selection solutions. The above process is solved by the PSO algorithm, by setting selection sequences as individuals, and comparison performance as the fitness value.
Aesthetic dimension definition
A total of 11 widely used aesthetic dimensions for 3D objects are considered, that is, balance, equilibrium, symmetry, sequence, cohesion, proportion, simplicity, regularity, economy, homogeneity, and rhythm. These dimensions are proposed in early studies by Ngo and Byrne (Reference Ngo and Byrne1998) and Ngo et al. (Reference Ngo, Lian and Byrne2003) for 2D webpages. Some of them are extended in the later study by Lo et al. (Reference Lo, Ko and Hsiao2015) for 3D objects. In this paper, some dimension formulas for 3D objects are adopted, while other dimension formulas are re-defined according to original 2D definitions of those dimensions. The aesthetic dimensions involved in the proposed approach are illustrated in the following:
(1) Balance
Balance represents the even distribution of optical weight. Balance dimension value "BM" is computed by Eqs (5)–(7). Specifically, balance formulae proposed by Lo et al. (Reference Lo, Ko and Hsiao2015) are improved by using the product component with the largest area moment of inertia to define “visual boundary”. Also, the balance level of layout along z-axis BMz is defined as the ratio of overall area centroid distance to area centroid distance of the product component with the largest area moment of inertia.
 $${\rm BM} = 1-\displaystyle{{{\rm B}{\rm M}_x + {\rm B}{\rm M}_y + {\rm B}{\rm M}_z} \over 3},$$
 $${\rm B}{\rm M}_z = \displaystyle{{\left\vert {\sum\nolimits_{i = 1}^k {m_{zi}} } \right\vert } \over {\max \vert {m_{zi}} \vert }}\displaystyle{{v_m} \over V},$$
 $$m_{zi} = \int {x_i + y_i} dv,$$
where m zi is the ith object's area moment of inertia along the z-axis, V is the sum of the area of objects, v m is the area of the product component with the largest area moment of inertia.
(2) Equilibrium
Equilibrium represents the uniform distribution of elements in a target. Equilibrium dimension value "EM" is computed by Eqs (8) and (9) according to Lo et al. (Reference Lo, Ko and Hsiao2015):
 $${\rm EM} = 1-\displaystyle{{{\rm E}{\rm M}_x + {\rm E}{\rm M}_y + {\rm E}{\rm M}_z} \over 3},$$
 $${\rm E}{\rm M}_x = \displaystyle{{\sum\nolimits_i {x_{ic}-x_c} } \over d},$$
where (x c, y c, z c) is orthogonal coordinates of target centroid, (x ic, y ic, z ic) is orthogonal coordinates of ith object centroid, and d is the span of objects along the x-axis.
(3) Symmetry
Symmetry represents the similarity level of objects on two sides of an axis. Symmetry dimension value "SYM" is computed by Eqs (10)–(17) according to Lo et al. (Reference Lo, Ko and Hsiao2015). Specifically, vertical, horizontal, and radius symmetries along the orthogonal front, right, and top views are averaged. The symmetry level of front view along the vertical axis SYMFV is calculated by two comparisons: upper right (UR) to upper left (UL) and lower right (LR) to lower left (LL), in terms of orthogonal coordinates, height, width, and polar coordinates.
 $$\eqalign{& {\rm SYM} = 1-\left({\displaystyle{{\vert {{\rm SY}{\rm M}_{{\rm FV}}} \vert + \vert {{\rm SY}{\rm M}_{{\rm FH}}} \vert + \vert {{\rm SY}{\rm M}_{{\rm FR}}} \vert + \vert {{\rm SY}{\rm M}_{{\rm RV}}} \vert } \over 9}} \right. \cr & \left. { \displaystyle{{ + \vert {{\rm SY}{\rm M}_{{\rm RD}}} \vert + \vert {{\rm SY}{\rm M}_{{\rm RR}}} \vert + \vert {{\rm SY}{\rm M}_{{\rm TH}}} \vert + \vert {{\rm SY}{\rm M}_{{\rm TD}}} \vert + \vert {{\rm SY}{\rm M}_{{\rm TR}}} \vert } \over 9}} \right),} $$
 $$\eqalign{{\rm SY}{\rm M}_{{\rm FV}}& = 1-( {\vert {{{Y}^{\prime}}_{{\rm UR}}-{{Y}^{\prime}}_{{\rm UL}}} \vert + \vert {{{Y}^{\prime}}_{{\rm LR}}-{{Y}^{\prime}}_{{\rm LL}}}} \vert \cr &\quad + \vert {{{Z}^{\prime}}_{{\rm UR}}-{{Z}^{\prime}}_{{\rm UL}}} \vert + \vert {{{Z}^{\prime}}_{{\rm LR}}-{{Z}^{\prime}}_{{\rm LL}}} \vert \cr \,& + \vert {{{B}^{\prime}}_{{\rm UR}}-{{B}^{\prime}}_{{\rm UL}}} \vert + \vert {{{B}^{\prime}}_{{\rm LR}}-{{B}^{\prime}}_{{\rm LL}}} \vert {\rm} + \vert {{{H}^{\prime}}_{{\rm UR}}-{{H}^{\prime}}_{{\rm UL}}} \vert + \vert {{{H}^{\prime}}_{{\rm LR}}-{{H}^{\prime}}_{{\rm LL}}} \vert \cr & { + \vert {{{\Theta }^{\prime}}_{{\rm UR}}-{{\Theta }^{\prime}}_{{\rm UL}}} \vert + \vert {{{\Theta }^{\prime}}_{{\rm LR}}-{{\Theta }^{\prime}}_{{\rm LL}}} \vert }\cr & + \vert {{{R}^{\prime}}_{{\rm UR}}-{{R}^{\prime}}_{{\rm UL}}} \vert + \vert {{{R}^{\prime}}_{{\rm LR}}-{{R}^{\prime}}_{{\rm LL}}} \vert ) {\rm /12},} $$
 $$Y_j = \sum\limits_i^{k_j} {\vert {y_{ij}-y_c} \vert } \quad \;j = {\rm UL, \;UR, \;LL, \;LR,}$$
 $$Z_j = \sum\limits_i^{k_j} {\vert {z_{ij}-z_c} \vert } \quad \;j = {\rm UL, \;UR, \;LL, \;LR},$$
 $$H_j = \sum\limits_i^{k_j} {h_{ij}} \quad \;j = {\rm UL, \;UR, \;LL, \;LR,}$$
 $$B_j = \sum\limits_i^{k_j} {b_{ij}} \quad \;j = {\rm UL, \;UR, \;LL, \;LR,}$$
 $$\Theta _j = \sum\limits_i^{k_j} {\left\vert {\displaystyle{{z_{ij}-z_c} \over {y_{ij}-y_c}}} \right\vert } \quad \;j = {\rm UL, \;UR, \;LL, \;LR,}$$
 $$R_j = \sum\limits_i^{k_j} {\sqrt {{( z_{ij}-z_c) }^2 + {( y_{ij}-y_c) }^2} } \quad \;j = {\rm UL, \;UR, \;LL, \;LR,}$$
where y ij and z ij are the orthogonal coordinates of ith product component in jth part, h ij and b ij are the height and width of ith product component in jth part, y c and z c are the orthogonal coordinates of target centroid, Y j, Z j, H j, B j, Θj, and R j are processed by max-min normalization into range [0, 1], then they are denoted as  ${Y}^{\prime}_j$,
 ${Z}^{\prime}_j$,
 ${H}^{\prime}_j$,
 ${B}^{\prime}_j$,
 ${\Theta }^{\prime}_j$, and
 ${R}^{\prime}_j$.
(4) Sequence
Sequence represents the alignment that accords with human's habit of eye movement trained by reading. Preferred sequence of human eyes is considered upper left, upper right, lower left, and lower right, which is found and exploited in early studies of screen design (Streveler and Wasserman, Reference Streveler and Wasserman1984; Galitz, Reference Galitz1994). The amount of content is preferred to decrease along the sequence. Sequence dimension value "SQN" is computed by Eqs (18)–(21) extending the formula by Ngo et al. (Reference Ngo, Lian and Byrne2003). Sequence dimension value along x-axis SQNx measures the similarity of content alignment to the preferred sequence.
 $${\rm SQN} = 1-\displaystyle{{{\rm SQ}{\rm N}_x + {\rm SQ}{\rm N}_y + {\rm SQ}{\rm N}_y} \over 3},$$
 $${\rm SQ}{\rm N}_x = 1-\displaystyle{{\vert {4-v_{x{\rm UL}}} \vert + \vert {3-v_{x{\rm UR}}} \vert + \vert {2-v_{x{\rm LL}}} \vert + \vert {1-v_{x{\rm LR}}} \vert } \over 8},$$
 $$v_{xj} = \left\{{\matrix{ {\matrix{ 4 & {{\rm if}\,w_{xj}\,{\rm is}\,{\rm the}\,{\rm biggest}\,{\rm in}\,W_x} \cr } } \hfill \cr {\matrix{ 3 & {{\rm if}\,w_{xj}\,{\rm is}\,{\rm the}\,{\rm 2rd}\,{\rm biggest}\,{\rm in}\,W_x} \cr } } \hfill \cr {\matrix{ 2 & {{\rm if}\,w_{xj}\,{\rm is}\,{\rm the}\,{\rm 3rd}\,{\rm biggest}\,{\rm in}\,W_x} \cr } } \hfill \cr {\matrix{ 1 & {{\rm if}\,w_{xj}\,{\rm is}\,{\rm the}\,{\rm smallest}\,{\rm in}\,W_x} \cr } } \hfill \cr } } \right.\quad \;j = {\rm UL, \;UR, \;LL, \;LR},$$
 $$W_x = { {w_{xj}} } = \left\{{q_j\sum\limits_i^{kj} {a_{xij}} } \right\} \quad \;j = {\rm UL, \;UR, \;LL, \;LR,}$$
where q j is a weight of quadrant to control the significance of sequence and usually its value is set as 1, and a xij is the area of ith product component in the jth part along the x-axis.
(5) Cohesion
Cohesion represents the consistency of aspect ratios of the target. The more consistent they are, the more aesthetic contributed (Lo, Reference Lo2018). Cohesion dimension value "COH" is computed by Eqs (22)–(25) extending the formula by Ngo et al. (Reference Ngo, Lian and Byrne2003).
 $${\rm COH} = 1-\displaystyle{{{\rm CO}{\rm H}_x + {\rm CO}{\rm H}_y + {\rm CO}{\rm H}_z} \over 3},$$
 $${\rm CO}{\rm H}_x = \displaystyle{{\sum\nolimits_{i = 1}^k {t_{xi}} } \over k},$$
 $$t_{xi} = \left\{{\matrix{ {\matrix{ {c_{xi}} & {{\rm if\ }c_{xi}} \cr } \le 1} \hfill \cr {\matrix{ {\displaystyle{1 \over {c_{xi}}}} & {{\rm otherwise}} \cr } } \hfill \cr } } \right., $$
 $$c_{xi} = \displaystyle{{h_{xi}/b_{xi}} \over {h_{x{\rm layout}}/b_{x{\rm layout}}}},$$
where h xi is the height of ith object, b xi is the width of ith object, h xlayout is the height span of the target, b xlayout is the width span of the target of the layout along the x-axis, and k is the total number of objects.
(6) Proportion
Proportional aesthetic represents the similarity of target proportions to typical preferred proportions. Some preferred proportions have been discovered by scientists to be aesthetically pleasing and are validated to be universal through a long period (Grigoryan and Agaian, Reference Grigoryan and Agaian2020; De Bartolo et al., Reference De Bartolo, De Luca, Antonucci, Schuster, Morone, Paolucci and Iosa2021). Among those proportions are {1:1, 1:1.414, 1:1.618, 1:1.732, 1:2}. Proportion dimension value "PM" is computed by Eqs (26)–(29), which are simplified expressions according to Ngo et al. (Reference Ngo, Lian and Byrne2003).
 $${\rm PM} = \displaystyle{{{\rm P}{\rm M}_{\rm O} + {\rm P}{\rm M}_{\rm E}} \over 2},$$
 $${\rm P}{\rm M}_{\rm O} = 1-\displaystyle{{\sum\nolimits_{\,j = 1}^3 {\mathop {\min }\limits_{x\in X} \vert {\,p_{oj}-x} \vert } } \over 3},$$
 $${\rm P}{\rm M}_{\rm E} = 1-\displaystyle{{\sum\nolimits_{\,j = 1}^3 {\sum\nolimits_{i = 1}^k {\mathop {\min }\limits_{x\in X} \vert {\,p_{eij}-x} \vert } } } \over {3k}},$$
 $$X{\rm} = \{ { \ 1, \;1}{\rm.414, \;1}{\rm.618, \;1}{\rm.732, \;2} \},$$
where p oj is the overall aspect ratio along the jth orthogonal axis, p eij is the aspect ratio of ith element along the jth orthogonal axis, and X is a set of preferred proportions.
(7) Simplicity
Simplicity represents the aesthetic feeling of people stimulated by compact and simple scenes (Moshagen and Thielsch, Reference Moshagen and Thielsch2010), which is often referred to as “less the better”. For 3D objects, the number of elements with different geometric poses significantly affects the sense of simplicity, as those elements with the same or similar poses are easily classified as one type, or even grouped together by human eyes. The geometric pose of 3D object is the 3D orientation it exhibits with respect to the ground. Two elements have different geometric poses if the difference between any pair of 3D orientation parameters exceeds the minimum threshold. Minimum thresholds are predefined by experts in the light of geometric features of target. Simplicity dimension value "SMM" is computed by Eq. (30) revising the formulae by Ngo et al. (Reference Ngo, Lian and Byrne2003).
 $${\rm SMM} = \displaystyle{1 \over {n_{{\rm pose}}}},$$
where n pose is the number of elements with different poses.
(8) egularity
Regularity represents the level of conformity under certain rules. For 3D object, geometric rules are considered. Regularity dimension value "RM" is determined by the number of product components being non-parallel or distinct, that is, have different spatial orientations or shapes, as shown in Eqs (31)–(33).
 $${\rm RM} = \displaystyle{{{\rm R}{\rm M}_{\rm P} + {\rm R}{\rm M}_{\rm E}} \over 2},$$
 $${\rm R}{\rm M}_{\rm P} = 1-\displaystyle{{k_p-1} \over k},$$
 $${\rm R}{\rm M}_{\rm E} = 1-\displaystyle{{k_e-1} \over k},$$
where k p is the number of product components that are non-parallel to each other, k e is the number of product components that are distinct from each other, and k is the total number of product components.
(9) Economy
Economy represents the amount of resources or cost to realize functions and convey messages to users by the product. As an aesthetic dimension, economy is very customized according to product characteristics and design requirements. For 3D form design solution that consists of solid elements, or referred to as design scheme, this paper calculates the economy dimension value ECO by the volume of design scheme. Economy dimension formula, as shown in Eq. (34), is derived from Ngo et al. (Reference Ngo, Lian and Byrne2003).
 $${\rm ECO} = 1-\displaystyle{{V_d} \over {V_{\max }}},$$
where V d is the volume of geometric parameterized design scheme, and V max is the largest volume for possible design schemes. V max is often calculated as the volume of a cube bounded by the value range of design parameters along x axis, y axis, and z axis.
(10) Homogeneity
Homogeneity represents the even distribution of objects in the target. For the 3D target, eight geometric partitions are used, namely, front upper left, front upper right, front lower left, front lower right, back upper left, back upper right, back lower left, and back lower right. The homogeneity dimension value "HM" is computed by the number of objects in eight partitions, as in Eqs (35)–(37), extending the formula proposed by Ngo et al. (Reference Ngo, Lian and Byrne2003).
 $${\rm HM} = \displaystyle{W \over {W_{\max }}},$$
 $$W = \displaystyle{{k!} \over {\Pi _jk_j!}}, \;\;j = {\rm FUL, \;FUR, \;FLL, \;FLR, \;BUL, \;BUR, \;BLL, \;BLR},$$
 $$W_{\max } = \displaystyle{{k!} \over {{\left({\displaystyle{k \over 8}!} \right)}^8}},$$
where k is the total number of objects and k j is the number of objects with gravity center within jth partition.
(11) Rhythm
Rhythm represents that elements change in a regular pattern, with the order of variation to excite people. Rhythm dimension value "RHM" is computed as the average of rhythm levels of front, right, and top views, as shown in Eq. (38), extending the formula discussed in Ngo et al. (Reference Ngo, Lian and Byrne2003) to 3D objects. The rhythm level of front view RHMF is calculated by Eqs (39)–(43):
 $${\rm RHM} = 1-\displaystyle{{{\rm RH}{\rm M}_{\rm F} + {\rm RH}{\rm M}_{\rm R} + {\rm RH}{\rm M}_{\rm T}} \over 3},$$
 $${\rm RH}{\rm M}_{\rm F} = 1-\displaystyle{{\vert {{\rm RH}{\rm M}_y} \vert + \vert {{\rm RH}{\rm M}_z} \vert + \vert {{\rm RH}{\rm M}_{{\rm Farea}}} \vert } \over 3},$$
 $$\eqalign{{\rm RH}{\rm M}_y& = ( \vert {{{Y}^{\prime}}_{{\rm UL}}-{{Y}^{\prime}}_{{\rm UR}}} \vert + \vert {{{Y}^{\prime}}_{{\rm UL}}-{{Y}^{\prime}}_{{\rm LR}}} \vert + \vert {{{Y}^{\prime}}_{{\rm UL}}-{{Y}^{\prime}}_{{\rm LL}}} \vert \cr & \quad + \vert {{{Y}^{\prime}}_{{\rm UR}}-{{Y}^{\prime}}_{{\rm LR}}} \vert + \vert {{{Y}^{\prime}}_{{\rm UR}}-{{Y}^{\prime}}_{{\rm LL}}} \vert + \vert {{{Y}^{\prime}}_{{\rm LR}}-{{Y}^{\prime}}_{{\rm LL}}} \vert ) /6}, $$
 $$\eqalign{{\rm RH}{\rm M}_z& = ( \vert {{{Z}^{\prime}}_{{\rm UL}}-{{Z}^{\prime}}_{{\rm UR}}} \vert + \vert {{{Z}^{\prime}}_{{\rm UL}}-{{Z}^{\prime}}_{{\rm LR}}} \vert + \vert {{{Z}^{\prime}}_{{\rm UL}}-{{Z}^{\prime}}_{{\rm LL}}} \vert \cr & \quad + \vert {{{Z}^{\prime}}_{{\rm UR}}-{{Z}^{\prime}}_{{\rm LR}}} \vert + \vert {{{Z}^{\prime}}_{{\rm UR}}-{{Z}^{\prime}}_{{\rm LL}}} \vert + \vert {{{Z}^{\prime}}_{{\rm LR}}-{{Z}^{\prime}}_{{\rm LL}}} \vert ) /6}, $$
 $$\eqalign{& {\rm RH}{\rm M}_{{\rm Farea}}= ( \vert {{{A}^{\prime}}_{{\rm FUL}}-{{A}^{\prime}}_{{\rm FUR}}} \vert + \vert {{{A}^{\prime}}_{{\rm FUL}}-{{A}^{\prime}}_{{\rm FLR}}} \vert + \vert {{{A}^{\prime}}_{{\rm FUL}}-{{A}^{\prime}}_{{\rm FLL}}} \vert \cr & \quad + \vert {{{A}^{\prime}}_{{\rm FUR}}-{{A}^{\prime}}_{{\rm FLR}}} \vert + \vert {{{A}^{\prime}}_{{\rm FUR}}-{{A}^{\prime}}_{{\rm FLL}}} \vert + \vert {{{A}^{\prime}}_{{\rm FLR}}-{{A}^{\prime}}_{{\rm FLL}}} \vert ) /6}, $$
 $$A_{{\rm F}j} = \sum\limits_{i = 1}^{k_{{\rm F}j}} {a_{{\rm F}ij}, \;\;j = {\rm UL, \;UR, \;LL, \;LR}}, $$
where  ${Y}^{\prime}_j$ and
 ${Z}^{\prime}_j$ (j = UL, UR, LL, LR) are calculated by Eqs (12) and (13) then max–min normalized into range [0, 1], a Fij is the area of ith product component in jth partition of the front view, k Fj is the number of objects in jth partition of the front view, and A Fj is normalized into range [0, 1] then it is denoted as
 ${A}^{\prime}_{{\rm F}j}$.
In practical use, some of above aesthetic dimension formulas need customization. For example, preferred proportions should include those that people are sensitive to according to the type of target. Prior research on screen design (Ngo et al., Reference Ngo, Lian and Byrne2003; Wan et al., Reference Wan, Ji, Wu, Jia, Zhan, Yuan and Wang2021) mostly includes the ones in Eq. (29), while research on aesthetic plastic surgery (Bashour, Reference Bashour2006) highlights golden ratio (1:1.618) and rarely considers the others. Another example is the selection of proper views for 3D object. Aesthetic formulae for balance, equilibrium, symmetry, sequence, cohesion, proportion, and rhythm are based on the orthogonal coordinate system. They compute aesthetic values for orthogonal 2D views by primitive formulae, then take the average as the final aesthetic value for 3D object. Therefore, orientations of orthogonal coordinate systems are essential. They should be decided via expertise to reflect geometric features of 3D forms as well as possible, such as setting z-axis as normal to the profile view for bicycle form design, setting z-axis (vertical axis) along the revolution axis for stereo form design (Lo et al., Reference Lo, Ko and Hsiao2015). For complex cases like surface modeling, more than three views can be aesthetically computed individually, then averaged to be the final aesthetic value.
Above 11 aesthetic dimensions are correlated to some extent. For example, balance and equilibrium both involve locations of elements within an object. Compared with visual balance given the varied weights of elements, the latter only considers the spatial distribution of elements and thus only uses spatial coordinates. Both cohesion and proportion involve aspect ratios of design scheme and elements. The former is to reflect the consistency among elements’ aspect ratios, while the latter is to reflect whether aspect ratios are in conformity with preferred proportions. For further research, such correlations should be considered by experts when specifying the weights of selected dimensions.
Aesthetic measure results of design schemes
Existing form design solutions are defined by the same parameterization as design schemes. The defined design schemes are denoted as {Schemej}, j = 1, 2, …n. Selected aesthetic dimensions are arranged in selection sequence and denoted as {s i}. Aesthetic dimensional values are calculated by aesthetic measure formula and denoted as V = (v ij)m×n, where v ij is the value of ith aesthetic dimension of jth design scheme, m is the number of selected dimensions, and n is the number of design schemes. Aesthetic values of design schemes are the aggregate of considered dimensions, as shown in Eq. (44):
 $$A = ( a_j) _n, \;a_j = \displaystyle{{\sum\nolimits_i {v_{ij}} } \over m}.$$
The rank of design schemes by aesthetic measure is determined by Eq. (45):
 $$R = ( r_j) _n, \;r_j = \vert \{{ a_t\vert t\ne j, \;a_t > a_j} \} \vert + 1.$$
Expert decision-making
The rank of design schemes is also given by experts to compare the performance of selection sequence. As multiple aesthetic dimension scoring is difficult and subjective, overall aesthetic assessment by experts is used. Involving more experts is beneficial for increasing credibility. Pairwise comparison matrix is adopted here to lower subjectivity and verify their results.
Each expert gives a pairwise comparison matrix  $E^t = ( e_{ij}^t )$, where
 $e_{ij}^t$ is the superiority of the ith design scheme to the jth design scheme given by the t-th expert. Consistency check is conducted for each pairwise comparison matrix, as shown in Eqs (46) and (47). Consistency is approved if CR < 0.1. Aggregated expert decision-making is given by Eq. (46):
 $${\rm CI} = \displaystyle{{\lambda _{\max }-n} \over {n-1}},$$
 $${\rm CR} = \displaystyle{{{\rm CI}} \over {{\rm RI}}},$$
where λ max is the maximum eigenvalue of pairwise comparison matrix, n is the matrix dimensionality that is the same as the number of design schemes, and RI is the average random consistency indicator according to the value of n.
 $$E = ( e_{ij}) _{n \times n}, \;e_{ij} = \displaystyle{{\sum\nolimits_t {e_{ij}^t } } \over s},$$
where s is the number of experts.
The rank of design schemes by expert decision-making is determined by Eq. (49):
 $${R}^{\prime} = ( {r}^{\prime}_j) _n, \;{r}^{\prime}_j = \vert \{{ e_{ij}\vert e_{ij} > 1} \} \vert + 1,$$
Comparison of aesthetic measure and expert decision-making
The principle of aesthetic dimension selection is that the rank of design schemes by aesthetic measure should be the same as rank by expert decision-making. By this way, aesthetic measure techniques are directed by experts to catch the major characteristics of aesthetic design.
Differences in both strategies are calculated in Eqs (50) and (51):
 $${\rm Diff} = \displaystyle{{\sum\nolimits_j {\vert {{{r}^{\prime}}_j-r_j} \vert } } \over N},$$
 $$N = 2\sum\limits_{i = 1}^{2i \le n} {( n-2i + 1) }, $$
where n is the number of design schemes, and Diff represents the difference level between both strategies between 0 and 1. The closer to 0 means more alike both ranks are and better the selection sequence is.
Aesthetic dimension selection by the PSO algorithm
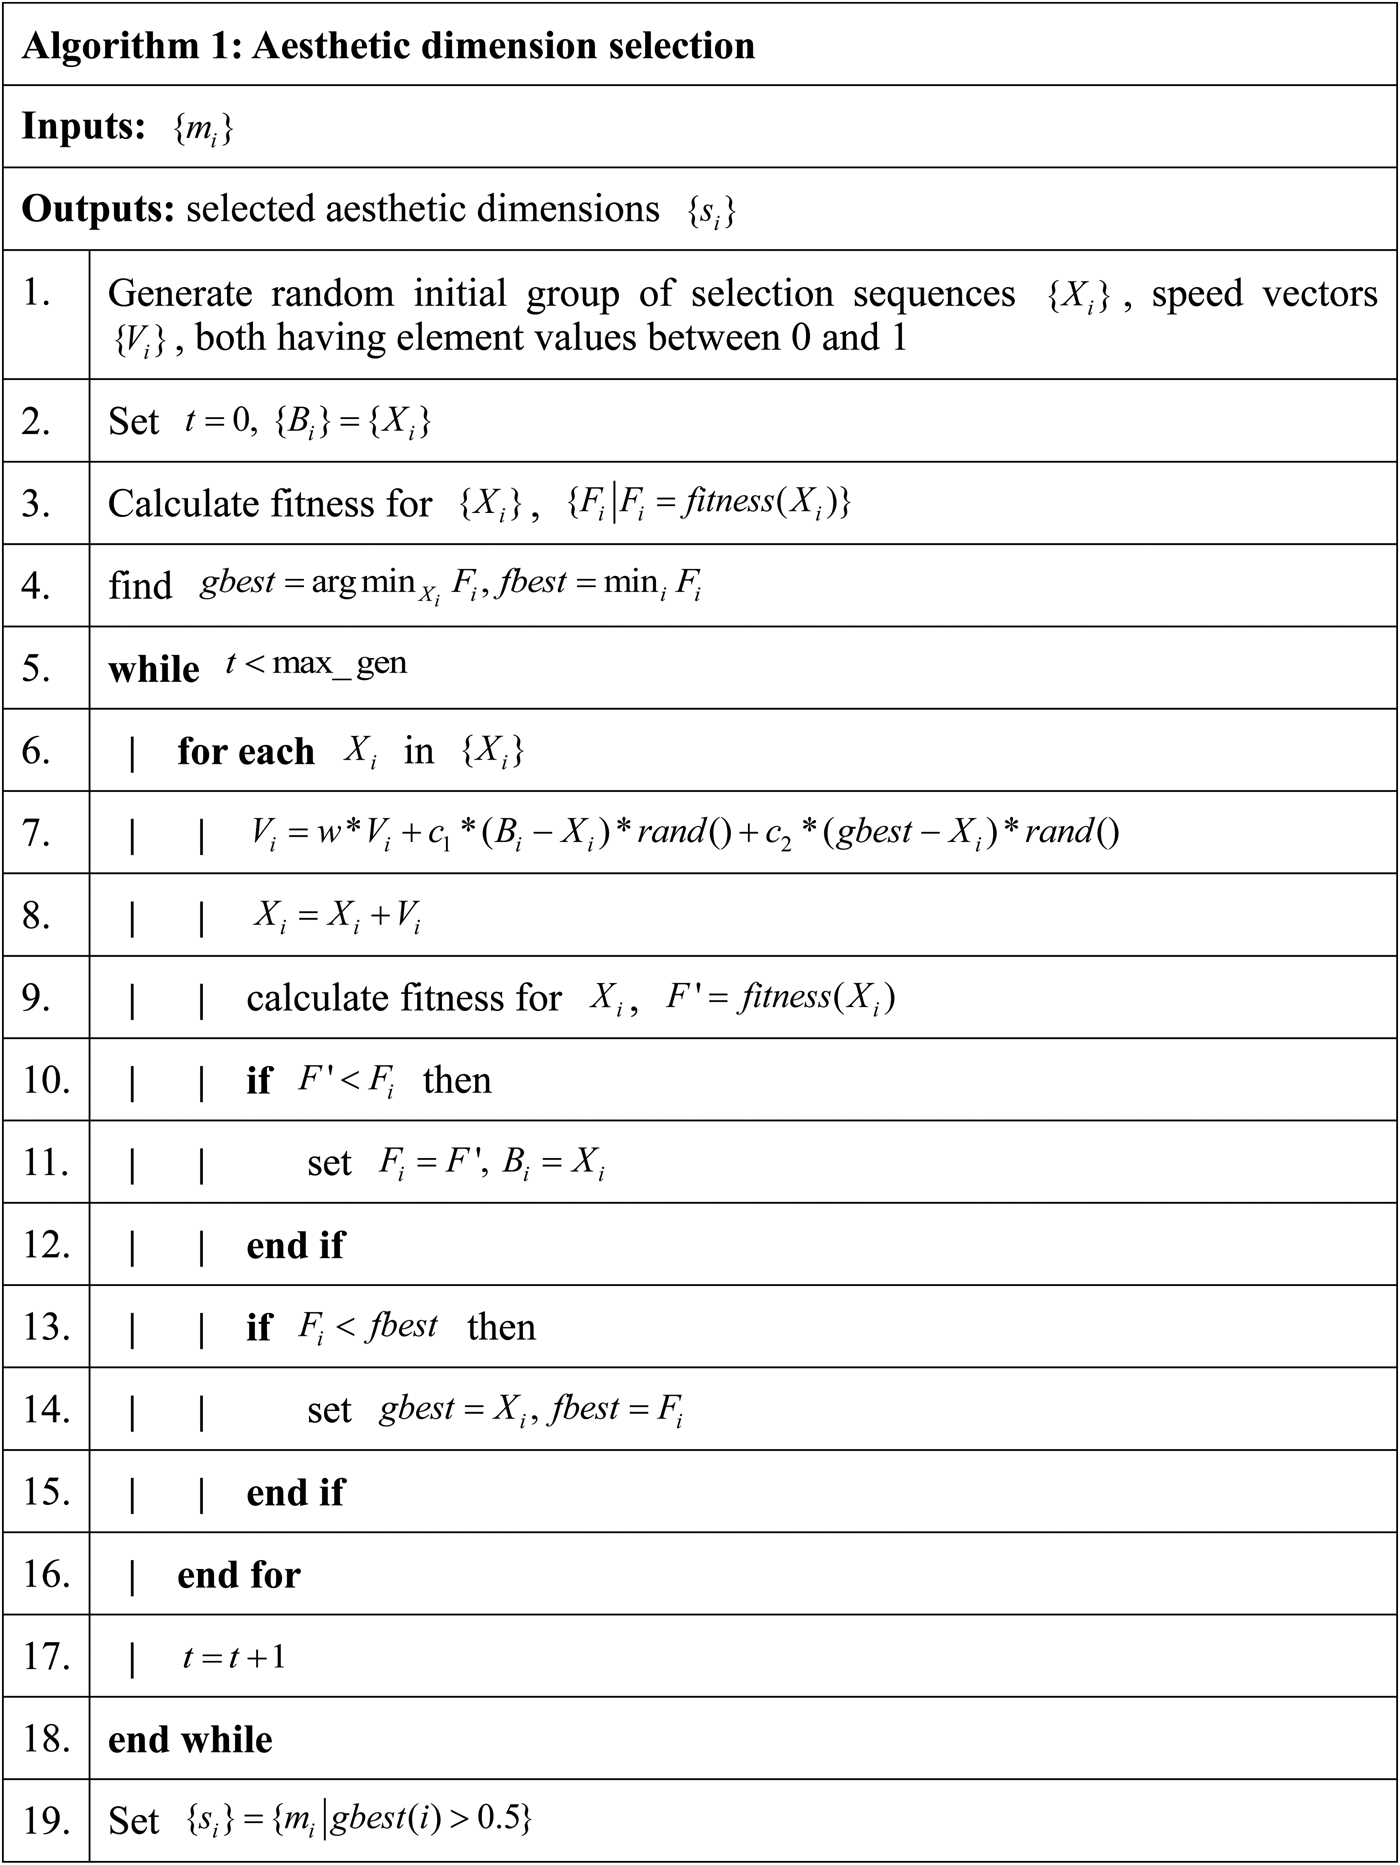
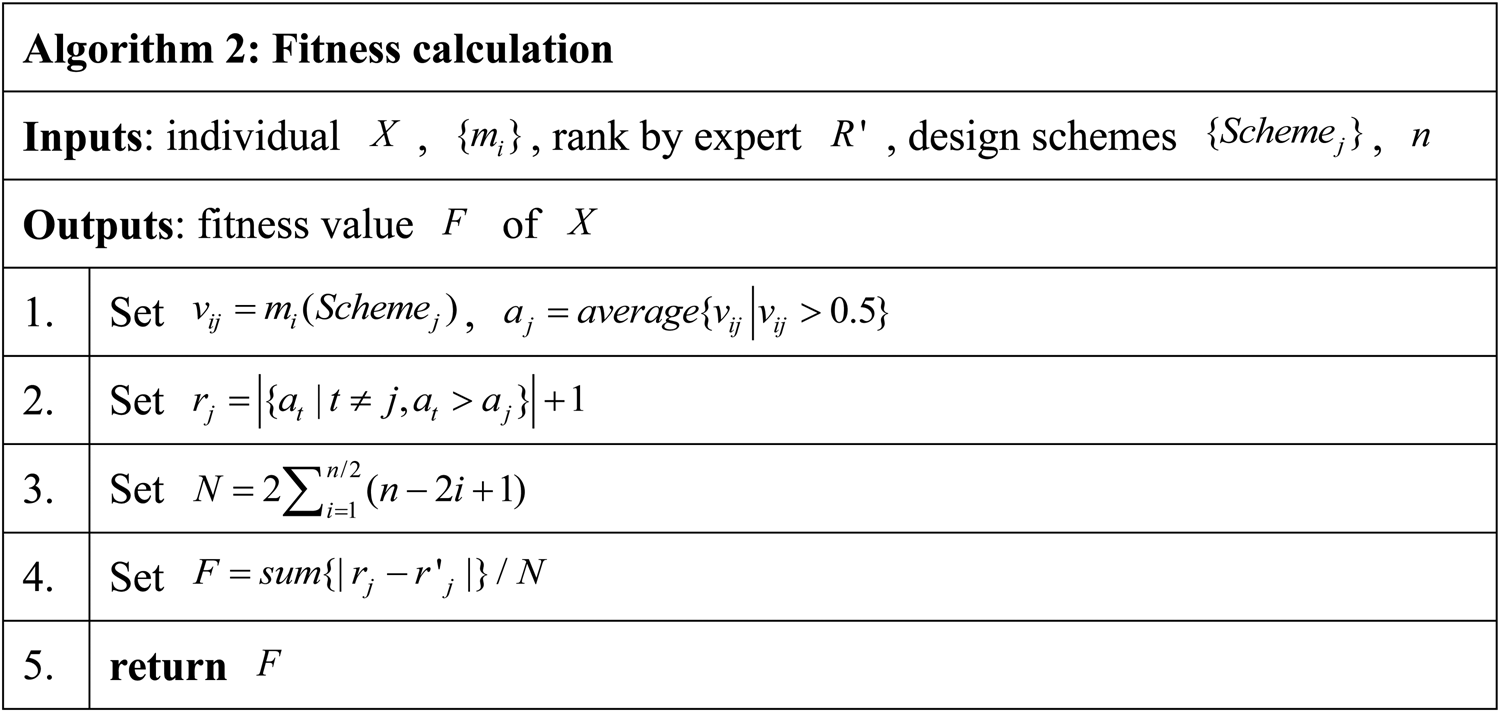
Selected aesthetic dimensions arranged in the selection sequence is represented by an individual X = (x 1, x 2, …, x m), where x i is between 0 and 1. The ith aesthetic dimension is included in that sequence if x i > 0.5, while not included otherwise. Candidate aesthetic dimensions are denoted as {m i}. The maximum number of iterations are denoted as maxgen. The PSO algorithm to find the best selection sequences is shown in Algorithm 1 (Fig. 1). Fitness calculation of individual X is shown in Algorithm 2 (Fig. 2).
Aesthetic dimension selection algorithm based on PSO.

Fitness calculation for the individual of aesthetic dimension selection sequence.

Optimization based on NSGA-II
Product form design is conducted by optimizing design parameters with respect to selected aesthetic dimensions. With the design parameters defined in parameterization and aesthetic dimensions selected as S = {s i}, the optimization problem is formulated as in Eq. (52).
 $$\eqalign{& \max s_i( Y) , \;s_i\in S \cr & {\rm s.t.} \left\{{\matrix{ {\forall f_k\in F, \;f_k( Y) < 0} \cr {y_j\in d_j, \;j = 1, \;2, \;\ldots p} \cr } } \right.}. $$
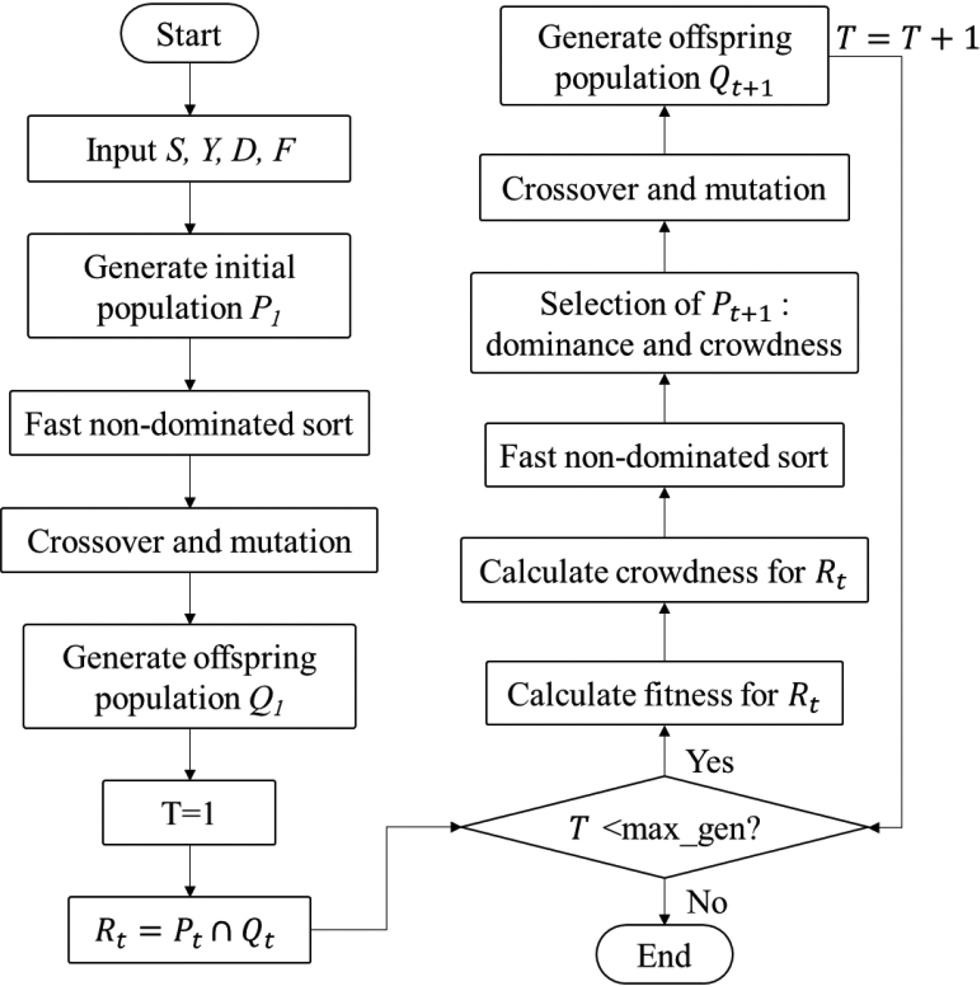
Above is a complex MOO problem with numerous variables and constraints. To solve this, NSGA-II is applied with restrictive cross and mutation operations. The workflow of NSGA-II is shown in Figure 3. Design parameters Y = (y 1, y 2, …, y p) are represented by chromosomes with continuous values. The size of population is defined as Z. Multi-dimensional fitness of chromosome is defined as aesthetic dimension values. During t-th iteration, parent population P t goes through crossover and mutation operations to generate an offspring population Q t. Then Q t and P t are merged as R t, which further goes through a fast non-dominated sorting and selection process to produce a new generation P t+1. After the maximum number of iterations, pareto solutions of final population are obtained as output of the algorithm.
NSGA-II algorithm workflow.

Cross operation
Cross operation produces new chromosomes from two existing ones. As shown in Eq. (53), parameters at each position of chromosomes are weighted summed.
 $$\left\{{\matrix{ {{\rm chil}{\rm d}_1 = a\ast {\rm paren}{\rm t}_1 + ( 1-a) \ast {\rm paren}{\rm t}_2} \cr {{\rm chil}{\rm d}_2 = a\ast {\rm paren}{\rm t}_2 + ( 1-a) \ast {\rm paren}{\rm t}_1} \cr } } \right.,$$
where a is a random weight, parent1 and parent2 are father chromosomes, and child1 and child2 are child chromosomes. Constraints in Eq. (52) are checked after crossing. If any constraint is not satisfied for two children, a is again randomly generated until all constraints are satisfied.
Mutation operation
Mutation creates new chromosomes. For a chromosome to be mutated, each parameter y j has a probability b to be redefined by Eqs (54) and (55).
 $$y_j = \bar{d}_j^{\rm L} + {\rm rand}( ) \ast ( \bar{d}_j^{\rm U} -\bar{d}_j^{\rm L} ), $$
 $$\bar{d}_j = d_j\cap { y\vert \forall f_k\in F, \;f_k( y_1, \;\ldots,\, y_{\,j-1}, \;y, \;y_{\,j + 1},\ldots, y_p) < 0}, $$
where  $\bar{d}_j^{\rm U}$ is the upper bound of
 $\bar{d}_j$,
 $\bar{d}_j^{\rm L}$ is the lower bound of
 $\bar{d}_j$, and rand() gives a random value between 0 and 1. Constraints in Eq. (52) are also checked after mutation, because
 $\bar{d}_j$ can be non-convex and leads to y j out of the feasible set. If so, mutation is conducted again with another random value until all constraints are satisfied.
Fast non-dominated sort
The dominance of a chromosome is defined as the number of its dominated ones. If a chromosome outperforms another by all factors, it dominates the latter one. After fitness evaluation, the merged population R t are ranked into different levels R t,h, h = 1, 2, …, k by dominance.
Selection based on dominance and crowdedness
The selection process starts from top dominance levels. Initially, |P t+1| = 0. If hth level chromosomes can be accommodated, they are selected into P t+1 as in Eq. (56). Otherwise, R t,h is sorted by crowdedness in descend. Crowdedness is computed as in Eq. (57). After that, top ones in R t,h are selected into P t+1, as in Eq. (58).
 $$P_{t + 1} = P_{t + 1}\cup R_{t, h}, \;\quad {\rm if} \vert P_{t + 1}\vert + \vert R_{t, h}\vert < Z,$$
 $$\eqalign{& {\rm Cr}( Y_q) = \left\{{\matrix{ {\matrix{ {\sum\limits_i {\displaystyle{{s_i( Y_2) -s_i( Y_1) } \over {s_i( Y_{2Z}) -s_i( Y_1) }}} } \hfill & {{\rm if}\,q = 1} \hfill \cr {\sum\limits_i {\displaystyle{{s_i( Y_{2Z}) -s_i( Y_{2Z-1}) } \over {s_i( Y_{2Z}) -s_i( Y_1) }}} } \hfill & {{\rm if}\,q = 2Z} \hfill \cr {\sum\limits_i {\displaystyle{{s_i( Y_{q + 1}) -s_i( Y_{q-1}) } \over {s_i( Y_{2Z}) -s_i( Y_1) }}} } \hfill & {{\rm otherwise}} \hfill \cr } } \cr } } \right. \cr & s_i( Y_1) < \cdots s_i( Y_{q-1}) < s_i( Y_q) < s_i( Y_{q + 1}) \cdots < s_i( Y_{2Z}) }, $$
 $$P_{t + 1} = P_{t + 1}\cup R_{t, h}[ 1, \;2, \;\cdots , \;Z-\vert P_{t + 1}\vert ], $$
where Y q+1 and Y q−1 are the neighbors of Y q by ith aesthetic dimension, R t,h is the merged population ranked into levels, and R t,h[1, 2, ⋅ ⋅ ⋅ , Z − |P t+1|] are the top Z − |P t+1| chromosomes in R t,h.
Design validation
Optimized design parameters are validated by designers via modeling. For a certain product form, an exemplar model is built with key parameters accordant with those defined in the section “Parameterization”. The optimized design scheme can be obtained rapidly by loading those parameter values into the exemplar CAD model. The exemplar model focuses on visualizing optimized design to designers. Therefore, unnecessary details are left, and distractive information are avoided. As shown in Figure 5, modeled parts are concise to display major characteristics of form design schemes. Designers visualize and compare the pareto solutions, then select preferable ones for further improvements. Rapid generation of numerous design schemes may also stimulate innovative plans.
Case study
Bicycle form design using our proposed evolutionary product form design method is the case study in this section. The effectiveness of this method is analyzed through comparative experiments. Strengths and comparisons with other methods are discussed later on.
Bicycle form design
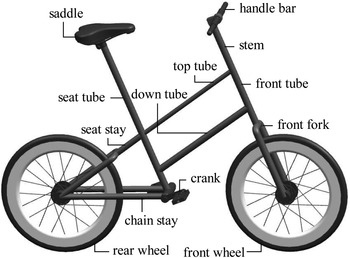
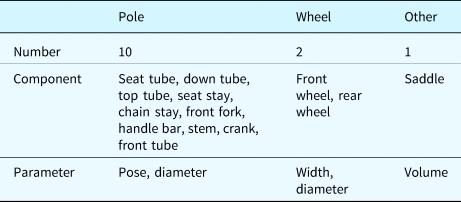
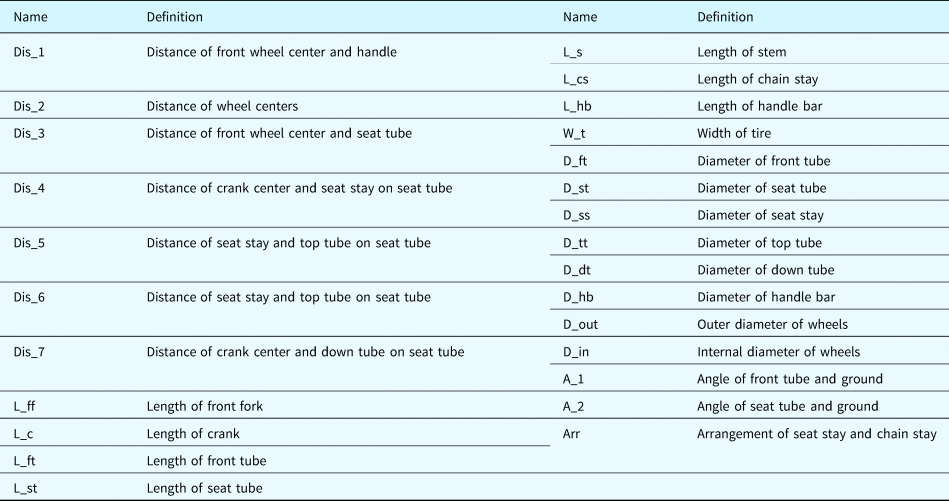
Bicycle form is a typical case where aesthetics plays an important role. Fashionable styling now has become a key factor to ensure a bicycle prototype's success in the market. Although bicycle forms typically have common structure, consisting of two identical wheels, bars, saddle, chains, and so on, which ensure the basic functions with high dynamic efficiency. However, more details like the arrangement of tubes are not defined. The variance of structures can largely influence users’ sense of beauty and impact users’ satisfaction level. Therefore, bicycle form design is used as case study in this paper. The common structure is decomposed into major components to draw appropriate parameters, as shown in Table 1. Pole type of components that comprise the frame of bicycle is simplified as columns, and the wheel type of components is simplified as rings. Graphical illustration of components is shown in Figure 4. A total of 26 geometric parameters that capture major characteristics of bicycle form are summarized, as listed in Table 2. Bounds for the parameters are defined by their feasible ranges. Constraints include that components should not interfere with each other, the position of saddle must be set between two wheel-centers, paddle trace within the scope of saddle and ground. The last two constraints guarantee mechanical security and ergonomic feasibility.
Graphical illustration of components of bicycle form for parameterization.

Decomposition of bicycle form for parameterization

Geometric parameters of bicycle form summarized

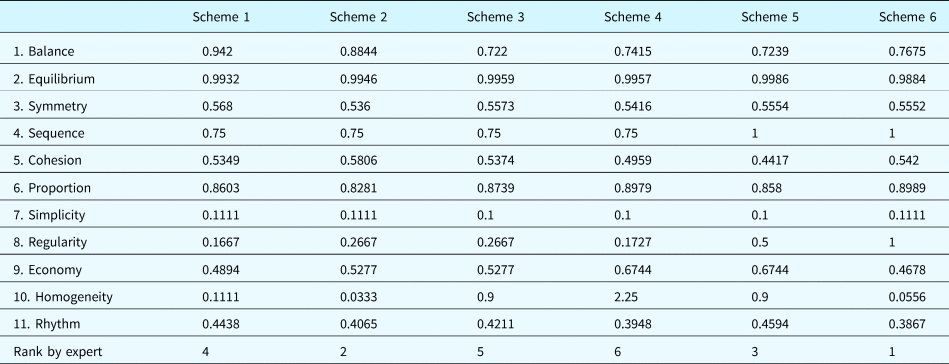
There are six bicycle design schemes prepared for expert decision-making in aesthetic dimension selection. Candidate aesthetic dimensions include the 11 aesthetic dimensions introduced in the section “Aesthetic dimension definition”. Evaluated values for aesthetic measure using the formula in the section “Aesthetic dimension definition” are given in Table 3. For expert decision-making, 12 doctorial students who major in industrial engineering are recruited to give pairwise comparison for six bicycles. They have solid knowledge of design theories and experiences of product ideation projects, and are not informed of the research content of this research paper. Their experiences in product design area are ensured. Involving 12 experts are sufficient to ensure credibility while limiting the manpower cost. During the decision-making process, each expert is first given instruction on defining a positive reciprocal matrix as the pairwise comparison matrix. After that, each expert views the bicycle pictures displayed on PC screen in random sequence and finally reports their confirmed pairwise comparison matrixes E t in standard form. Rank by expert through Eqs (48) and (49) is obtained as in the final row in Table 3.
Evaluation of design schemes by aesthetic measure and by expert

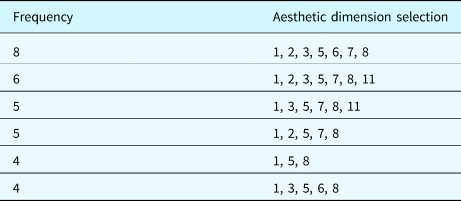
After expert decision-making, PSO algorithm is applied. A total of 50 trials are run with parameters in Table 4. Experiment is implemented on a PC with Inter Core i7-7700k 4.2 GHz and 16 GB RAM. Among the 50 selection sequences obtained, several selections can offer the same design scheme rank as the rank by expert. These are considered as optimal selections. Among them, those that occur more than four times are listed in Table 5. Frequency denotes the occurrence times of the selection in 50 trials. Listed numbers in a selection denote the indexes of aesthetic dimensions according to Table 3. In Table 5, the selection [1,5,8] contains the least number of aesthetic dimensions. It can be concluded that this selection contains the most representative aesthetic information to accord with the expert decision-making results. At the same time, the least number of dimensions lowers the complexity of the design optimization process later on with NSGA-II. Therefore, this selection is determined as the aesthetic dimensions: balance, cohesion, and regularity.
PSO algorithm parameters

Optimal selections of highest frequencies of 50 trials by the PSO algorithm

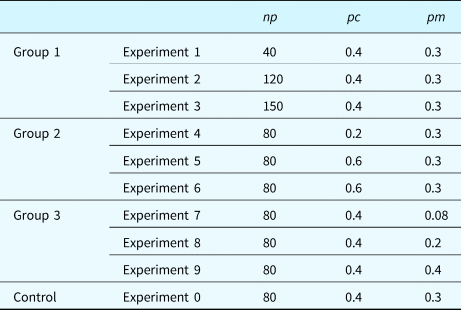
Based on selected aesthetic dimensions, NSGA-II is run for bicycle form design optimization. The parameters are shown in Table 6. np denotes the size of population, pc denotes the probability of cross operation, pm denotes the probability of mutation operation at each iteration, and max_iter denotes the maximum number of iterations. These values are defined by finetuning. A total of 20 trials are run, and after each trial, the pareto solutions in the last generation are obtained as the output of the algorithm. On average, 69.25 pareto solutions are obtained.
NSGA-II algorithm parameters

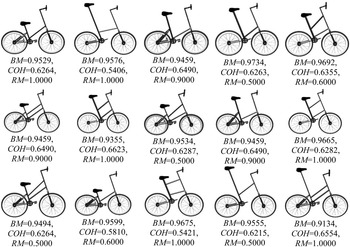
Obtained design parameters are loaded into a bicycle model template created in the Unigraphics NX environment. Among the optimized bicycle design schemes, some examples are shown in Figure 5 with their aesthetic measure results. These schemes clearly display the structural design, despite less important details like chains and brakes. Designers can further verify them aesthetically, choose a preferred one, and adopt the geometry for detailed design.
Examples of optimized design schemes.

Method validation
The proposed evolutionary form design method is first validated through subject rating for original and optimized form designs by experts. A total of 10 bicycle designs are used for validation here, including the six bicycle designs for aesthetic measure selection and four randomly selected optimized design. They are rated by those experts included in the pairwise comparison process as discussed in the section “Bicycle form design”. Experts give ratings for their overall aesthetic values in the range of [1–10] after viewing the 10 bicycle pictures in random sequence. Their ratings are aggregated by average and are summarized in Table 7. It is shown that optimized design schemes generally obtain better ratings than the original ones.
Parameter settlement for comparison experiments

Three quantitative criteria are further used to evaluate the effectiveness of the evolutionary product form design method, namely, number of pareto solutions (NOP), variety of pareto crowdedness (VOPC), and computer run time (time). The NOP is defined as the number of pareto solutions. The VOPC is defined as the standard deviation of crowdedness of pareto solutions. Time is the computation run time. Intuitively, the product form solutions are supposed to be numerous, variant, and given by computers as quick as possible. Having more variant solutions means being less clustered and more evenly distributed. Given that the sum of crowdedness of final population solutions is constant, as given by Eq. (59), the standard deviation of crowdedness indicates the variance level of pareto solutions. The lower VOPC means more even distribution and larger variance. Therefore, pareto solutions with a larger NOP, a smaller VOPC, and a shorter time are the better ones.
 $$\eqalign{\sum\limits_q {{\rm Cr}( X_q) } & = \sum\limits_{q = 2}^{2Z-1} {\left({\sum\limits_i {\displaystyle{{s_i( X_{q + 1}) -s_i( X_{q-1}) } \over {s_i( X_{2Z}) -s_i( X_1) }}} } \right)}\cr &+ \sum\limits_i {\displaystyle{{s_i( X_2) -s_i( X_1) } \over {s_i( X_{2Z}) -s_i( X_1) }}} + \sum\limits_i {\displaystyle{{s_i( X_{2Z}) -s_i( X_{2Z-1}) } \over {s_i( X_{2Z}) -s_i( X_1) }}} \cr & = \sum\limits_i {\displaystyle{1 \over {s_i( X_{2Z}) -s_i( X_1) }}} \left({\sum\limits_{q = 2}^{2Z-1} {s_i( X_{q + 1}) -s_i( X_{q-1}) }}\right.\cr & \left. \quad + s_i( X_2) -s_i( X_1) + s_i( X_{2Z}) -s_i( X_{2Z-1}) \right)\cr & = \sum\limits_i {\displaystyle{1 \over {s_i( X_{2Z}) -s_i( X_1) }}} ( {2s_i( X_{2Z}) -2s_i( X_1) } ) \cr & = 2\ast {\rm size}( S). } $$
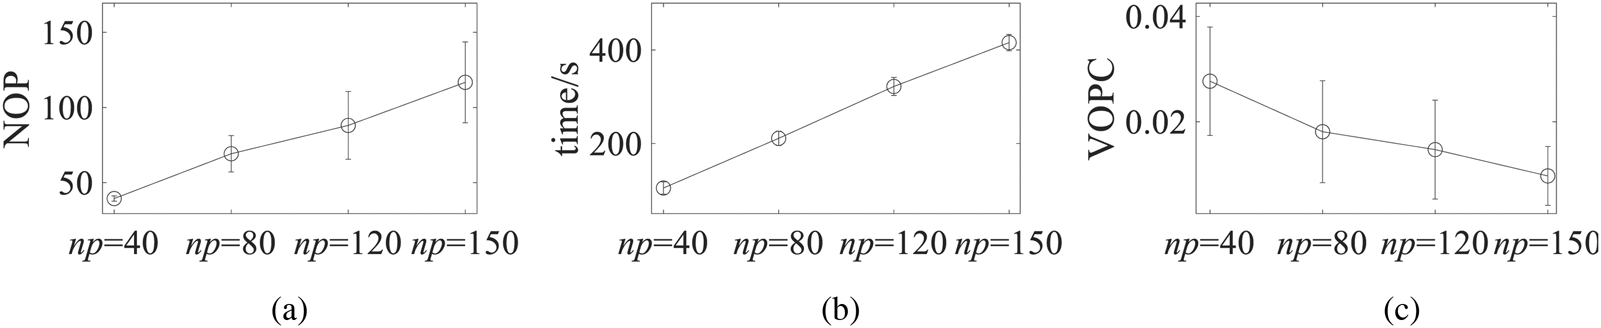
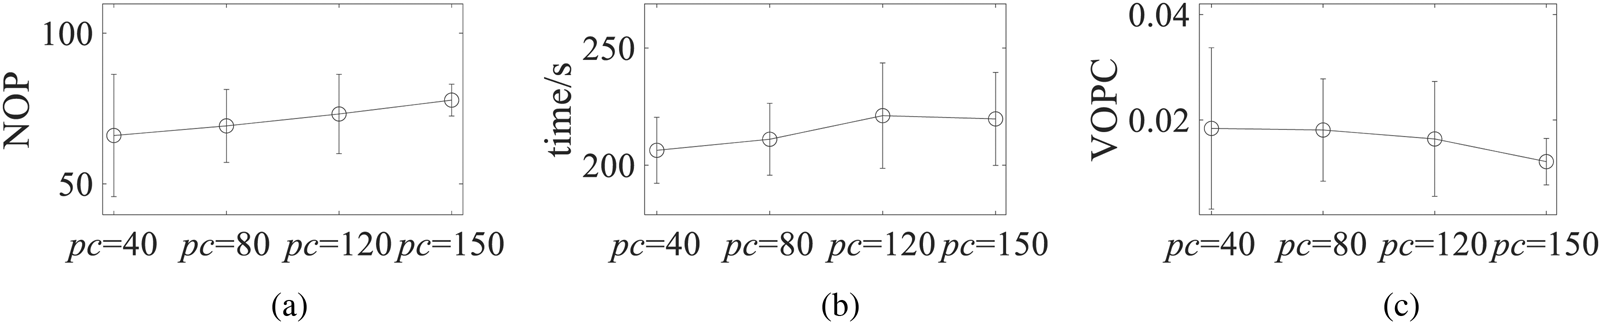
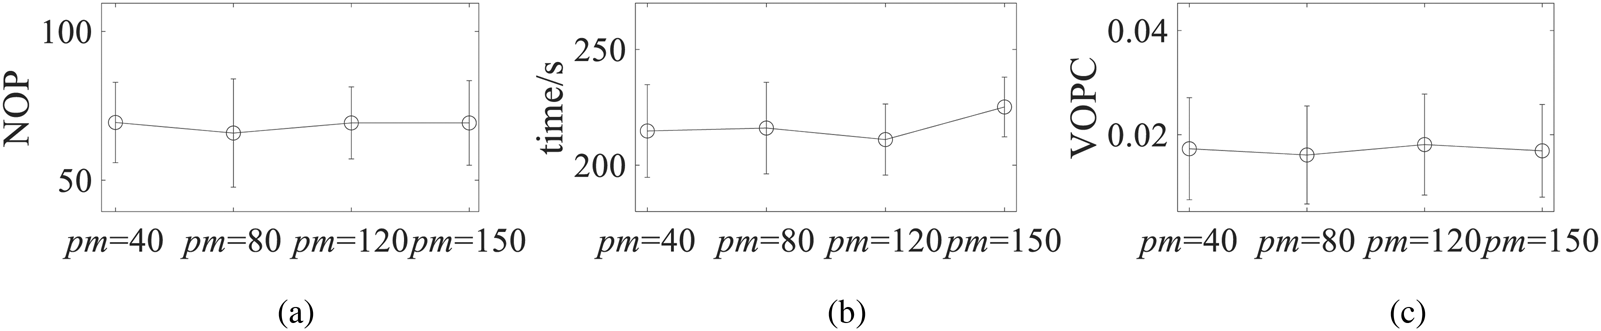
To analyze the effect of np, pc, and pm values on the effectiveness of NSGA-II, three groups of comparison experiments are conducted, respectively, together with the control experiment described above. Parameter settlement for these experiments is summarized in Table 7. The first group consists of three experiments, each with pc set to 0.4, pm set to 0.3, and np chosen from {40, 120, 150}. The second group consists of three experiments, each with np set to 80, pm set to 0.3, and pc chosen from {0.2, 0.6, 0.7}. The third group consists of three experiments, each with np set to 80, pc set to 0.4, and pm chosen from {0.08, 0.2, 0.4}. Each experiment has 20 trials conducted. The average and variance of NOP, VOPC, and time of experiments are shown in Figures 6–8.
Comparative experiment results for Group 1 (pc = 0.4, pm = 0.3) with variant np.

Comparative experiment results for Group 2 (np = 80, pm = 0.3) with variant pc.

Comparative experiment results for Group 3 (np = 80, pc = 0.4) with variant pm.

Sensitivity analysis: group 1
Experiments of group 1 show that np has obvious impact on three criteria (NOP, VOPC, and time), as shown in Figure 6. The NOP increases largely as np increases, while the ratio of NOP to np decreases slightly. The VOPC drops as np increases. Time is almost proportional to np. The relationship between NOP and np may be explained by that larger np leads to a denser population. This creates more solutions but also causes the proportion of pareto front in the population to be smaller. A dense population also explains the relationship between VOPC and np. When solutions are more crowded, they are more likely to be evenly distributed. The proportional relationship between time and np is due to that most computation operations need to traverse the whole population.
Sensitivity analysis: group 2
Experiments of group 2 show that pc also influences the three criteria, as shown in Figure 7. Both NOP and time increase slightly as pc increases, while the VOPC decreases. The degree of varying is small compared with group 1. In NSGA-II, cross operations intersect existing chromosomes to go through the latter selection process, which promotes the superior solutions to prevail in the whole population. Larger pc means that the evolvement of population is more guided towards the superior solutions in pareto front. Therefore, the NOP increases with larger pc. Cross operations conducted by randomly picking chromosomes also reduce the solutions’ tendency to cluster. This can explain that the VOPC decreases with larger pc. A slight increase of time shows that cross operations contribute partially to the overall computational effort.
Sensitivity analysis: group 3
Experiments of group 3 show that pm has no obvious effect on both NOP and VOPC, as shown in Figure 8. Its effect on time is also uncertain. However, mutation operations randomly create new chromosomes and is an important way of exploring global optimal solutions. This can be validated via the variety of optimized design schemes. Some solutions may have very different design parameters but have similar aesthetic measure scores. Considering the effects of np, pc, and pm, the settlement in Table 6 is used in the above case study. The requirement of numerous and various solutions is balanced with a short period of time.
Discussions
The proposed evolutionary product form design algorithm combines the aesthetic dimension selection and the design parameter optimization. To realize form design based on aesthetics, other approaches are applicable. The first is to use the weighted sum of all aesthetic dimensions as overall evaluation score and then solve the single-objective optimization problem. The second is to include all aesthetic dimensions in the multi-objective optimization algorithm. The third alternative is to select a subset of aesthetic dimensions as the proposed approach, then use the weighted sum of selected aesthetic dimensions as an overall evaluation score. For the first approach, weights for dimensions play an important role, but the weighting process further involves subjectivity. When aesthetic dimensions are as much as 11, weighting is more invalid. Single-objective optimization also increases the difficulty to find transactions of dimensions. For the second approach, numerous aesthetic dimensions as objectives means the optimization problem is more complex. For the third approach, the weighting process is simplified but still exists and brings bias. Our experiments show that the increase of objectives number will largely increase the size of population, maximum iteration required. Consequently, computation run time and the number of pareto solutions are increased. Although more solutions are obtained, the ratio of NOP to np is lower which means the solutions are less optimal. Designer may need to review more design schemes generated to make decisions. In fact, high-dimensional optimization is still difficult for current methods. The proposed evolutionary product form design method uses aesthetic dimension selection to deal with this deficiency. At the same time, expertise can be involved in the selection step to complement computer intelligence.
Conclusions
This paper focuses on form design based on aesthetics. The aesthetic evaluation of product has increasingly big impact on user satisfaction and the product's success in market. To quantify the process of aesthetic evaluation, aesthetic measure theory is adopted in this paper. Based on the aesthetic theory in arts, the latest achievements in psychology and so on, aesthetic measure uses formula to compute multi-dimensional aesthetic values. For 3D-shape product, 11 commonly used aesthetic dimensions are introduced. We further propose to select aesthetic dimensions with expert decision-making. Aesthetic measure results of several design schemes are compared with the results by expert. The selection is achieved by selection sequence optimization and solved by the PSO algorithm. With selected aesthetic dimensions, design parameters are optimized with elitist MOO algorithm NSGA-II. Finally, pareto solutions are loaded into the product form template in the modeling environment for visualization. Designers can choose the one they prefer as the final design scheme, or use them for innovation.
This evolutionary product form design method is capable of generating numerous aesthetically optimized design schemes in a short period of time. As illustrated in the case study of bicycle form design, structural arrangements are optimized to inspire a sense of beauty implicitly by aesthetic measure. Aesthetic dimension selection based on expert decision-making improves the validity of aesthetic measure by retaining the dimensions that most accords with results by expert. Generated solutions are numerous and variant by NSGA-II. Our method is valuable for both product redesign and new product innovation. In many scenarios where aesthetics is important, this method can efficiently support designers to define form design scheme in the conceptual design phase, which is the key foundation of detailed design.
There remain some limitations to be solved in future research. Firstly, parameterization of complex product form is still difficult. To allow more adaptive and creative designs to be generated, the better parameterization method should be applied that can capture high-level semantic knowledge of product and describe as much characteristics of product form as possible. Secondly, the number of design schemes obtained by our method is not small enough for experts to decide. The number of experts involved will be kept small but the backgrounds of experts will vary among industries and academics. Aesthetics can be coupled with other factors, like dynamics and ergonomics, to further extract ideal designs. Thirdly, as separate design stages can lead to low efficiency, one-stage optimization considering multiple factors will be a focus of our future study. Fourthly, using weights for selected dimensions and optimizing the overall aesthetic score by single-objective optimization is another feasible way which avoids complex optimization computation. Future research will consider better weighting mechanism instead of subjective weighting. Finally, further research on the theory of aesthetic measure is needed. For example, relative importance of preferred proportions should be defined with the guidance of reliable theories for specific design scenarios.
Financial support
This research is supported by the National Natural Science Foundation of China (51975360, 52035007) and the National Social Science Foundation of China (17ZDA020).
Lingyu Wang is a PhD student in the School of Design at Shanghai Jiaotong University. Her research interests include human ergonomics, design morphology, and theoretical approaches to innovative design.
Siyu Zhu is a PhD student in the Department of Mechanical Engineering and Power Engineering at Shanghai Jiaotong University. Her research interests include design theory and method, data mining, and machine learning algorithms.
Jin Qi is currently an associate research fellow in the Department of Mechanical Engineering and Power Engineering at the Shanghai Jiaotong University. He received his PhD degree in Mechanical Engineering from the Shanghai Jiaotong University, Shanghai, China, in 2010. His research interests include product innovation method, mechanical product development, artificial intelligence, and knowledge based engineering.
Jie Hu is currently a professor in the Department of Mechanical Engineering and Power Engineering at the Shanghai Jiaotong University. He received his PhD degree in Mechanical Manufacturing and Automation from the Zhejiang University, Hangzhou, China, in 2001. His research interests include knowledge based engineering, knowledge fusion, design innovation, and bioinformatics.