Introduction
Oilseed rape, also known as canola, is the third most important oilseed crop in the world, after palm and soybean (FAO, 2019). Oilseed rape seed yield has increased in the last 40 years in most countries, although this yield gain has not been accompanied by greater yield stability (Rondanini et al., Reference Rondanini, Gomez, Agosti and Miralles2012). Multi-environment trials (MET) involving a number of cultivars in several regions have been used to quantify the genotype by environment (G × E) interaction in oilseed rape around the world. For example, G × E interaction analyses have been performed in contrasting oilseed rape growing regions in Canada, Finland, Poland, Turkey, Iran, Pakistan, China and Australia (Brandle and McVetty, Reference Brandle and McVetty1988; Peltonen-Sainio and Jauhiainen, Reference Peltonen-Sainio and Jauhiainen2008; Moghaddam and Pourdad, Reference Moghaddam and Pourdad2011; Pilarczyk, Reference Pilarczyk2013; Tahira et al., Reference Tahira, Khan and Amjad2013; Zhang et al., Reference Zhang, Berger and Milroy2013, Reference Zhang, Berger and Herrmann2017; Mortazavian and Azizi-Nia, Reference Mortazavian and Azizi-Nia2014; Nowosad et al., Reference Nowosad, Liersch, Popławska and Bocianowski2016; He et al., Reference He, Wang, Wang and Lilley2017). In South America, G × E analyses have been conducted previously for sunflower, soybean and maize yields (de la Vega et al., Reference de la Vega, Chapman and Hall2001; Dardanelli et al., Reference Dardanelli, Balzarini, Martínez, Cuniberti, Resnik, Ramunda, Herrero and Baigorri2006; Acorsi et al., Reference Acorsi, Guedes, Coan, Pinto, Scapim, Pacheco, Guimaraes and Casela2017), but for oilseed rape, G × E analysis has been limited to the Southeast of the Pampas Region (Takashima et al., Reference Takashima, Rondanini, Puhl and Miralles2013).
The analysis of the stability and adaptation of cultivars to different environments is necessary before recommending them for planting in large areas, in order to ensure yield stability. Significant efforts have been devoted around the world in order to identify high-yielding genotypes with high yield stability, searching for both specific adaptability to the environment (Zhang et al., Reference Zhang, Berger and Milroy2013; Nowosad et al., Reference Nowosad, Liersch, Popławska and Bocianowski2016) and broad adaptability (Tahira et al., Reference Tahira, Khan and Amjad2013; Mortazavian and Azizi-Nia, Reference Mortazavian and Azizi-Nia2014; Zhang et al., Reference Zhang, Berger and Herrmann2017).
Linear mixed-model approaches have become appropriate for the analysis of cultivar trials and there are numerous reasons for their use, including the simplicity with which unbalanced data (not all cultivars in all trials) can be handled (Smith et al., Reference Smith, Cullis and Thompson2005). Indeed, it is an important way to overcome mined databases in order to evaluate yield stability (Hu, Reference Hu2014). Several measurements of yield stability can be performed to recommend cultivars or to select breeding material for stable yields. Shukla's ecovalence (Shukla, Reference Shukla1972) is usually applied by breeders to evaluate the performance of particular genotypes in a wide range of environments and thereby take decisions for recommendations about the best material in each particular environment.
The objectives of the current study were (i) to quantify G × E interaction in spring oilseed rape yield by applying a weighted two-stage mixed-model approach to the data set of the official MET evaluation performed by the National Institute of Agricultural and Technology of Argentina (INTA) and (ii) to identify genotypes with wide adaptability through yield stability analysis, as well as the main environmental drivers related to seed yield variability in the Argentine Pampas. It is hypothesized that E and G × E interactions greatly contribute to the total variance of seed yield in spring oilseed rape. Also, it is expected that high-performing genotypes can be identified, especially under extremely dry and wet environments.
Materials and methods
Data set source
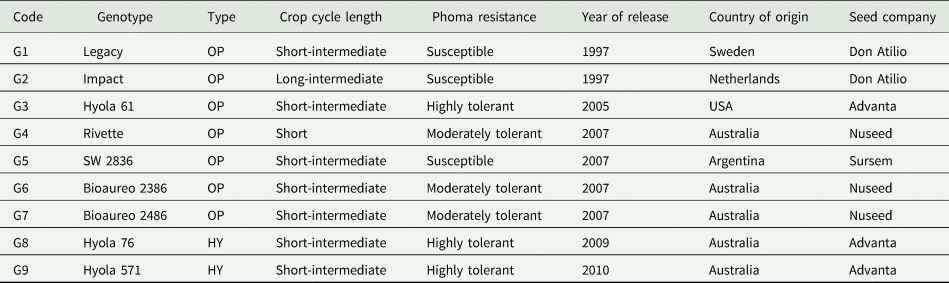
The data set was extracted from the official MET conducted by INTA in Central and Southern regions of the Argentine Pampas. The network data are public and seed companies participate freely and voluntarily. The database contained a total of nine commercial spring genotypes (coded G1–G9), including three hybrids and six open-pollinated genotypes, released from 1997 to 2010 (Table 1), sown along an optimum range of sowing dates (i.e. from May to early June) according to Iriarte and Valetti (Reference Iriarte and Valetti2008).
Details of the spring oilseed rape cultivars evaluated

OP and HY denote open-pollinated and hybrid genotypes, respectively.
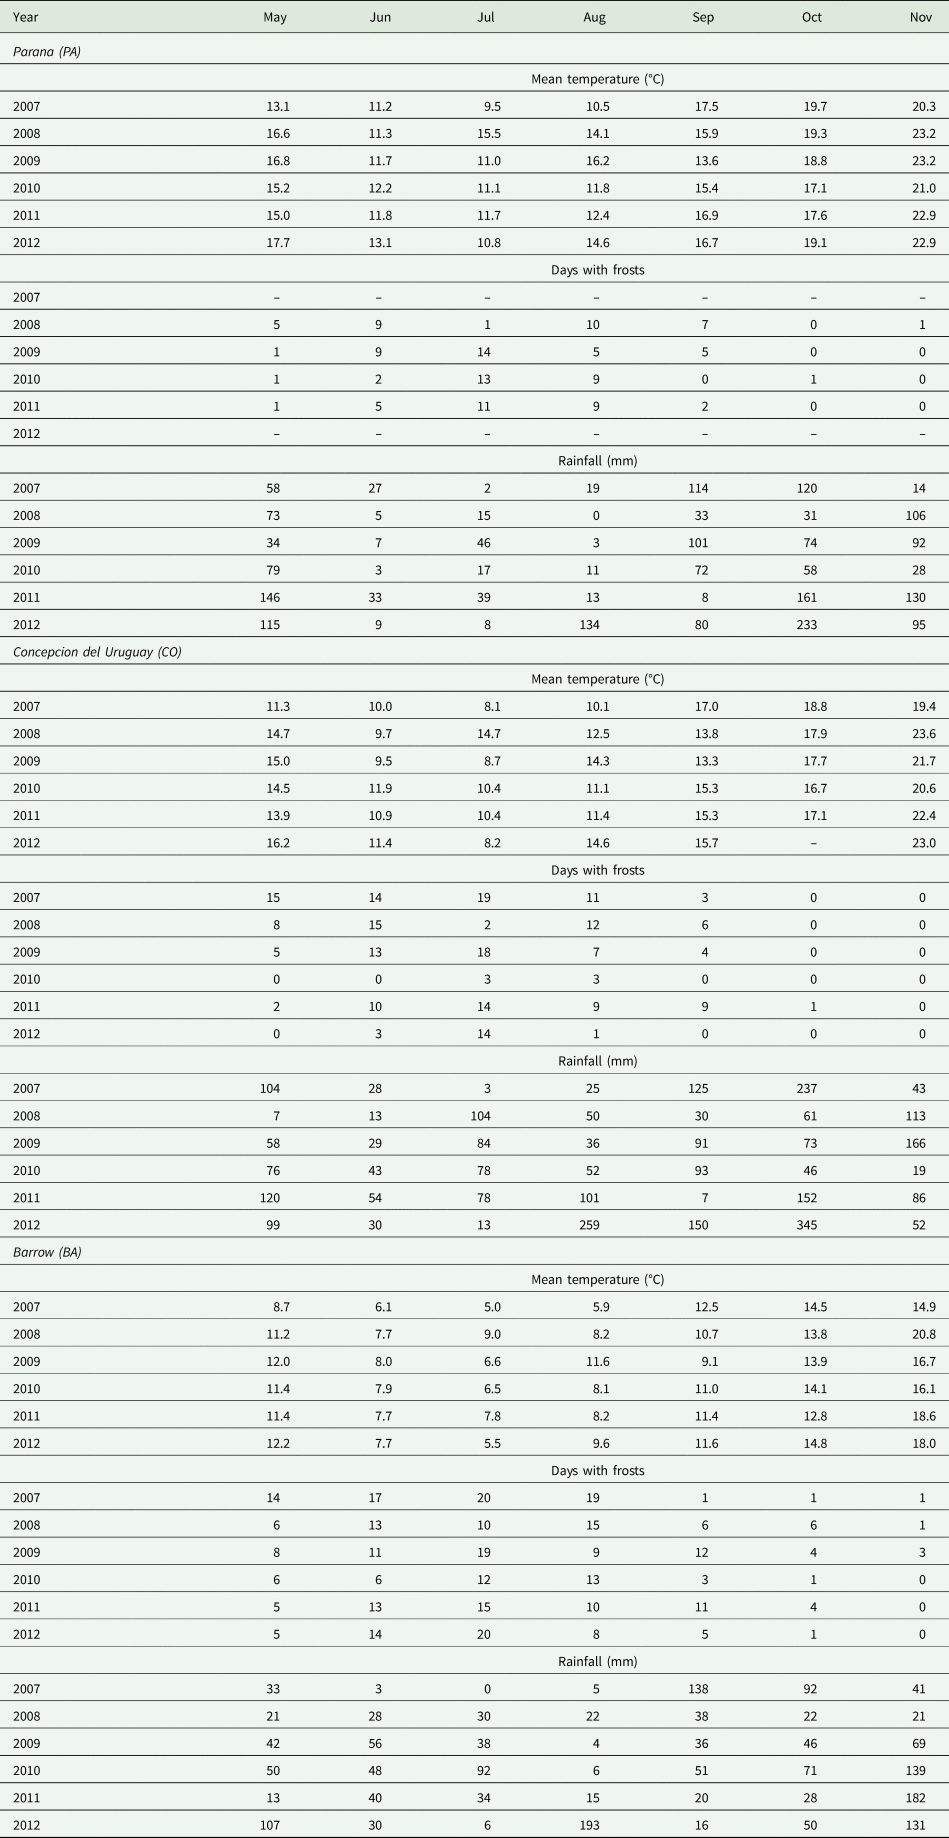
Genotypes were tested in 18 environments resulting from the combination of three locations (Parana, PA; Concepcion del Uruguay, CO; and Barrow, BA) and six consecutive years (2007–2012). Locations contrasted in soil and climate characteristics (Table 2). The soil in Parana is acquic argiudoll, softly undulating to plane with high fertility; whereas Concepcion del Uruguay is an undulating plain with well-drained, deep vertic argiudoll soil. By contrast, in Barrow, the soil has an effective depth of 0.7 m, limited by the presence of a petrocalcic layer (Cruzate et al., Reference Cruzate, Panigatti and Moscatelli2008; Panigatti et al., Reference Panigatti, Cruzate, Tasi and Bedendo2008).
Climatic and soil characteristics of the locations evaluated in the current study

Weather conditions were highly variable among years, with 2007 as the coolest and 2008 as the warmest year. There was a fourfold variation in rainfall between years, with 2008 and 2012 as the driest and wettest years, respectively. Also, the number of days with minimum temperature <0 °C (frosts) showed an important variation between years and locations. Environmental conditions registered in 2010 were extremely favourable for all winter crops in Argentina, resulting in yields 25% above the national long-term averages (FAO, 2019). Detailed data of monthly mean temperature, cumulative rainfall and number of days with frosts are shown in Table 3.
Weather conditions during the crop cycle for each year and location included in the current study

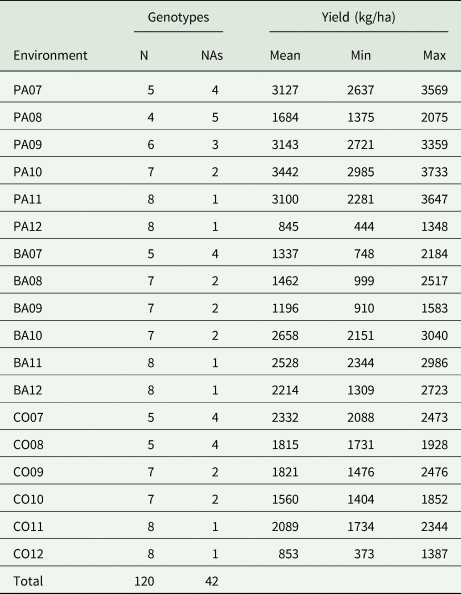
The evaluated genotypes were different between years and locations, resulting in a mined database (25% of missing data, Table 4). All trials were arranged as randomized complete block designs with three replicates. Typically, each plot consisted of four rows 6 m long, 0.25 m inter-row distance and a plant density of 80 plants/m2. Trials were conducted under rainfed conditions, fertilized with nitrogen (N), phosphorous (P) and sulphur (S, Iriarte and Valetti, Reference Iriarte and Valetti2008). Weeds and pests were controlled chemically. May–August was defined as the typical pre-flowering period for PA and CO, and September–October as the post-flowering period in both locations. For BA, May–September and October–November were defined as the typical pre- and post-flowering periods, respectively. Seed yield was obtained by the mechanical harvest of plots and expressed at 8.5% seed moisture (the base value of marketing in Argentina).
Number of genotypes tested (N), number of missing genotypes (NAs), mean (of three replicates), minimum and maximum seed yield (kg/ha) measured for spring oilseed rape in each of the 18 environments from the combination of three locations (PA: Parana, CO: Concepcion, BA: Barrow) and 6 years (2007–2012)

Statistical analysis
A weighted two-stage approach (Smith et al., Reference Smith, Ganesalingam, Kuchel and Cullis2015) was undertaken to analyse the MET data set. The estimated variety means from the analysis of individual trials in stage 1 were combined in a weighted across trials mixed-model analysis in stage 2. In stage 2, a general linear mixed model was used for fitting oilseed rape yield (y ijk) means from k genotypes (G), i locations (L) and j years (Y) as follows:

where: μ = overall mean effect; α i = fixed effect of location i; β j = fixed effect of year j and αβ ij = fixed interaction effects for location i and year j; τ k = random effect of genotype k; τα ik = random interaction effects for genotype k and location i; τβ jk = random interaction effects for genotype k and year j; ταβ ijk = random interaction effects for genotype k, location i and year j; ε ijk = residual effect.
Genotype effects were considered as random because some of them were not tested in several locations and/or years, associated with a free choice of the seed companies invited to participate in the MET, as was stated above, and/or discarded plots due to harvesting problems (25% of missing data, Table 4). Random genetic effects were assumed to follow a multivariate normal distribution with zero means and variance σ g2, σ gl2, σ gy2 and σ gly2 for G, G × L, G × Y and G × L × Y interaction, respectively. Random residual effects were assumed to follow a multivariate normal distribution with zero means and variance $(\sigma _e^2 )_{ij}$ . The non-genetic variance parameters were replaced, in a diagonal approximation, by their estimates obtained in the first stage (Gogel et al., Reference Gogel, Smith and Cullis2018). The model (1) assumes that genetic effects are independent, with homogeneous variance structure. The pattern of genetic covariance for the G × L × Y interaction was analysed with the factor analysis (FA) technique. Variance parameters of the models were estimated by restricted maximum likelihood (Patterson and Thompson, Reference Patterson and Thompson1971). The solution for the estimated fixed effects and realized values of random effects was obtained from mixed-model equations (Henderson, Reference Henderson1984). Finally, predicted values (best linear unbiased predictions, BLUP) of oilseed rape yield for each ijk combinations of G, L and Y (n = 162) were obtained.
To analyse the effect of G × E interaction, FA was applied to the seed yield BLUP data in order to reduce the dimensionality and achieve a small number of abstract variables (F, factors) that assembled original variables strongly linked among each other, but weakly correlated to the other factors (Johnson and Wichern, Reference Johnson and Wichern1992). The methodology proposed by Murakami and Cruz (Reference Murakami and Cruz2004), based on FA, was used to determine genotype adaptability and environment characterization. Environmental loadings obtained in FA were regressed with the following meteorological data available for each location in each year for pre- and post-flowering phases: mean temperature, cumulative rainfall and number of days with frosts (Table 3). Linear and bi-linear broken-stick functions with an unknown break point were fitted to relationships between F1, F2 and F3 loadings and meteorological variables.
The stability index proposed by Shukla (Reference Shukla1972) was calculated from BLUP yield in order to estimate stability variance of genotypes. In addition, seed yields of G in each location were compared for dry (2008), well-supplied (2010) and excessively wet (2012) years. Genotypic variations were expressed in relative terms (%) with respect to average yield for each L × Y combination. The Proc mixed procedure on the SAS system V9.2 (2011) and Gene software (Cruz, Reference Cruz1998) were used for statistical analyses.
Results
Estimation of fixed and random effects for oilseed rape yield
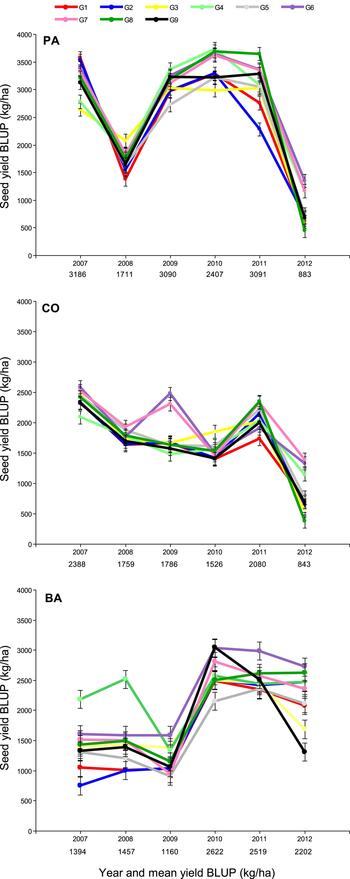
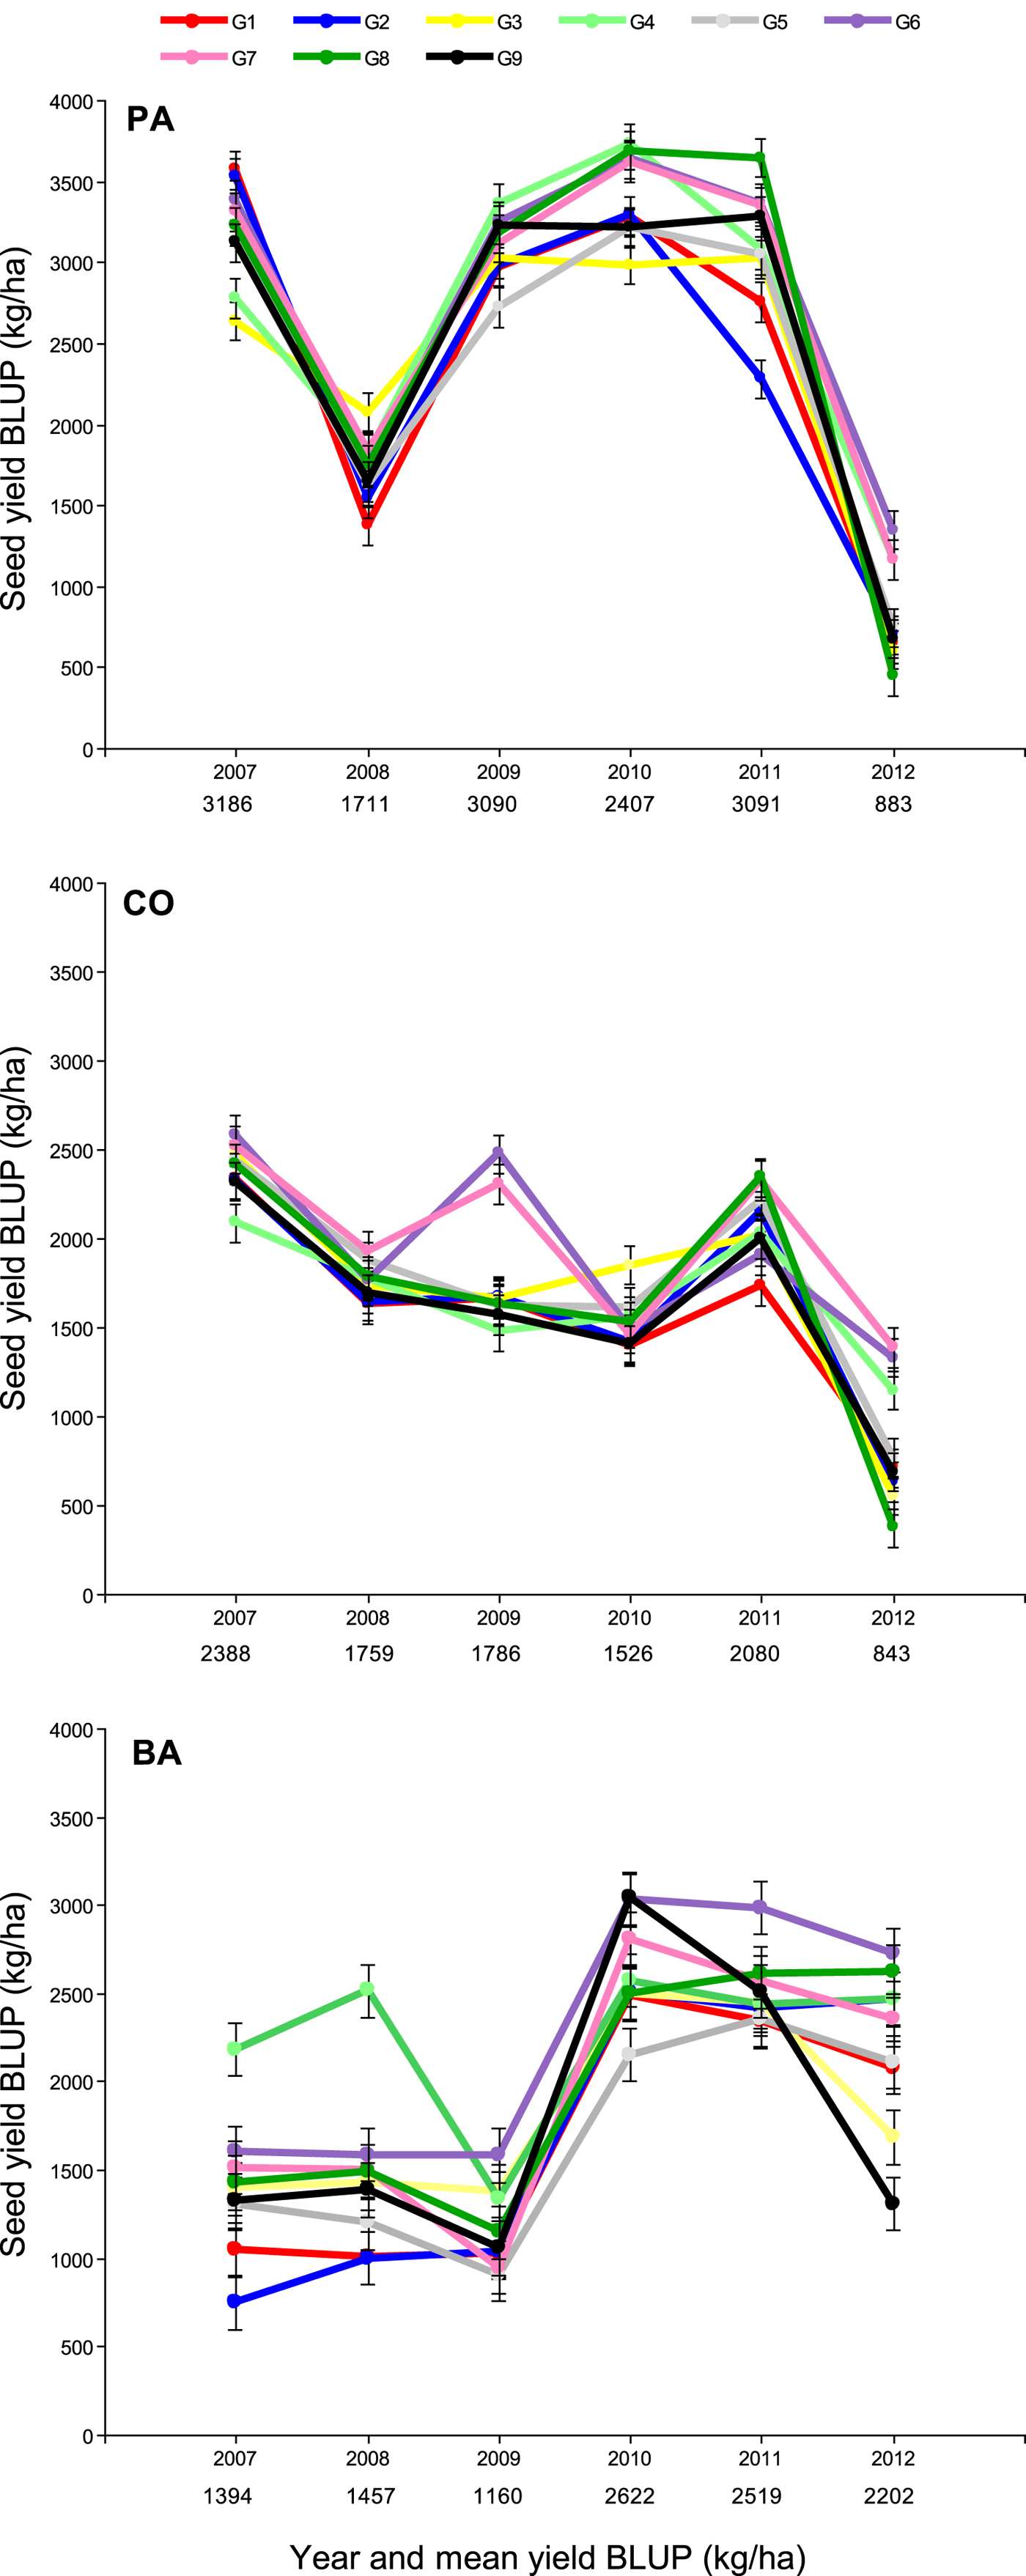
Genotypic grain yield predictions (BLUP) ranged from 377 to 3733 kg/ha varying between L and Y (Fig. 1). Fixed effects, including L × Y interaction, were significant (P < 0.001), indicating that L effect is not independent of Y variability. The location expressing the highest seed yields was found to be PA, except in 2008 and 2012, when low seed yields were observed for all locations (Fig. 1).
Predicted seed yield (kg/ha) (mean best linear unbiased predictions (BLUP)) for nine spring oilseed rape genotypes tested in three locations in the Argentine Pampas during 6 years (2007–2012). The panels correspond to the three locations (PA: Parana, CO: Concepcion del Uruguay and BA: Barrow). The environment mean yield is shown on the x-axis underneath the year. Vertical bars are S.E.M. See genotype code in Table 1. Colour online.
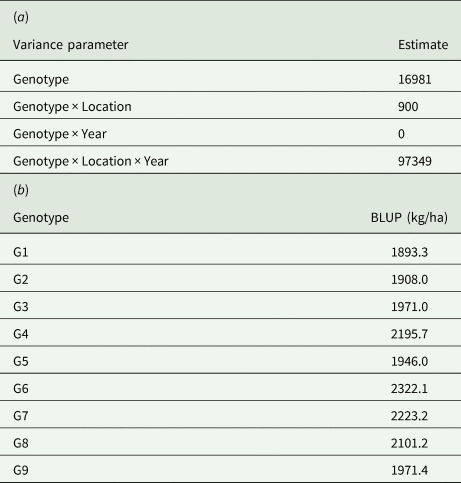
Large components of variance for G and G × Y × L interaction were found relative to double interactions G × L and G × Y (Table 5a). Mean BLUP of genotypes are listed in Table 5b: it is important to highlight that the genotypes G6, G7 and G4 were those with the highest predicted seed yield values, whereas the opposite occurred with the genotypes G1 and G2 (which are also the oldest genotypes, released in 1997, Table 1).
(a) Restricted maximum likelihood (REML) estimated variance components [(kg/ha)2] for genetic effects. (b) Mean best linear unbiased predictions (BLUP) for genotype

Genotypic stability
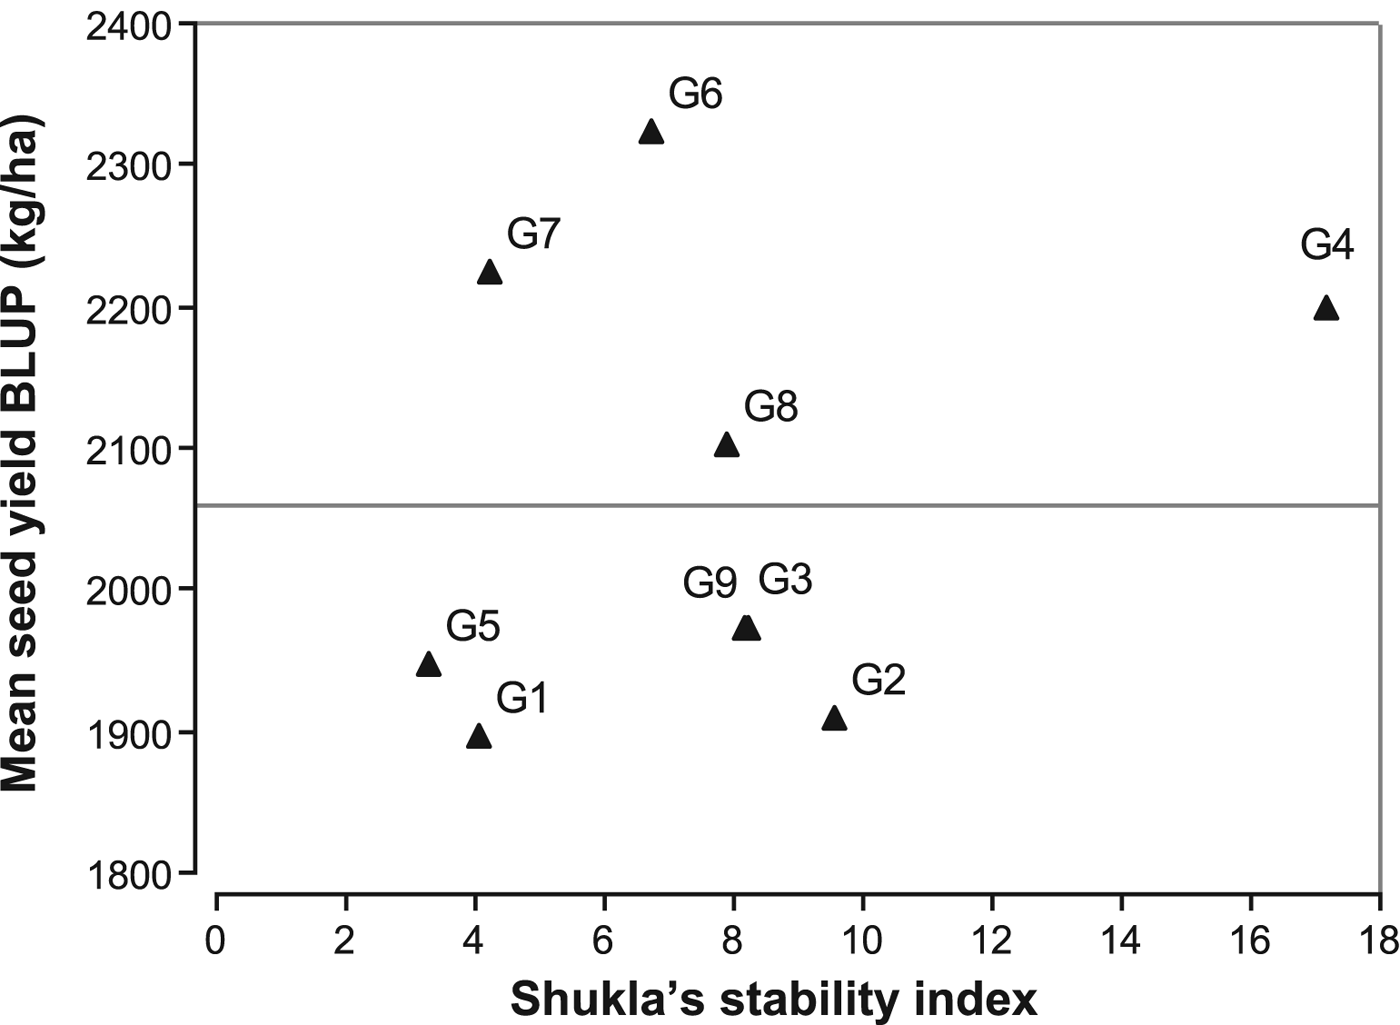
Genotype stability was evaluated by the Shukla's stability index (Fig. 2): G6 and G7 had the highest BLUP mean seed yield and higher stability, whereas G4 showed the lowest stability. Genotype G8 had a seed yield slightly above the mean BLUP values across environments with an intermediate Shukla's stability index in relation to the rest of the genotypes (Fig. 2).
Mean seed yield (mean best linear unbiased predictions (BLUP)) for spring oilseed rape genotypes as a function of the Shukla's stability index. The horizontal line indicates the average grain yield BLUP. See genotype code in Table 1.

Factor analysis of seed yield best linear unbiased predictions data
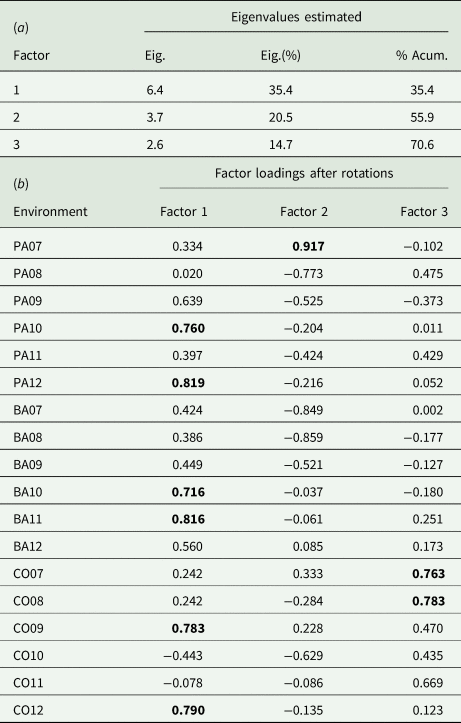
The first three factors accounted for 70% of the total seed yield BLUP variations (Table 6a), with eigenvalues >1. Environments with factor loads ⩾0.7, as suggested by Murakami and Cruz (Reference Murakami and Cruz2004), indicate a high correlation within each factor which allows the establishment of environmental sub-groups (Table 6b). Based on that, it was possible to group the environments PA10, PA12, BA10, BA11, CO09 and CO12 by the final factor loadings of the first factor (Table 6b). Environment PA07 appears isolated in the second factor and environments CO07 and CO08 were grouped in the third factor.
(a) Eigenvalues (Eig.) and (b) factor loadings for environments according to factor analysis considering nine spring oilseed rape cultivars tested over 6 years (2007–2012) and three locations in the Argentine Pampas

PA, CO and BA denote Parana, Concepcion del Uruguay and Barrow locations, respectively. Factor loadings above 0.7 are shown in bold (see text).
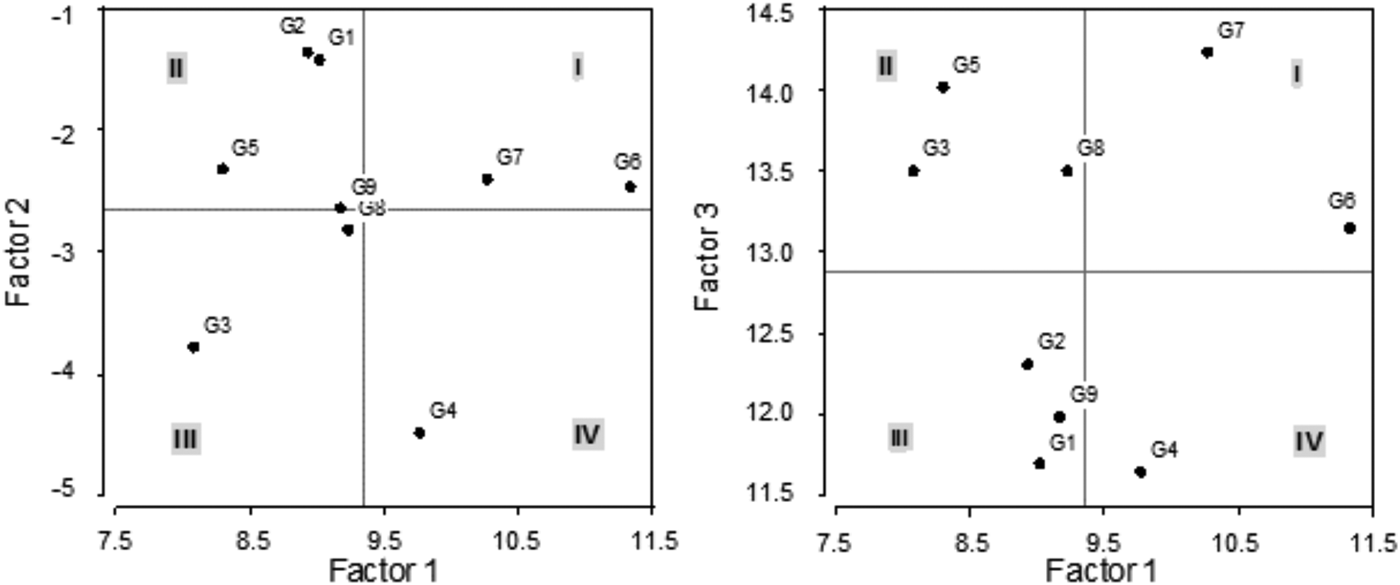
In relation to the performance of the cultivars, G7 and G6 fit into quadrant I, indicating broad adaptability since they presented good performance in the environmental sub-group 1, determined by factor 1, as well as in sub-group 2, determined by factor 2 (Fig. 3). Cultivar G4 presented specific adaptability to sub-group 1, with the environments PA10, PA12, BA10, BA11, CO09 and CO12. Cultivars G1, G2 and G5 showed specific adaptability to sub-group 2 with environment PA07. The cultivar G3 fit into quadrant III and represented the genotype with the lowest performance. Analysis of factors 1 v. 3 indicated the same broad adaptability of cultivars G6 and G7 as well as specific adaptability of cultivars G3, G8 and G5 to sub-group 2 determined by factor 3 with environments CO07 and CO08 (Fig. 3).
Score plot from factor analysis considering nine spring oilseed rape genotypes evaluated in 18 environments (three location × 6 years). Factor 1 and Factor 2 (left), Factor 1 and Factor 3 (right). The letters I, II, III and IV indicate quadrants generated by axes that represent the mean scores of genotypes in the corresponding factor. Factors 1, 2 and 3 explained 35.4, 20.5 and 14.7% of the total variance, respectively. See genotype code in Table 1.

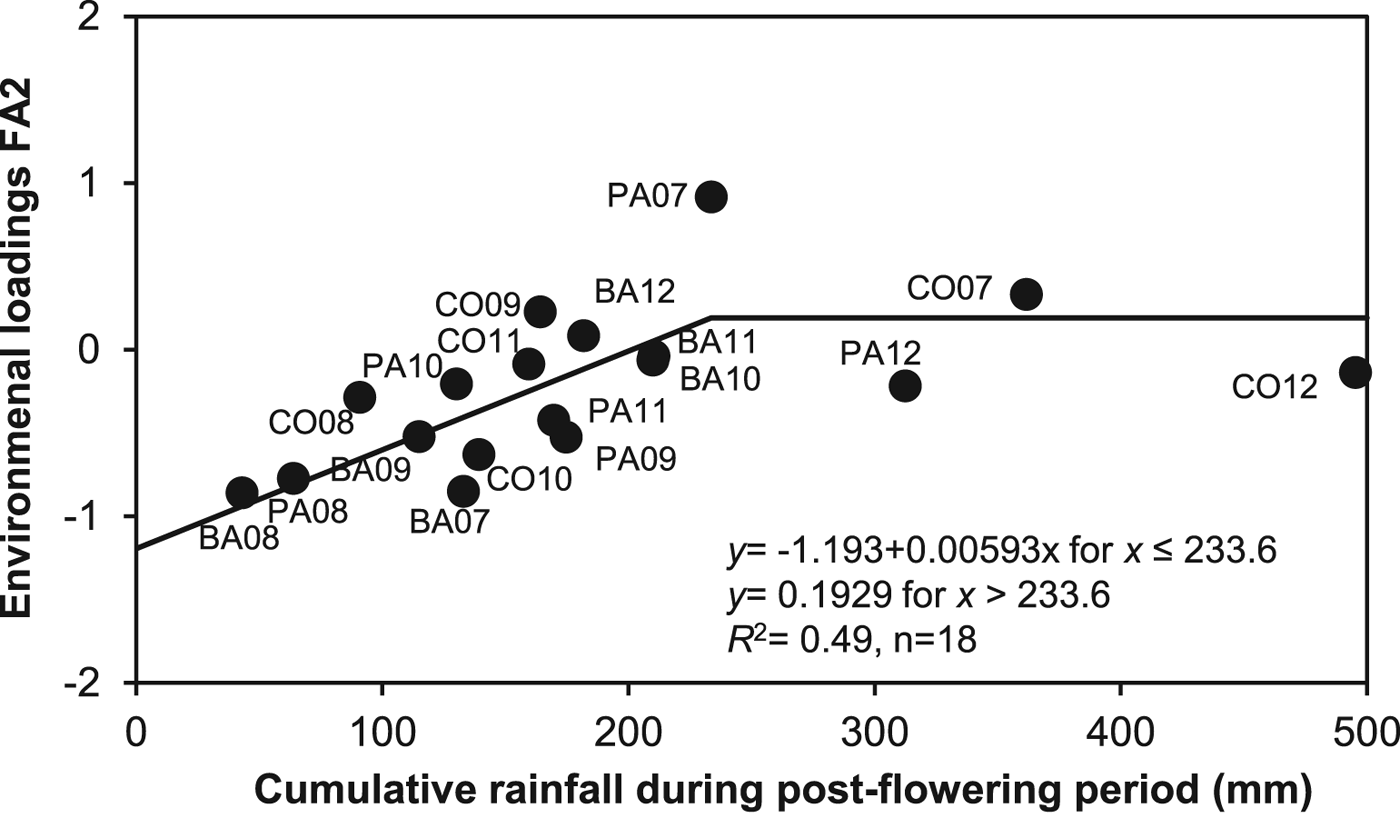
Environmental loadings in factor 2 were significantly associated (P < 0.001; R 2 = 0.49) with cumulative rainfall during post-flowering period, up to 234 ± 46.3 mm (Fig. 4), indicating adaptability of cultivars G1, G2 and G5 to this environmental condition. No other association between environmental loadings in FA and meteorological variables was detected (data not shown).
Relationship between the environmental loadings FA2 and cumulative rainfall (mm) in the post-flowering period, fitted by a bi-linear function (solid line). PA, CO and BA denote Parana, Concepcion del Uruguay and Barrow locations, respectively.

Differential response of cultivars to water supply
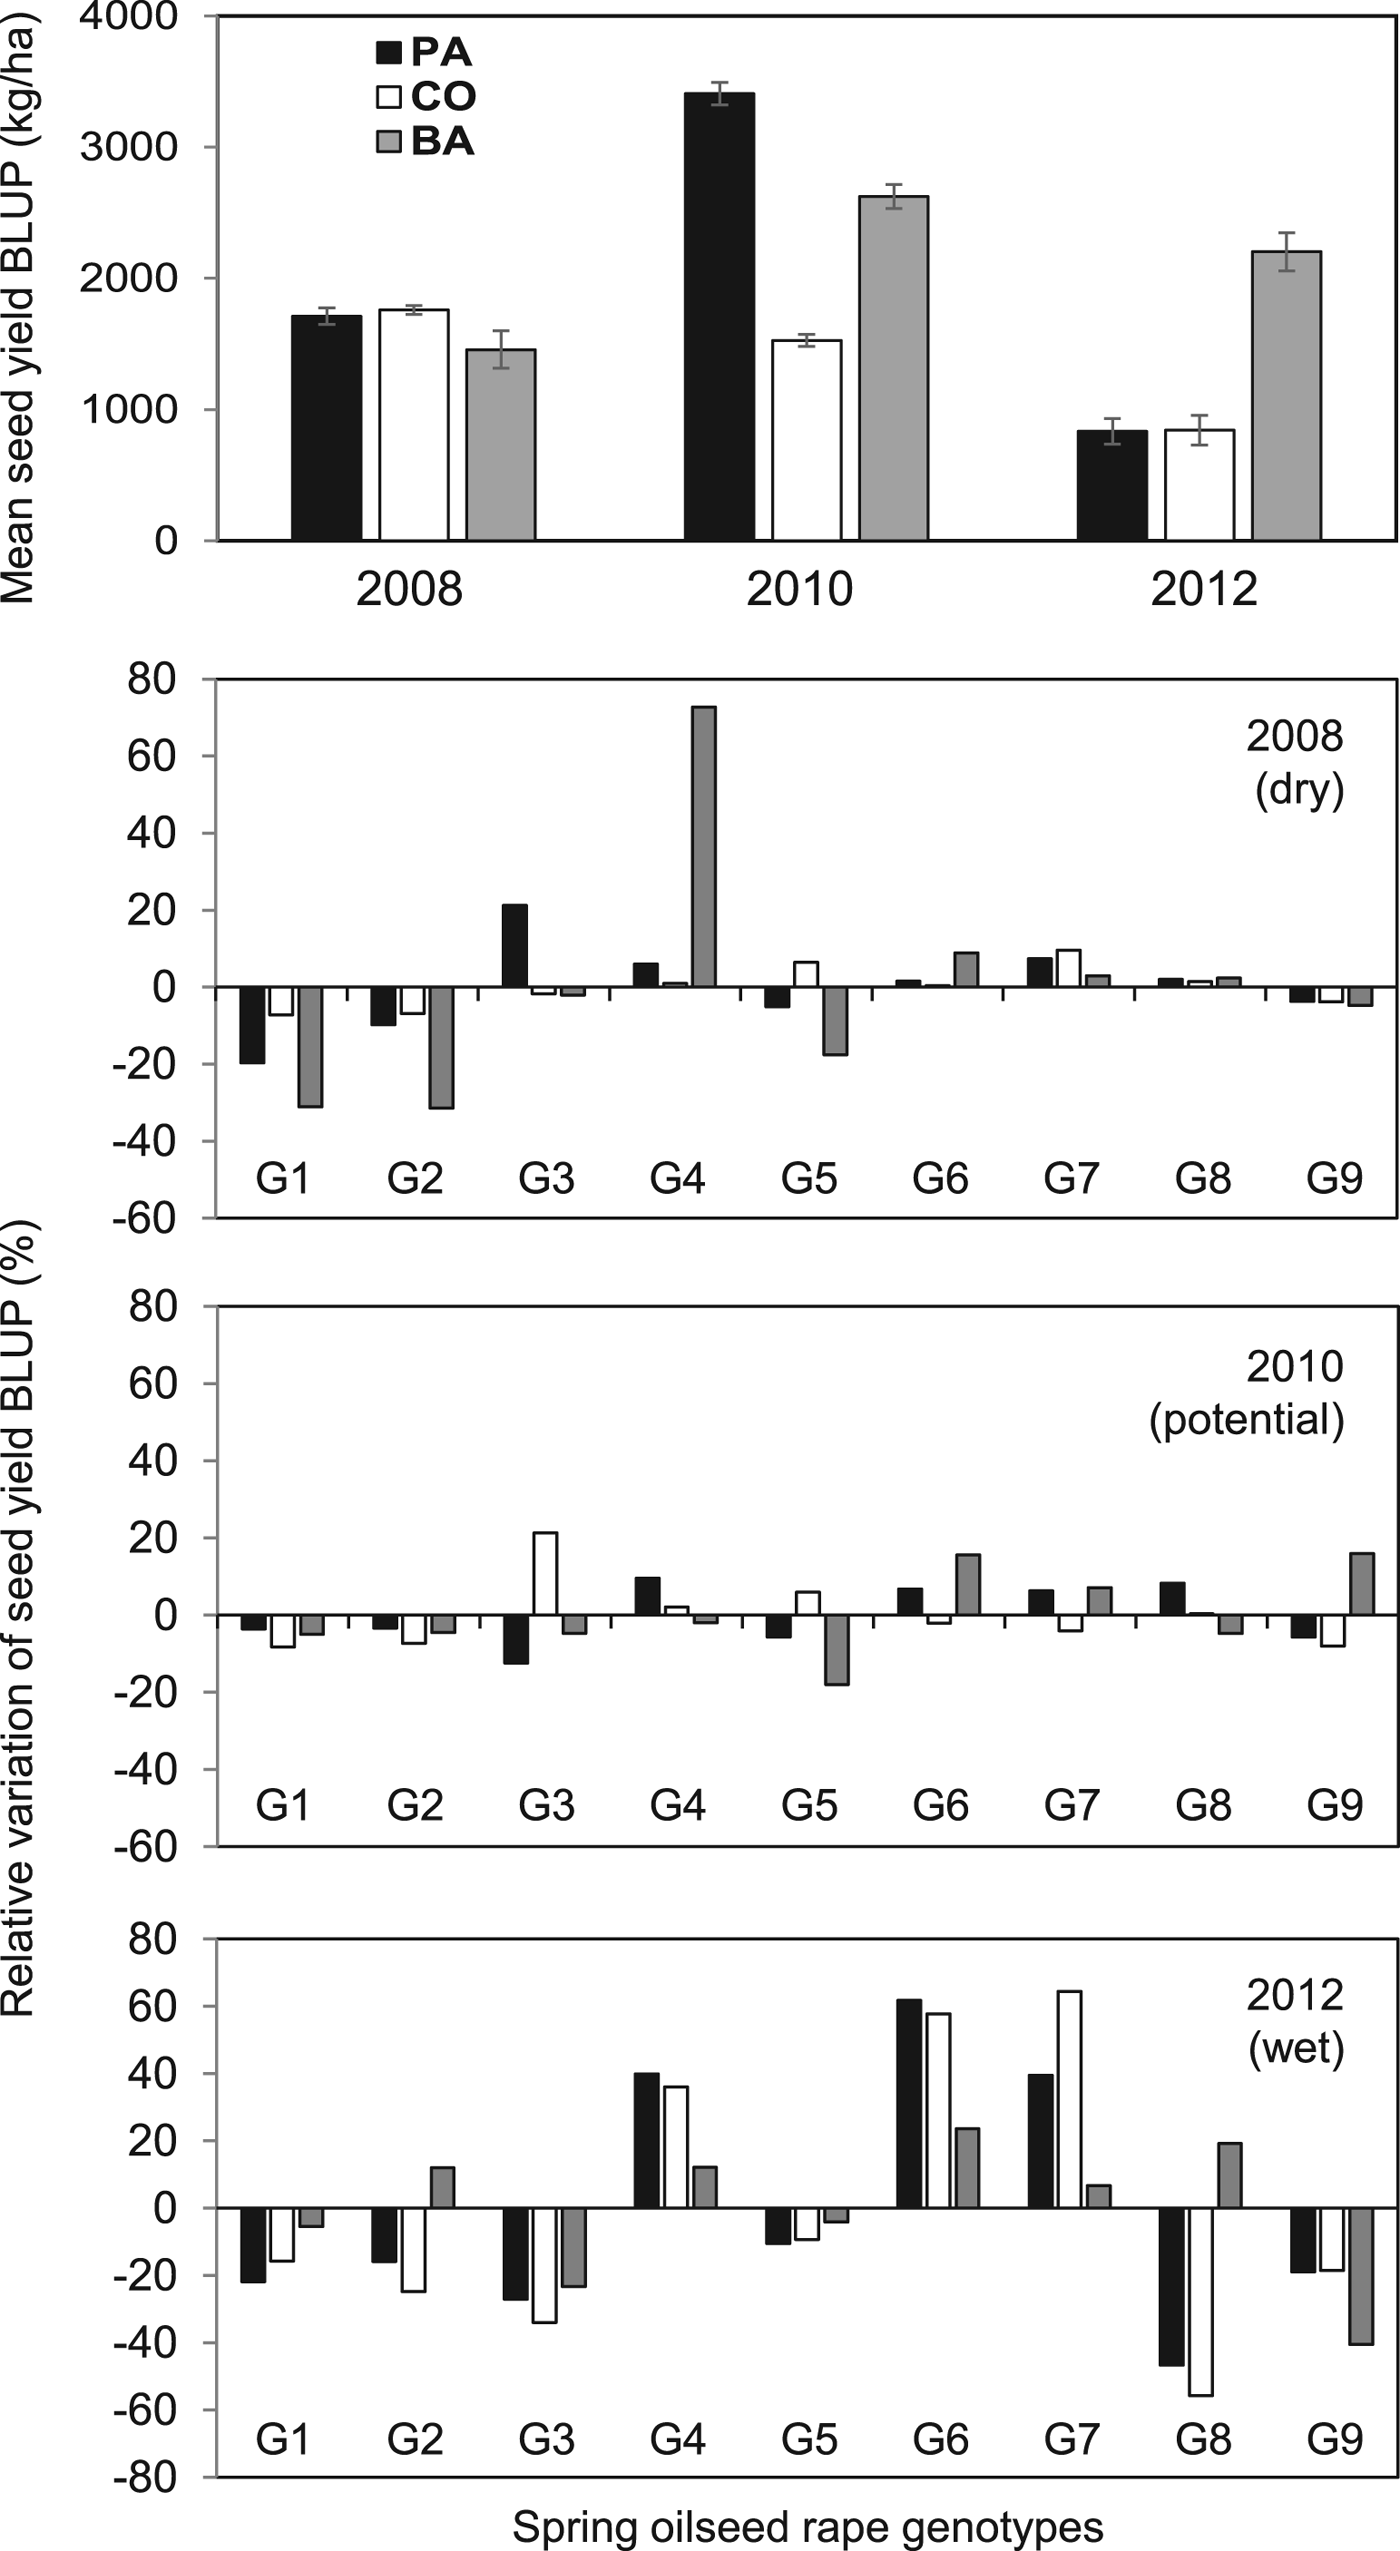
In the dry year 2008, G1 and G2 showed the worst yield performance (reductions of 20–30% relative to an average yield of genotypes for each L × Y combination) whereas the short-cycle cultivar G4 exhibited the highest seed yield (increased by 70%) in BA location (Fig. 5). When environmental conditions were favourable as in 2010, variations between genotypes were small. Best cultivars were G3 in CO (increased by 20%) and G6 and G9 in BA (increased by 15%).
Mean seed yield mean best linear unbiased predictions (BLUP) in three locations (upper panel) and relative variation of grain yield BLUP (with respect to mean BLUP across genotypes within a location) for nine spring oilseed rape genotypes in 3 years contrasting in water availability (dry in 2008, potential well-supplied conditions in 2010, and excessively wet in 2012). PA, CO and BA indicate Parana, Concepcion del Uruguay and Barrow locations, respectively. See genotype code in Table 1.

By contrast, in the excessively wet year 2012, important differences among cultivars were observed. Thus, G4, G6 and G7 had the best performance (increased by 12–60% relative to an average yield of genotypes for each L × Y combination) whereas G1, G3 and G9 showed a poor seed yield in all locations (Fig. 5). Genotypes G2 and G8 had contrasting behaviour between locations, with a low performance in PA and CO (reductions of 15–50%), and a slight increase in BA (by 15%).
Discussion
The current work provides information on the performance of modern spring rapeseed cultivars, identifying at the same time the main environmental factor related to the variability of seed yield, for a group of cultivars evaluated in MET. To our knowledge, this is the first analysis of G × E interaction on spring oilseed rape for a region from 31 to 38°S latitude in the Argentine Pampas, extending a previous study done in south-eastern Pampas (Takashima et al., Reference Takashima, Rondanini, Puhl and Miralles2013).
A highly significant G × E interaction was registered for modern commercial spring oilseed rape cultivars growing under rainfed conditions in the Argentine Pampas. Zhang et al. (Reference Zhang, Berger and Milroy2013, Reference Zhang, Berger and Herrmann2017) explored G × E interaction in Australian oilseed rape, concluding that G × E interaction contributed 34% to total variance of seed yield compared with 9% for G. Similar findings have been observed in contrasting environments around the world, from Finland to Chile (Peltonen-Sainio and Jauhiainen, Reference Peltonen-Sainio and Jauhiainen2008; Escobar et al., Reference Escobar, Berti, Matus, Tapia and Johnson2011; Moghaddam and Pourdad, Reference Moghaddam and Pourdad2011). Also, in other oilseed crops grown in the Argentine Pampas, such as soybean and sunflower, E and G × E interactions were very important components of the total variability (Chapman and de la Vega, Reference Chapman and de la Vega2002; Dardanelli et al., Reference Dardanelli, Balzarini, Martínez, Cuniberti, Resnik, Ramunda, Herrero and Baigorri2006).
In spite of large G × L × Y interactions that made the identification of oilseed rape genotypes with broad adaptation difficult, the varieties G6 (Bioaureo 2386) and G7 (Bioaureo 2486) showed the highest seed yield, high stability according to the Shukla's stability index and broad adaptability in the FA. This information is useful for recommending the best oilseed rape cultivars to farmers for a wide range of environments within the latitudes considered in the current study. Cultivars G6 and G7 are open-pollinated varieties, characterized as spring short-intermediate crop cycle. The results of the current study are in line with Takashima et al. (Reference Takashima, Rondanini, Puhl and Miralles2013), who reported that for the southern region of the Pampas, the spring short-intermediate rapeseed genotypes showed the best performance in terms of yield, compared to winter genotypes (with longer cycles). Winter genotypes have a narrow sowing window in order to fulfil the vernalization requirements, reducing adaptability with respect to the spring genotypes that have a much lower or no vernalization requirement (Gomez and Miralles, Reference Gomez and Miralles2011). Thus, delay in sowing dates (or warmer temperatures during the first part of the crop cycle), avoiding a complete saturation of the vernalization requirement in winter genotypes, could delay flowering time and expose the critical flowering period to non-favourable conditions of radiation and temperature (Kirkegaard et al., Reference Kirkegaard, Lilley, Brill, Ware and Walela2018), as well as increasing the risk of heat shock during seed filling. Beyond this hypothesis, possible advantages of growing short-intermediate genotypes, such as G6 and G7, in the Argentine Pampas should be further tested in a broader range of locations and sowing dates.
The adoption of modern rapeseed hybrids has increased in recent years in the Argentine Pampas. Unfortunately, in the current work, only two hybrids (G8 and G9) were evaluated, so it is not enough to make an adequate comparison between open-pollinated varieties and hybrids. From the literature, high-yielding hybrids with lower stability than open-pollinated varieties can be found (Rahman, Reference Rahman2013; Zhang et al., Reference Zhang, Berger and Milroy2013). Nevertheless, there is evidence for high-yielding hybrids with higher yield stability, even under adverse conditions. For example, Gehringer et al. (Reference Gehringer, Snowdon, Spiller, Basunanda and Friedt2007) showed that heterosis level for yield was particularly high in a nutrient-poor site, where the best hybrids showed significantly higher yields than elite open-pollinating varieties. Genotypes with high stability and high seed yield were also identified in West Poland (Nowosad et al., Reference Nowosad, Liersch, Popławska and Bocianowski2016) and Turkey (Mortazavian and Azizi-Nia, Reference Mortazavian and Azizi-Nia2014). In Australia, Zhang et al. (Reference Zhang, Berger and Herrmann2017) concluded that yield stability and high yield are not mutually exclusive and that breeding for broadly adapted high-yielding canola is possible. Thus, based on the literature, the higher yield potential of modern hybrids does not necessarily seem to be accompanied by lower stability in rapeseed. Future research should compare a good number of open-pollinated varieties and modern hybrids, in a wide range of environments in the Argentine Pampas.
The values of FA1, FA2 and FA3 retained in the FA (70% of the total variation) facilitated the identification of genotypes that expressed a wide range of adaptation capacity, as well as genotypes that were outstanding for groups of environments. This information is crucial for advisors and farmers to determine which cultivars are more suitable for each particular environment in order to optimize yield performance. At the same time, the information is valuable for breeders to understand which genotype is better adapted to each particular environment.
Allard and Bradshaw (Reference Allard and Bradshaw1964) classified environmental factors as predictable or unpredictable. Predictable are those that occur systematically, such as soil type, and management factors, such as row spacing, planting dates, plant population or amount of nutrient application. On the other hand, unpredictable factors are those that fluctuate inconsistently, such as rainfall, relative humidity and temperature. In the current study, the environmental loads in FA2 were significantly related to cumulative rainfall in the period after flowering, with a positive association of up to 230 mm and a plateau for rainfall of 230–500 mm. Thus, data indicate that rainfall is likely to be the principal environmental driver of yield in these field experiments, especially in dry environments during post-flowering (i.e. below 230 mm of cumulative rainfall). The relevance of post-flowering rainfall in determining oilseed rape grain yield was also observed by Zhang et al. (Reference Zhang, Berger and Milroy2013, Reference Zhang, Berger and Herrmann2017) in south-western Australia and Takashima et al. (Reference Takashima, Rondanini, Puhl and Miralles2013) in south-eastern Pampas. In addition, harmful effects of excessively high precipitation during flowering and grain-filling in oilseed rape were recorded for Northern Europe by Peltonen-Sainio et al. (Reference Peltonen-Sainio, Jauhiainen, Trnka, Olesen, Calanca, Eckersten, Eitzinger, Gobin, Kersebaum, Kozyra, Kumar, Dalla Marta, Micale, Schaap, Seguin, Skjelvåg and Orlandini2010), and processes related to waterlogging tolerance have been described recently (Ploschuk et al., Reference Ploschuk, Miralles, Colmer, Ploschuk and Striker2018; Wollmer et al., Reference Wollmer, Pitann and Mühling2018).
In the current study, total rainfall amount (550–1800 mm/year across locations and years) and its distribution were the most important sources of inter-annual variability, presenting up to a fourfold variation throughout the years, related to El Niño–Southern Oscillation (ENSO) events (Messina et al., Reference Messina, Hansen and Hall1999; Leal Filho et al., Reference Leal Filho, Alves, Caeiro and Azeiteiro2014). Genotypic performance in contrasting years points to physiological mechanisms used to deal with drought and excessive water stress. For instance, a possible explanation for the ability of G4 (Rivette, a short-cycle variety) to tolerate drought well during 2008 in the southern-most location (BA) may be related to early flowering, producing lower biomass up to flowering and thereby reducing transpiration during the pre-flowering period and conserving a greater proportion of soil water available for the post-flowering period. Such speculation is in agreement with good performance of early flowering genotypes in dry mega environments from south-western Australia, observed by Zhang et al. (Reference Zhang, Berger and Milroy2013, Reference Zhang, Berger and Herrmann2017). The advantage for early flowering cultivars associated with drought tolerance could be related to a reduction in transpiration up to flowering time and the ability to preserve more water during the post-flowering period, when the critical period for seed number establishment starts (Kirkegaard et al., Reference Kirkegaard, Lilley, Brill, Ware and Walela2018). Other processes related to drought tolerance, such as stomatal responses (Wan et al., Reference Wan, Griffiths, Ying, McCourt and Huang2009; Zhu et al., Reference Zhu, Monroe, Suhail, Villiers, Mullen, Pater, Hauser, Jeon, Bader, Kwak, Schroeder, McKay and Assmann2016), root access to soil moisture (Liu et al., Reference Liu, Gan, Bueckert and Van Rees2011) and enhanced water use efficiency (Pater et al., Reference Pater, Mullen, McKay and Schroeder2017) might also be involved.
On the other hand, the best performance of G6 and G7, with intermediate crop phenology, in all locations during the wettest year, may also be associated with the capacity to produce more biomass at flowering time and, at the same time, has more available water post-flowering, establishing more seeds per unit area and thereby promoting higher yields. Similar yield performance was observed for genotypes with intermediate maturity in the high rainfall area in Australia (Riffkin et al., Reference Riffkin, Potter and Kearney2012, Reference Riffkin, Christy, O'Leary and Partington2016). Ecophysiological mechanisms underlying the performance of the genotypes in the current work need to be studied in greater depth under controlled water supply conditions, in order to identify the most significant processes involved at a crop level (Berry and Spink, Reference Berry and Spink2006). Additionally, the hypothesis stating that genotypes with a short crop cycle (i.e. accelerated phenology) are more successful in dry years (‘Niña’ phase), while intermediate-cycle genotypes are suitable for wet years (‘Niño'phase), needs to be tested.
Acknowledgements
Thanks to Juan Candao (UBA), Leonardo Coll and Juan Jose De Battista (INTA) for data collection.
Financial support
The current study was supported by grants from the University of Buenos Aires (UBACyT Project 20020130100335BA), the National Institute of Agricultural and Technology of Argentina (INTA Project 1127046) and the National Agency for Scientific and Technological Promotion from Argentina (ANPCyT, Project PICT 2016-1294).
Conflict of interest
None.
Ethical standards
Not applicable.