I. INTRODUCTION
Laves phase Cr2Nb, as an ordered intermetallic, has attracted much attention due to its excellent properties.Reference Li, Kuo, Wang and Wang1–Reference Yang, Chisholm, Yang, Ma, Wang and Zhuo3 In spite of a good combination of high melting point, low density, reasonable oxidation resistance, and appreciable creep resistance, the applications of Cr2Nb for use as a high temperature alloy are limited due to its low fracture toughness at room temperature.Reference Ma, Fan, Tang, Peng and Ding4,Reference Aufrecht, Leineweber, Senyshyn and Mittemeijer5
In an attempt to improve the facture toughness of Cr2Nb, extensive efforts have been undertaken and the addition of second phase toughening may be a promising method.Reference Xue, Li, Zhong and Fu6–Reference Lu, Zheng, Deng and Yao8 For instance, in a binary Cr–Nb system,Reference Li, Li, Xue and Fu7 dual-phase alloys have been developed by exploiting an eutectic reaction where a great increment of fracture toughness was realized. Nevertheless, meeting the requirement of engineering application needs much effort, since the solid solution phase introduced was not ductile enough to toughen the brittle Cr2Nb.Reference Xiao, Lu, Hu, Huang, Nie and Fu9,Reference Davidson and Chan10
In addition, it was found that, with the addition Ti from 28 to 42 at.%, the toughness of the ductile phase and thereby the fracture toughness of dual-phase alloys can be improved significantly.Reference Davidson, Chan and Anton11–Reference Chan and Davidson13 For example, the improved facture toughness can reach 20 MPa m1/2 for the alloy alloyed with 30 at.% Ti. The increase of fracture toughness was related closely to the reduction of d + s electron numbers by Ti addition. However, two problems were then arose by the participation of Ti in the alloys. Firstly, the volume fraction of Cr2Nb was reduced evidently by the decrease of the Cr content, which was harmful to the excellent high-temperature properties of Cr2Nb.Reference Kazantzis, Aindow, Jones, Triantafyllidis and Hosson14 Secondly, the change of microstructures was apparent, which was vital for the propagation of cracks sensitive to the morphology of microstructures.Reference Kim, Tanaka, Kasama and Hanada15
To control the solidified microstructures and mechanical properties of the alloys, a directional solidification technique has been proven to be an effective method. In directional solidification, well-aligned regular microstructures were produced and available for improving the fracture toughness of Nb–Si based superalloys.Reference Nie, Ding, Chen, Guo and Fu16–Reference Cheng and He18 However, directional solidification has not been reported in the Cr–Nb–Ti alloy, because element Ti is very active and can react with ceramic molds. In this study, we used the coating technique to inhibit the reaction of element Ti with the ceramic molds. Meanwhile, as for ternary Cr–Nb–Ti system, the phase selection and solidification behavior involving the Laves-phase, eutectic and Ti-phase are still unclear. This can be studied by preserving the solid/liquid (S/L) interfaces during the steady-state directional solidification. In addition, the variation of mechanical properties with the evolution of microstructures was discussed particularly by observing the crack routes and facture surfaces.
II. EXPERIMENT
Alloy with nominal composition of Cr–20Nb–40Ti (at.%) was prepared preliminary by vacuum non-consumable arc melting under a titanium-gettered argon atmosphere. The high-purities of 99.90 wt% Cr, 99.99 wt% Nb, and 99.95 wt% Ti were adopted to avoid impurity contamination (hereafter, all compositions in this paper are given in at.% unless otherwise stated). Every ingot was remelted for five times to ensure chemical homogeneity. Rod ingots with dimensions of Φ 6.9 mm × 70 mm were cut by electro-discharge-machining (EDM) for directional solidification. The mold Al2O3, coated with Y2O3 on the interior surface, and with dimensions of Φ 7 mm × 110 mm, was used for directional solidification.
Directional solidification was performed by using a vertical Bridgman furnace. A furnace chamber was heated once a vacuum pressure of 3.0 × 10⁻³ Pa was obtained. When temperature reached 1000 °C, high-purity argon (99.99 wt%) was filled into the furnace chamber to avoid oxidation. After duration time of 10 min at about 1800 °C, directional solidification was conducted by withdrawal rates of 5, 20, 100, and 200 μm/s, respectively. When withdrawal length reached 60 mm, the alloy was pulled into a liquid Ga–Sn–In pool to obtain the S/L interface.
The ingots prepared by different withdrawal rates displayed with quite smooth surfaces indicate that the coating Y2O3 was effective in inhibiting the reaction of melt with Al2O3 molds. Actually, the coating technique of Y2O3, combined with the method of directional solidification, has been used successfully in the Nb–Si based alloys with a large amount of the Ti content.Reference Su, Jia, Feng, Zhang, Yuan and Zhang17
The specimens for compression testing, with dimensions of Φ 5 mm × 10 mm, were cut by EDM along the growth direction of the directionally solidified ingots. The compression tests were performed on an Instron-3382 universal test machine (Instron, New York, New York) with a compression speed of 0.1 mm/min. For every ingot of directional solidification, three specimens were tested to value the Young's modulus (E) and yield strength (σS) of the alloy.
The evaluations of microhardness and fracture toughness for the directionally solidified alloys were conducted by using a microhardness tester with a Vickers intender (Duramin-A300; Struers Ltd., Tokyo, Japan). A load of 10 N and duration time of 10 s was used for microhardness measurements, while a load of 200 N and duration time of 15 s was used for evaluation of fracture toughness. For every test, ten data were conducted and an average value was adopted.
The microhardness (H V) can be obtained from the residual projected diagonal impressionReference Fujita, Kaneno and Takasuigi19:
 $${H_{\rm{V}}} = {{1.854P} \mathord{\left/ {\vphantom {{1.854P} {{d^2}}}} \right. \kern-\nulldelimiterspace} {{d^2}}}\quad ,$$
where P is the test load (N); d is the mean diagonal length of the indentation (mm).
The fracture toughness (K IC) can be calculated by an Anstis's modeReference Fujita, Kaneno and Takasuigi19:
 $${K_{{\rm{IC}}}} = 0.016{\left( {{E \mathord{\left/ {\vphantom {E {{H_{\rm{V}}}}}} \right. \kern-\nulldelimiterspace} {{H_{\rm{V}}}}}} \right)^{1/2}}\left( {{{{P \mathord{\left/ {\vphantom {P C}} \right. \kern-\nulldelimiterspace} C}}^{3/2}}} \right)\quad ,$$
where E is the Young's modulus (GPa) from the stress–strain curve of the compression test; H V is the Vickers microhardness (GPa); P is the test load (N); and C is the average length of four surface radial cracks (mm).
The transverse and longitudinal sections, accompanying the S/L interfaces, were cut by EDM from the directionally solidified alloys. Subsequently, these samples were polished and etched by a solution of 50 mL H2O, 25 mL HF, 25 mL H2SO4, and 4 mL HNO3 for approximately 5 s. Characterization tests of the microstructure were performed by x-ray diffraction (XRD, D/max2200pc, Cu Kα; Akishima, Tokyo, Japan), an optical microscope (OM, Leica DM4000M; Wetzlar, Hessen, Germany), and an scanning electron microscope (SEM, JSM-6390A; Kariya, Aichi, Japan) equipped with an energy dispersive x-ray spectroscope (EDS, INCAPentaEFTx3; Oxford Instruments, Oxfordshire, UK).
III. RESULTS AND DISCUSSION
A. Enhancement of the plane (220)
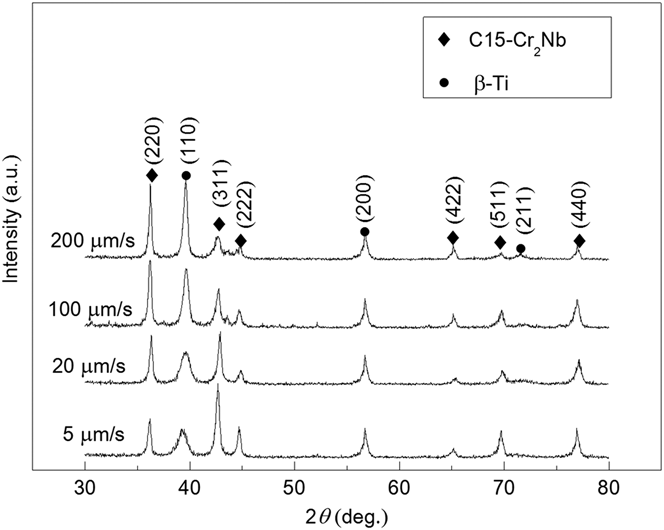
Figure 1 shows the XRD patterns of the transverse sections of the directionally solidified Cr–20Nb–40Ti alloy at various growth rates. All microstructures consisted of Laves phase C15–Cr2Nb and solid solution phase β-Ti. Apparently, the growth planes of C15–Cr2Nb depended on the growth rate. At the growth rate of 5 μm/s, the plane (311) formed primarily. While at 20 and 100 μm/s, the intensity of plane (311) was reduced, and the intensity of plane (220) was enhanced. When the growth rate reached 200 μm/s, at the cost of further reduction of plane (311), the plane (220) became dominant in the directionally solidified Cr–20Nb–40Ti alloy.
XRD patterns of the transverse sections of the directionally solidified Cr–20Nb–40Ti alloy at growth rates of 5, 20, 100, and 200 μm/s.

The plane (220) of Cr2Nb was developed not only in this study, but also in the binary Cr–Nb system.Reference Shah, Anton, Pope and Chin20 Similarly, the reinforcement of plane (220) of Fe2RE, as another Laves phase, was also achieved in the directionally solidified Tb–Dy–Fe alloy.Reference Ji, Li, Ma and Zhou21 It is suggested that the plane (220) of Laves-phase Cr2Nb may be the primarily grown plane in the directional solidification of Laves phase based alloys.
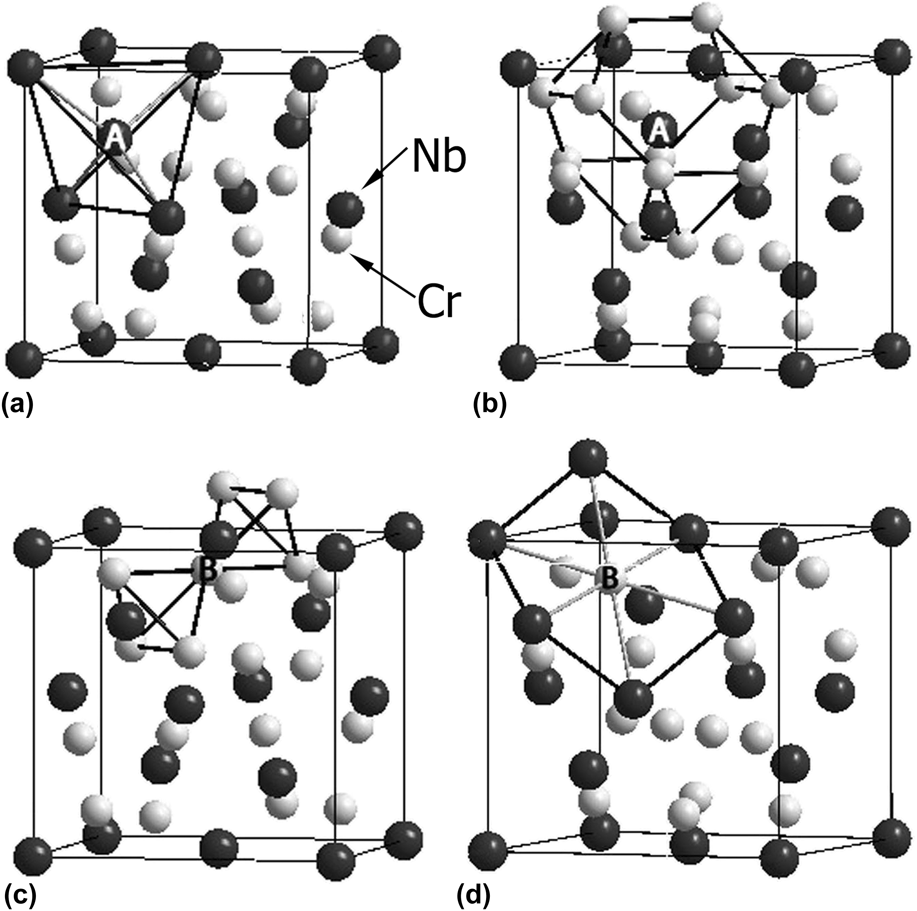
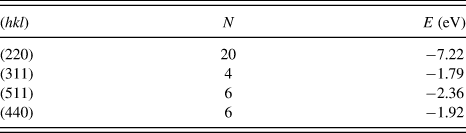
The enhancement of plane (220), not the plane (311), (511), or any others, is unclear. We conducted the analysis of the crystal structure of C15–Cr2Nb as shown in Fig. 2. It shows that, for atom Nb (signed as A) within a unit of Cr2Nb, its Nb and Cr coordination numbers are 4 and 12, respectively [Figs. 2(a) and 2(b)]; and for atom Cr (signed as B), its Nb and Cr coordination numbers are equal to be 6 [Figs. 2(c) and 2(d)]. Considering the nearest Cr–Cr, Cr–Nb, and Nb–Nb bonds, the bare bonding number (N) of a plane (hkl) can be figured out. When further combining the energies of Cr–Cr, Cr–Nb, and Nb–Nb bonding simulated from the molecular dynamic technique,Reference Trebin and Gumbsch22 the bare bonding energy (E) of a plane can be evaluated.
Coordination numbers of Nb and Cr (signed as A and B, respectively) within a unit of C15–Cr2Nb: (a) the Nb coordination number of A, (b) the Cr coordination number of A, (c) the Nb coordination number of B, and (d) the Cr coordination number of B.
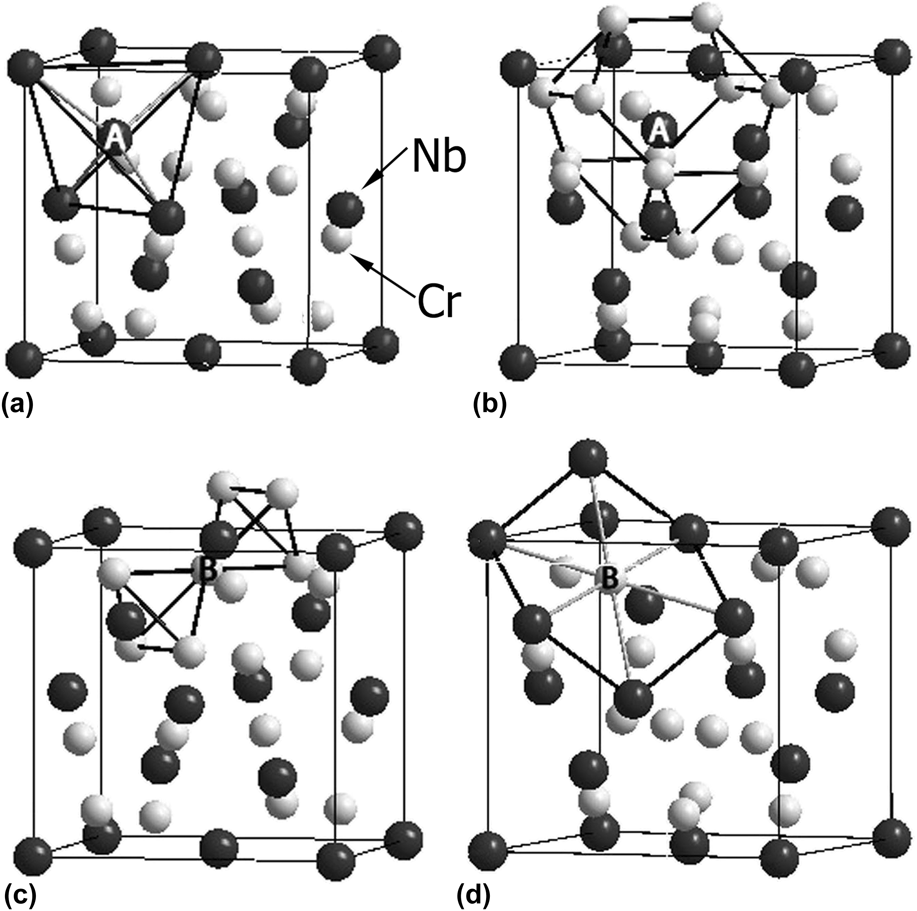
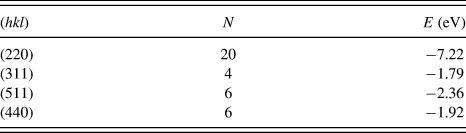
Table I lists the results of bare bonding numbers/energies of several planes emerged in Fig. 1. Evident difference was observed between the plane (220) and the planes (311), (511), and (440). As for the latter planes (311), (511), and (440), their bare bonding numbers fluctuate at 5, far lower than 20 for the plane (220). Meanwhile, the bare bonding energies of planes (311), (511), and (440) are varied from −1.79 to −2.36 eV, also much lower than −7.22 eV for the plane (220). Therefore, the plane (220) can be developed preferentially because of its favorable growth dynamics, as indicated in Fig. 1.
Bare bonding number (N) and bare bonding energy (E) of a plane (hkl) in Laves phase C15–Cr2Nb.
B. Evolution of microstructures
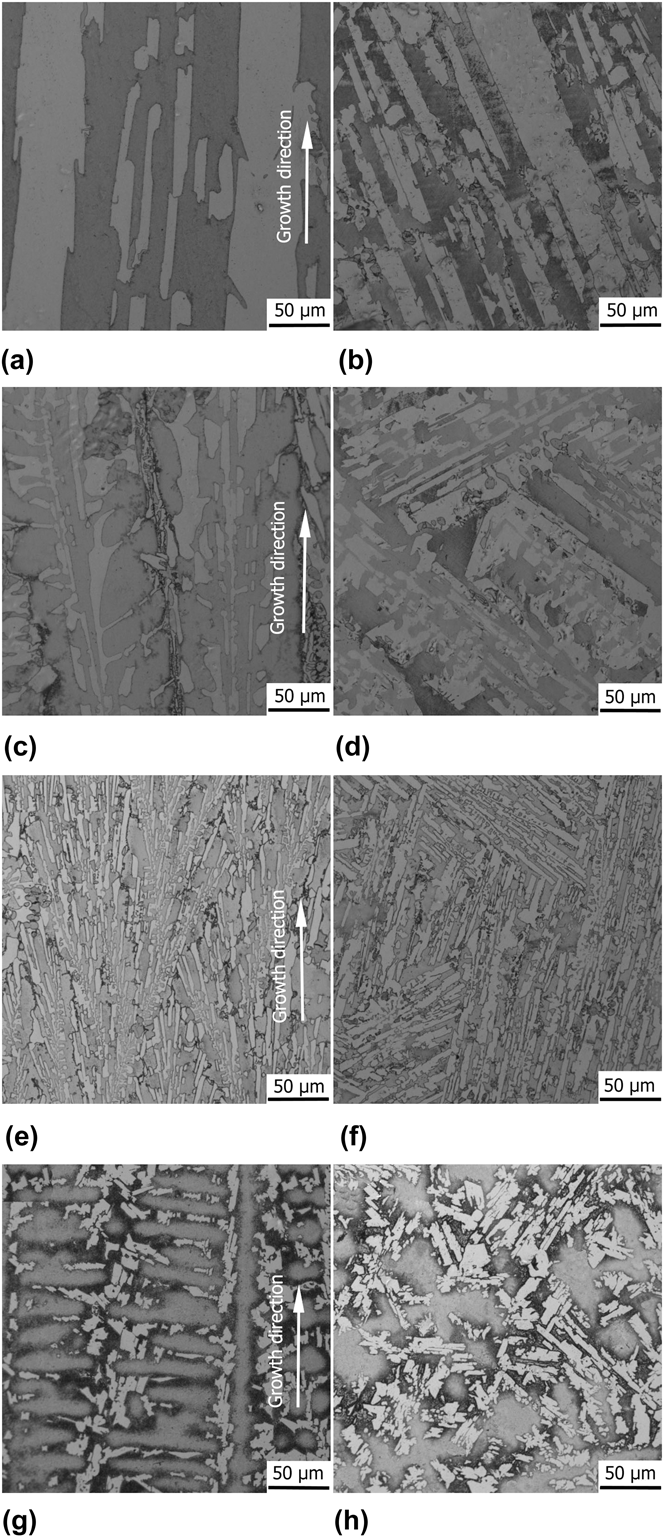
Figure 3 presents the longitudinal and transverse sections of the Cr–20Nb–40Ti alloy directionally solidified at growth rates of 5, 20, 100, and 200 μm/s. All microstructures comprised of white phase Cr2Nb and gray phase β-Ti, in consistent with the results of XRD patterns in Fig. 1. Meanwhile, the microstructures varied significantly with increasing the growth rate. As indicated in Figs. 3(a) and 3(b), the microstructure solidified with lath-like Cr2Nb in between β-Ti at 5 μm/s, while the microstructure transformed to dendrite-like eutectic Cr2Nb/β-Ti at 20 μm/s, with an irregular morphology and coarse size [Figs. 3(c) and 3(d)]. Further, the eutectic was more regular and refined at 100 μm/s [Figs. 3(e) and 3(f)]. Finally, the microstructure evolved into coarse dendrite β-Ti at 200 μm/s, and the Cr2Nb was distributed dispersedly between the dendrites [Figs. 3(g) and 3(h)].
OM images of the longitudinal (left) and transverse (right) sections of the directionally solidified Cr–20Nb–40Ti alloy with growth rates of (a and b) 5 μm/s, (c and d) 20 μm/s, (e and f) 100 μm/s, and (g and h) 200 μm/s.
Note that, some dark contrast was observed at the edge of gray dendrites [Figs. 3(g) and 3(h)]. For identifying the phases, SEM–EDS analysis was conducted as shown in Fig. 4. The map of Nb seen in Fig. 4(b) indicates that Nb segregated preferentially to the center of dendrites, forming the dark contrast at the edges of dendrites in the back-scattered electron (BSE) image shown in Fig. 4(a). The complementary maps of Cr and Ti [Figs. 4(c) and 4(d)] suggest that Cr and Ti segregated to form the Cr2Nb and β-Ti, respectively.
SEM image and maps of Nb, Cr, and Ti in the Cr–20Nb–40Ti alloy processed by the growth rate of 200 μm/s: (a) BSE image, (b) Nb map, (c) Cr map, and (d) Ti map.
The quenched S/L interfaces of the alloy in directional solidification are shown in Fig. 5. Importantly, the growth rate had great effect on the morphology of quenched S/L interfaces. At the growth rate of 5 μm/s, the protruded Cr2Nb phase was aligned uniformly along the growth direction [Fig. 5(a)], inferring that Cr2Nb crystallized firstly from the melt at the beginning of solidification. At 20 and 100 μm/s, the protruded phases transited to dendrite-like eutectic Cr2Nb/β-Ti, and the eutectic reaction prevailed at these solidification rates [Figs. 5(b) and 5(c)]. When the growth rate reached 200 μm/s, the protruded phase evolved to β-Ti [Fig. 5(d)], indicating the solidification of β-Ti ahead of Laves phase Cr2Nb.
OM images of the S/L interfaces of the steady-state directional solidification at various growth rates of (a) 5 μm/s, (b) 20 μm/s, (c) 100 μm/s, and (d) 200 μm/s.
The quenched S/L interfaces matched well with the solidified microstructures of Fig. 3. The phase selection process took place in the directionally solidified Cr–20Nb–40Ti alloy. The phase selection involving the change of microstructures is related closely to the interface growth temperature of solidified phases.Reference Kurz and Fisher23 For the dendrite phase, the interface growth temperature  $\left( {T_{\rm{i}}^{\rm{d}}} \right)$ can be evaluated byReference Kurz and Fisher23:
 $$T_{\rm{i}}^{\rm{d}} = {T_{\rm{L}}} - \Delta {T_{\rm{d}}} = {{GD} \mathord{\left/ {\vphantom {{GD} V}} \right. \kern-\nulldelimiterspace} V} + {K_1}{V^w}\quad ,$$
where  $T_{\rm{i}}^{\rm{d}}$ is the liquidus temperature; ΔT d is the undercooling of dendrite growth; G is the temperature gradient; D is the diffusion coefficient; V is the growth rate; K 1 is a constant and varied with alloy system; w is a constant, valued as 0.5 for faceted phases, and lower than 0.5 for non-faceted phases.
As for the eutectic microstructure, the interface growth temperature  $\left( {T_{\rm{i}}^{\rm{E}}} \right)$ can be calculated byReference Kurz and Fisher23:
 $$T_{\rm{i}}^{\rm{E}} = {T_{\rm{E}}} - \Delta {T_{\rm{E}}} = {K_2}{V^{1/2}}\quad ,$$
where T E is the eutectic temperature; ΔT E is the undercooling of eutectic growth; K 2 is a constant in relationship with the alloy system.
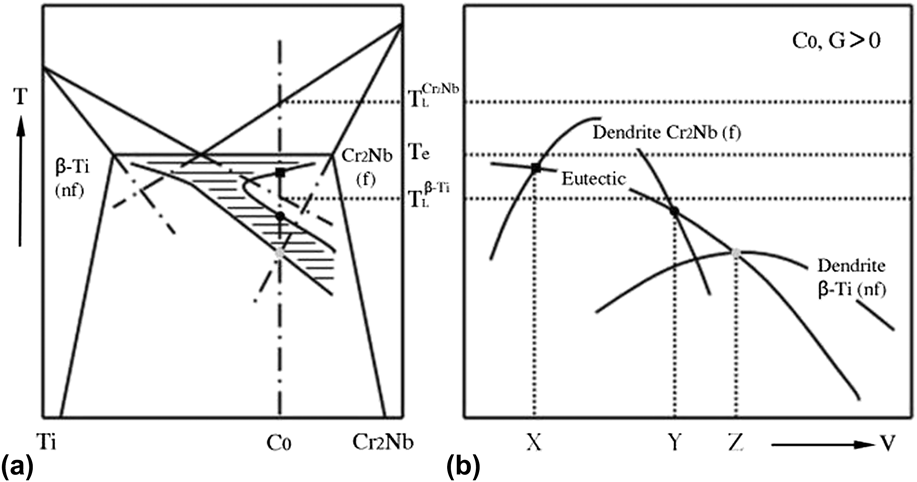
Based on the solidified microstructure of Fig. 3 and the quenched S/L interfaces of Fig. 5, the coupled zone of eutectic [Fig. 6(a)] and the competitive growth of phases [Fig. 6(b)] can be plotted schematically using Eqs. (3) and (4). It indicates that the coupled zone leans to the side of Cr2Nb due to the fact that the growth of faceted phase Cr2Nb needs a relatively large undercooling.Reference Shah, Anton, Pope and Chin20 Then, the solidification sequence can be predicted preliminarily by Fig. 6(b). At the low growth rate from X to Y, the microstructures prefer the crystallization of dendrite Cr2Nb; while at the growth rate above Y but below Z, the alloy develops the solidification of eutectic Cr2Nb/β-Ti; with the growth rate exceeded Z, the dendrite β-Ti appears preferentially in the solidified microstructures. Further, when the growth rate increases continuously and reaches the level of rapid solidification, the metallic glass can be expected to be formed due to the sharp increase of liquid viscosity.Reference Herlach, Galenko and Holland-Moritz24,Reference Wang, Kalay and Trivedi25
Coupled zone of the eutectic and competitive growth of the phases in the Cr–20Nb–40Ti alloy. (a) Coupled zone of the eutectic, (b) competitive growth of the phases.
In this study, the growth rate is not too large and at the level of μm/s, much lower than that of rapid solidification. Thus, the metallic glass is hard to be formed while the evolution from the dendrite Cr2Nb, via the eutectic Cr2Nb/β-Ti, and to the dendrite β-Ti, is consistent very well with the prediction from Fig. 6. The problem is that precise calculation of coupled zone is difficult due to the absence of relevant parameters of K 1, K 2 and w for the ternary Cr–Nb–Ti system.
C. Mechanical properties
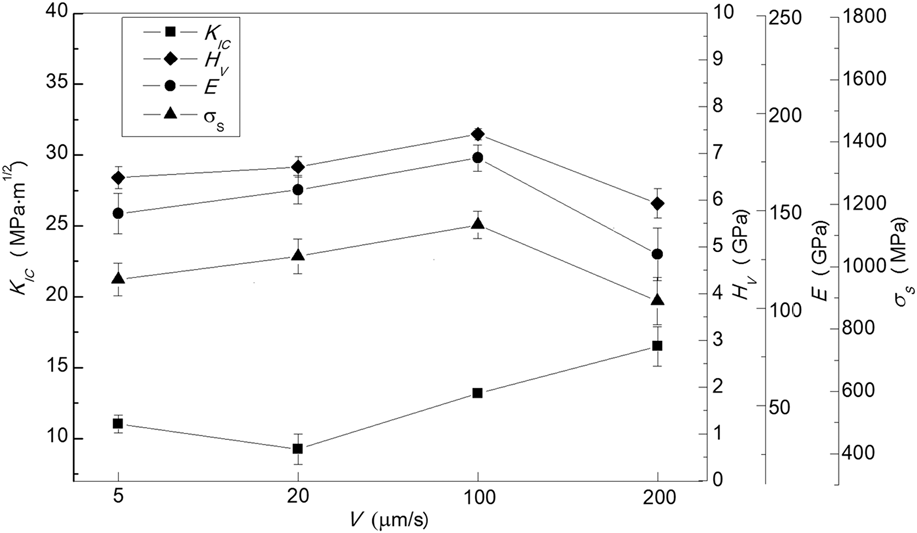
The mechanical properties of the Cr–20Nb–40Ti alloy prepared by various growth rates are shown in Fig. 7. It shows that the evolutions of Young's modulus, microhardness, and yield strength display similar trends, while the variation of fracture toughness exhibits a little deviation.
Effect of the growth rate on the fracture toughness, microhardness, Young's modulus, and yield strength of the Cr–20Nb–40Ti alloy.

For Young's modulus, its mean value varied from 121 to 169 GPa. Similarly, for yield strength and microhardness, their average values varied from 886 to 1124 MPa and from 5.91 to 7.42 GPa, respectively. These three mechanical properties are on the same levels as the reported studies,Reference Davidson, Chan and Anton11,Reference Takeyama and Liu26 and their variations are related closely to the alteration of microstructures seen in Fig. 3. With the increase of growth rates from 5 to 100 μm/s, the refinement of the grain size was evident, and thus the effect of fine-grain strengthening can be functional. While at 200 μm/s, the ductile β-Ti dendrite was solidified, leading to the reduction of strength properties.
However, as for fracture toughness, its mean value increased continuously from 11.04 to 16.50 MPa m1/2, with a slight drop at 20 μm/s. The improved fracture toughness was quite larger than 1.40 MPa m1/2 for single-phase Cr2Nb.Reference Takeyama and Liu26 Here, the propagations of crack were produced for analysis as shown in Fig. 8.
Propagations of crack in the directionally solidified Cr–20Nb–40Ti alloy with growth rates of (a) 5 μm/s, (b) 20 μm/s, (c) 100 μm/s, and (d) 200 μm/s.
At the growth rate of 5 μm/s, the crack propagation was quite straight [Fig. 8(a)], reflecting poor facture resistance of the lath-like Cr2Nb alternating with β-Ti. In contrast, the length of crack propagation was reduced evidently by the formation of eutectic at 100 μm/s [Fig. 8(c)], and thus the facture toughness was improved due to the increase of facture resistance.
Generally, the increase of facture resistance at 100 μm/s can be generated from three aspects. Firstly, the grain size at 100 μm/s was reduced significantly, so the effect of fine-grain toughening can be predominant. Secondly, the amount of interfaces at 100 μm/s increased greatly, being helpful for preventing the crack.Reference Sekido, Kimura, Miura, Wei and Mishima27 Thirdly, the interfaces at 100 μm/s were obtained through the eutectic reaction, as the thermodynamically stable interfaces, being in favor of arresting the crack.Reference Lee, Liaw, Liu and Chou28
While the crack propagation at 20 μm/s [Fig. 8(b)] was not inhibited sufficiently, the eutectic prevailed in the solidified microstructure. This was mainly attributed to the irregular morphology of eutectic. A regularly well-aligned lamellar morphology was desirable since crack did not have continuous access to the brittle matrix.Reference Bhowmik and Stone29
Further, when growth rate reached 200 μm/s, the trace of crack propagation was quite rare [Fig. 8(d)], indicating prominent trapping effect generated from the microstructure. The main reason was that the ductile β-Ti became the matrix of the solidified microstructure. Moreover, the ductile β-Ti had a comparably large size, being in favor of arresting the cracks.Reference Choe, Schneibel and Ritchie30,Reference Li and Peng31
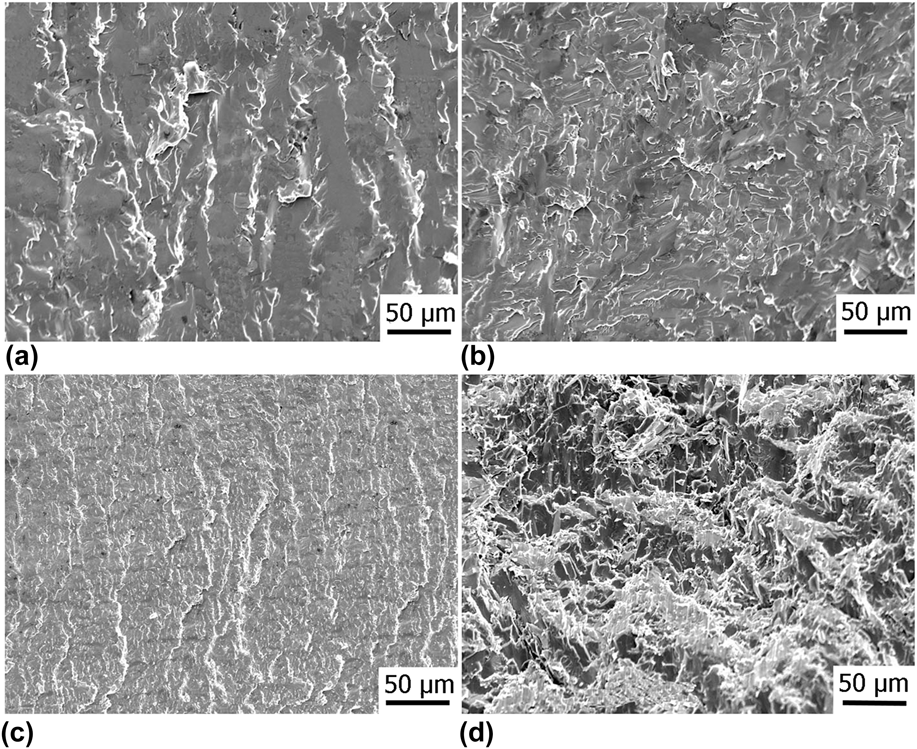
For further analysis, the facture surfaces at various growth rates were obtained as seen in Fig. 9. At the growth rate of 5 μm/s, the deformation ridges were really few, and the morphology of the facture surface was quite smooth [Fig. 9(a)]. This is consistent with the brittle nature of the alloy at this growth rate. In contrast, when the growth rate increased to 20 μm/s, the facture surface was still smooth, the amount of deformation ridges increased obviously [Fig. 9(b)], which is beneficial to the improved mechanical properties.Reference Li and Peng31
Fracture surfaces of the Cr–20Nb–40Ti alloy fabricated by growth rates of (a) 5 μm/s, (b) 20 μm/s, (c) 100 μm/s, and (d) 200 μm/s.
With the increase of growth rate, the amount of deformation ridges increased remarkably at 100 μm/s [Fig. 9(c)], and the effect of fine-grain toughening prevailed. Finally, at 200 μm/s, due to the formation of dendrite β-Ti with the coarse size, the plastic deformation became evident, and the facture surface was roughened with a great degree [Fig. 9(d)]. This accounts for further improved facture toughness at 200 μm/s as shown in Fig. 7.
Clearly, with the addition Ti in the binary Cr–Nb system, the facture toughness of Cr2Nb based alloys was improved significantly and reached 16.50 MPa m1/2, while the volume fraction of Cr2Nb was comparably low. Especially at the growth rate of 200 μm/s, the matrix β-Ti has been developed, which may be harmful to the preservation of excellent high-temperature properties of Cr2Nb, such as high-temperature strength and creep resistance.Reference Lu, Zheng, Deng and Yao8
Therefore, the optimization of alloy composition seems to be necessary for balancing the volume fraction of Cr2Nb and the fracture toughness of ternary Cr–Nb–Ti alloys. Meanwhile, the growth rate in this study was not too large, and thus the effect of fine-grain strengthening and toughening was limited. So, further increase of the growth rate will be meaningful.
IV. CONCLUSIONS
The ternary Cr–20Nb–40Ti alloy was manufactured successfully by the combination of the coating technique and directional solidification at various growth rates. The evolution of microstructures was analyzed and the variation of mechanical properties was discussed for developing alloys with good combination of mechanical properties. The following conclusions can be drawn:
(1) With the increase of the growth rate, the favorable growth dynamics of plane (220) of Laves phase Cr2Nb prevailed in the directional solidification of Cr–20Nb–40Ti alloy.
(2) Phase selection took place in the directionally solidified microstructures that evolved from the primary Cr2Nb, via the eutectic Cr2Nb/β-Ti, and finally to the primary β-Ti, as the growth rate increased from 5 to 200 μm/s. The competitive growth of solidified phases in the directionally solidified alloy was explained based on the coupled zone of eutectic.
(3) With the variation of the growth rate from 5 to 200 μm/s, the fracture toughness of Cr–20Nb–40Ti alloy increased from 11.04 to 16.50 MPa m1/2. The improved fracture toughness was much larger than 1.40 MPa m1/2 for single-phase Cr2Nb, indicating that the addition Ti was effective in toughening the Cr2Nb alloy.
ACKNOWLEDGMENTS
This work was supported by the National Natural Science Foundation of China (No. 51074127), the Fundamental Research Funds for the Central Universities (No. 3102014JCQ01021), and the Fund of the State Key Laboratory of Solidification Processing in NWPU (No. SKLSP201507).