Introduction
There exists, at present, no simple and reliable method for quantifying urinary output by ruminants in the field. One potential application of such a technique would be the estimation of the excretion of purine derivatives (PD) in urine, as has been recently used for determining microbial crude protein (MCP) flow to the small intestines in ruminants (Chen et al., Reference Chen, Hovell, Orskov and Brown1990; Verbic et al., Reference Verbic, Chen, MacLeod and Ørskov1990; Chen and Gomes, Reference Chen and Gomes1995). This purine excretion method has advantages over the marker techniques traditionally used to estimate MCP synthesis due to its simplicity and deployment of non-invasive sampling techniques with non-fistulated animals. There are advantages in studying the nutrition and MCP production of the free ranging animal as it selects a diet of higher quality than that obtained by feeding freshly cut forage to housed animals (Corbett, Reference Corbett1976), and in the study of more extensive, tropical grass-based systems there is no alternative but to study the free ranging animal.
Techniques have been proposed for the estimation of total urine output from free-grazing ruminants, in particular the use of the natural metabolic waste product, creatinine, as an internal urinary output marker (Chen et al., Reference Chen, Susmel, Stefanon and Ørskov1995). However, the underlying assumption that creatinine is excreted at a rate in constant proportion to body weight has been challenged, with Faichney et al. (Reference Faichney, Welch and Brown1995) finding creatinine excretion to vary considerably between individuals and with diet type.
The use of an external marker that is quantitatively excreted in the urine would allow estimation of total urine output from the collection of spot urine samples. Chromium complexed with ethylenediamine tetra-acetic acid (CrEDTA; Downes and McDonald, Reference Downes and McDonald1964; Stacy and Thorburn, Reference Stacy and Thorburn1966) and lithium salts (Suharyono, Reference Suharyono1992; Dixon et al., Reference Dixon, Smith and Reid2003) have been investigated for suitability as markers to examine such factors as the rate of flow and volume of rumen fluid, and the intake of supplements, by ruminants. The application of these substances as intravenously administered markers for estimating urine output in grazing ruminants requires knowledge of the recovery of the marker in the urine and of the diurnal variation in marker concentration, or the metabolite : marker ratio, in the urine. Siebert et al. (1978) assumed 100% recovery of intravenously infused CrEDTA and the urine outputs estimated from Cr concentration in total urine collection or in drawn-off urine samples were not significantly different from the direct measurement. The present paper describes a series of experiments carried out to determine the urinary recovery of intravenously infused CrEDTA and lithium sulphate, and diurnal variation in the ratio of PD : Cr, using non-radioactive forms of these markers. A brief report including some aspects of these experiments has appeared elsewhere (Bowen et al., Reference Bowen, McCosker, McLennan and Poppi2003).
Material and methods
General infusion procedures
CrEDTA and lithium sulphate were infused into the jugular vein of the cattle via an in-dwelling catheter. Catheters were made from a length (ca. 2.5 m) of polyethylene tubing (i.d. 0.80 mm, o.d. 1.20 mm) and inserted, under sedation of the cattle, about 30 cm into the jugular vein. The catheter line was flushed with heparin-saline solution (200 IU/ml) and a sterile injection port inserted as a temporary stopper until required, usually within 24 h.
Marker solutions were prepared by injecting 10 ml of concentrated CrEDTA solution (12 mg Cr/ml) and 10 ml of lithium sulphate solution (14 mg Li/ml) through single-use Millex syringe filters (0.22 μm) into a bag containing 500 ml of isotonic saline solution (0.9% sodium chloride) and mixing thoroughly. This marker solution was connected to the catheter tubing and dispensed via a battery-operated peristaltic pump. The saline solution alone was infused for 24 h prior to inclusion of the markers. The marker solution was infused continuously over 6–7 days at a rate of 16.5–20.5 ml/h. Infusion bags were replaced each morning during the infusion period. The pump was either suspended above metabolism crates (Experiments 1 and 2) or contained in backpacks worn by the steers (Experiments 3 and 4). No problems were experienced with the health of the animals. All experiments were approved by the University of Queensland or the Department of Primary Industries and Fisheries, Queensland, Animal Ethics Committees.
Experiment 1. Metabolism study: recovery of infused Cr in the urine
Three Brahman (>75% Bos indicus) steers with a liveweight of 342 ± 21.6 kg were used. The diet consisted of 85% (w/w, as fed) commercial feedlot pellet (Betterblend Beef Expandat Pellet®; Betterblend Stockfeeds, Oakey, Australia) and 15% pangola grass (Digitaria eriantha ssp. pentzii) chaff and was offered at 20 g/kg steer liveweight (W) per day (on an as-fed basis), which was less than ad libitum intake. The composition of the commercial feedlot pellet on an as-fed basis was 744 g/kg barley, 103 g/kg wheat, 73 g/kg cottonseed meal, 52 g/kg molasses, 10 g/kg urea, 8.5 g/kg limestone, 3.9 g/kg sodium bicarbonate, 3.6 g/kg salt, 1.2 g/kg ammonium sulphate, 1.0 g/kg premix and 0.74 g/kg Rumensin® (Elanco). The chemical composition of the pellet, on an as-fed basis (g/kg), was 895 dry matter (DM), 147 crude protein (CP) and 62 crude fibre. On a DM basis (g/kg), pangola grass hay had 921 organic matter (OM), 74 CP and 716 ash-free neutral detergent fibre (NDF) and was 883 g DM/kg as fed hay. The diet was fed once daily at 0930 h and water was provided ad libitum. The experiment consisted of a 20-day preliminary feeding period in individual, concrete-floor pens followed by an 11-day sampling period in metabolism crates, which comprised a 2-day adjustment, 7-day infusion and 2-day post-infusion period. The steers were catheterised in the jugular vein and CrEDTA solution (255 mg Cr/l) was infused continuously at a rate of ca. 111 mg Cr/day.
Individual feed intake was recorded over the 11-day period in the metabolism crates. DM concentration was determined every second day for the feed offered and daily for feed residues. During the infusion period, total faecal output was recorded daily for each steer and a daily subsample (5% of total) bulked and stored frozen. At the end of the collection period each bulk sample was thawed, mixed thoroughly and two subsamples were retained. One sample was dried to constant weight at 60°C and DM concentration determined; the other was freeze-dried and stored awaiting Cr analysis. Total urine output by the steers was determined daily over the last 9 days in the metabolism crates by collection into bins containing sufficient 20% sulphuric acid to maintain the final pH of urine below 3. Subsamples of the urine were taken daily for each steer and frozen, undiluted, awaiting Cr analysis.
Experiment 2. Metabolism study: recovery of infused Cr and Li in the urine
Six Charbray (>75% B. indicus × B. taurus) steers (219 ± 10.0 kg) were used in a crossover design comprising two treatment diets and two experimental runs. For the first run, three steers were allocated to each diet by stratified randomisation on the basis of unfasted liveweight and the diets were reversed in the second run. The diets were lucerne (Medicago sativa) hay or a low-quality, native tropical grass pasture hay consisting of a mixture of predominantly black speargrass (Heteropogon contortus) with some forest bluegrass (Bothriochloa bladhii). For each experimental run, a 14-day preliminary feeding period in individual, concrete-floor pens preceded a 2-day adjustment period and 7-day infusion period in metabolism crates. The steers were fed ad libitum during the preliminary period and then restricted to 90% of ad libitum intake during the marker infusion and sampling period. The hay was offered once daily at 0800 h and water was provided ad libitum. The steers were catheterised in the jugular vein and infusions carried out as described above. The infusion solution contained 263 mg Cr and 241 mg Li/l and delivered 107 mg Cr and 98 mg Li/day to the steers.
Feed intake was measured during the 9-day period in metabolism crates and total urine and faecal output was measured daily during the 7 days of marker infusion, as described for Experiment 1 except that the urine was not acidified. Subsampling of the faeces and urine was carried out as described for Experiment 1. During the first run, spot urine samples for PD and Cr analysis were taken over days 3–7 of the infusion period from three animals offered native pasture hay and two animals offered lucerne hay by replacing the urine collection bins with clean bins at the designated sampling times. The times of sampling, randomly allocated between days, were ca. 0130, 0400, 0630, 0800, 1030, 1300, 1530, 1800, 2030 and 2300 h. On any 1 day, the two sampling periods were separated by at least 9 h. Urine subsamples for PD analysis were immediately diluted 1 in 10 with 0.1 M ammonium phosphate (NH4H2PO4) buffer. The buffered subsamples were frozen prior to analysis for PD concentrations. Urine spot samples for Cr analysis were processed in the same manner as for the bulk urine samples. Spot faecal samples were also taken from each steer per rectum after 6 days of infusion, and these were processed in the same manner as the bulk faecal samples kept for Cr and Li analysis.
Experiment 3. Grazing study: transfer of Cr and Li to the rumen fluid
Eight rumen-fistulated (RF) Brahman (>75% B. indicus) steers (375 ± 7.4 kg) grazing a native tropical grass pasture consisting of predominantly H. contortus and B. bladhii, during the dry winter season (July; NPD), were used in the experiment. This experiment was part of a larger experiment (Experiment 4) described below. Water was available ad libitum in a single paddock water trough. The steers were catheterised in the jugular vein and infused continuously for 6 days with solutions containing CrEDTA and lithium sulphate, as described earlier. The Cr and Li marker concentrations and the infusion rates were 278 mg Cr/l, 117 mg Cr/day; 284 mg Li/l, 120 mg Li/day, respectively. Samples of rumen fluid were taken from each of the eight steers on day 2 (0800 h) and day 6 (1800 h) of the infusion period for determination of Cr and Li concentration. Rumen fluid was collected from at least three different sites in the rumen of each steer and 10 ml subsamples frozen prior to analysis.
Experiment 4. Grazing study: diurnal variation in the ratio of PD : Cr in the urine
This experiment was part of a larger study (Bowen, Reference Bowen2003) and only aspects relevant to diurnal variations in urinary metabolites are presented here. Six to eight RF Brahman (>75% B. indicus) steers grazed seven pasture types in succession over a 12-month period. At the beginning, the steers were ca. 15 months of age with an average liveweight of 329 ± 10.8 kg. By the final pasture run, the steers were ca. 27 months of age and averaged 471 ± 10.6 kg liveweight. The seven pasture types were native tropical grasses (major species H. contortus and B. bladhii) grazed in the (i) early-wet season (NPEW), (ii) wet/dry transitional period (NPT) and (iii) dry season (NPD); (iv) creeping bluegrass (B. insculpta cv. Bisset), an introduced tropical grass, grazed in the mid-wet season (BB); the introduced tropical legumes (v) Dolichos lablab (Lablab purpureus cv. Highworth; LL) and (vi) butterfly pea (Clitoria ternatea cv. Milgarra; BP); and (vii) annual ryegrass (Lolium multiflorum cv. Tetila; RG), a temperate grass. The pastures were studied sequentially, as determined by rainfall and their seasonal availability. In each experiment, water was available ad libitum in a single paddock water trough.
The RF steers grazed each pasture type for at least 2 weeks prior to jugular catheterisation and were then infused for 6 days with CrEDTA solution. The infusion procedures were as described above. The average concentrations of the infusion solutions for each pasture run, in order of completion, were as follows: NPT: 1086 mg Cr/l; LL: 511 mg Cr/l; RG: 518 mg Cr/l; BP: 494 mg Cr/l; NPEW: 292 mg Cr/l; NPD: 278 mg Cr/l and BB: 293 mg Cr/l. A high Cr concentration in the infusate was used in the first pasture run (NPT) but this was twice reduced for following pasture runs when it was found that the Cr concentration in the urine was well in excess of that required for analytical detection. The steers were brought into yards twice a day and spot samples of urine were collected directly from the steers, during urination, over the final 5 days of infusion. The times of sampling were the same as that described for spot urine samples collected in Experiment 2. In some cases it was not possible to collect a urine sample from each steer at the designated sampling time. This was due in some cases to the low urine output and infrequent urination, e.g. with NPD, and in other instances due to difficulties in maintaining continuity of the Cr infusions.
The urine samples for NPT were acidified but samples for the other pasture runs were not acidified because the addition of acid to urine of steers grazing NPT caused precipitation of a large amount of an unidentified crystal, which may be hippuric acid (Lowry et al., Reference Lowry, Sumpter, McSweeney, Schlink and Bowden1993). This contained a significant amount of nitrogen (N) but did not appear to interfere with PD concentration based on analysis of samples with and without acid. Urine subsamples for Cr and PD analysis were processed as described for Experiments 1 and 2, respectively. The effects of the CrEDTA in urine on PD concentrations were examined in a bench-top study. The liveweight of RF steers was recorded just prior to each infusion period.
Two to four oesophageal-fistulated Brahman (>75% B. indicus) steers also grazed each pasture type concurrently with the RF steers. The steers were ca. 5 years of age and 599 ± 27.3 kg liveweight at the commencement of experimentation. After a minimum of 6 days of preliminary grazing on the treatment paddock, extrusa samples were collected from the oesophageal-fistulated steers at least twice, often on consecutive days, during the infusion period for the RF steers. Extrusa samples were mixed thoroughly, then placed directly onto dry ice and later frozen. Subsamples were freeze-dried prior to analyses.
Analytical procedures
DM was determined by drying to a constant weight at 60–70°C in a forced draught oven. The samples were milled to <1 mm prior to chemical analyses. Residual DM was determined on the milled samples by heating to constant weight at 105°C under an atmosphere of N using an automated LECO thermogravimetric analyser TGA-601 (LECO Corporation, St Joseph, MI, USA). The ash concentration was determined by further heating the dry samples in the thermogravimetric analyser at 610°C to constant weight under an atmosphere of oxygen. Hay and extrusa samples were analysed for total N concentration by a combustion method (Sweeney, Reference Sweeney1989) using an Elementar RapidN combustion analyser (Elementar Analysensysteme GmbH, Germany). Ash-free NDF and ash-free acid detergent fibre (ADF) were determined using a Fibertec 2021 Fibercap system developed by Foss Tecator (2002a and 2002b).
Urine samples were analysed for Cr and Li concentration using a Finnegan inductively coupled plasma mass spectrometer. Samples were first deproteinised by diluting 1 ml of sample with 4 ml of 6% trichloracetic acid. Further dilution with distilled water was sometimes required before samples were directly aspirated into the instrument. Rumen fluid samples and faecal samples were analysed for Cr and Li using a Varian 220FS atomic absorption spectrometer with an air acetylene flame where the limits of detection (determined as 3 × the absorbance of the background sample) and reporting (determined as 3 × the limit of detection) were 0.10 and 0.30 mg/l, respectively, for Cr and 0.07 and 0.21 mg/l, respectively, for Li. Rumen fluid samples were centrifuged (2600 × g for 10 min) prior to analysis. The faecal samples were prepared for analysis by ashing (500°C for 8 h) in a muffle furnace followed by an acid digest using nitric and hydrochloric acids and potassium chloride. The acid digests were centrifuged (1100 × g for 10 min) prior to analysis. Background matrices in urine, rumen fluid and faeces were measured in spot samples taken immediately prior to commencement of each infusion run, and these were used in standard curve preparation for Cr and Li analysis.
Acidified and/or buffered urine samples were thawed, filtered (0.2 μm Alltech cellulose nitrate or acetate membrane filter followed by a C18 300 mg filter) and analysed for PD using an HPLC (Waters model 600 E; Waters, Division of Millipore, USA) according to the method outlined by Balcells et al. (Reference Balcells, Guada and Pieró1992).
Calculations
The recovery of intravenously infused Cr and Li in the urine of individual steers in Experiments 1 and 2 was determined as the average of the daily Cr or Li recovery values over the final 6 days of the 7-day infusion period, thereby allowing for equilibration of marker concentration on the first day. Daily Cr recovery over 24 h was calculated as follows:

Urine output in Experiments 2 and 4 was estimated from Cr concentration in spot urine samples, with adjustment for 90% Cr recovery in urine, as follows:
Urine output (l/day) = Cr excretion (mg/day)/Cr concentration in urine (mg/l), where Cr excretion (mg/day) = Cr infusion (mg/day) × 0.90.
In Experiments 2 and 4 the ratio of the concentrations of PD and Cr (PD : Cr) was determined for each spot sample of urine. This ratio for individual samples for each steer was expressed as a proportion of the mean value of all samples, across times, for that individual steer. These proportional values were then averaged, across steers, within sampling times to provide a mean value and a range across sampling times and thus an indication of the diurnal variation in PD : Cr.
Statistical analyses
The statistical package, Genstat for Windows, 6th edition (Genstat Committee, 2000), was used for the analyses. Treatment means in Experiment 2 were subjected to analysis of variance to assess the effect of run, steer and treatment. In Experiment 2, the infusion line for one steer receiving the lucerne treatment in Run 1 was unable to be maintained. The missing value for average recovery of Cr and Li was estimated in these analyses and the standard errors of the means for the lucerne treatment have been adjusted for the reduced number of observations for this treatment. To assess whether Cr and Li recoveries were constant over the final 6 days of the 7-day infusion period in Experiment 2, these data were analysed by repeated measures analysis of variance, separately, for each run. Pair-wise differences between days in Experiment 2 were tested using the protected least significant difference procedure (P = 0.05). Means are reported ± standard error (s.e.).
Results
Experiment 1. Metabolism study: recovery of infused Cr in the urine
The mixed diet of commercial feed pellets and pangola grass hay had a DM digestibility of 715 ± 20.8 g/kg. The DM intake and digestible DM intake of the steers over the 7-day infusion period, when the diet was restricted below ad libitum intake, were 17.3 ± 0.98 and 12.3 ± 0.72 g/kg W per day, respectively. The average recovery of infused Cr in urine for the three steers was 90.0 ± 4.02%. Measured urine output was 49.7 ± 20.69 ml/kg W per day. Cr concentration in the urine declined rapidly after infusion was terminated. Cr excretion in the urine, expressed as a percentage of the average for days 2–7 of infusion, was 13.9 ± 2.21% over 24 h following termination of the infusion and 1.1 ± 0.26% from 24 to 48 h. No Cr was detected in the bulk faecal sample for two of the three steers for the 7-day infusion period. The third steer had 3.6 μg Cr/g DM in the bulk faeces, equivalent to an average Cr output in the faeces of 5.2 mg/day, or 5.4% of the average daily Cr infusion for that steer.
Experiment 2. Metabolism study: recovery of infused Cr and Li in the urine
The native pasture and lucerne hays contained, on a g/kg DM basis, 911 and 918 OM, 43.4 and 193.4 CP, 662 and 418 NDF, and 363 and 327 ADF, respectively. The higher nutritional quality of the lucerne hay compared to that of the native pasture hay was associated with higher digestibility, DM intake, digestible OM intake and urine output by steers (Table 1).
Organic matter digestibility (OMD), dry matter intake (DMI), digestible organic matter intake (DOMI) and urine output of steers consuming native pasture and lucerne hays in Experiment 2

†DMI and DOMI were determined during sampling periods when intakes were restricted to 90% of the ad libitum intake during the preliminary period.
Recovery of Cr in the urine was not significantly different for steers consuming native pasture hay (89.2 ± 0.81%) or lucerne hay (90.2 ± 0.88%). Li recovery in the urine was lower (P < 0.001) for steers consuming native pasture hay (46.3 ± 0.40%) than for those consuming lucerne hay (72.6 ± 0.43%). There were also differences in Li recovery between experimental runs (P < 0.001).
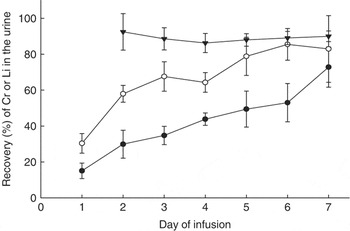
Cumulative Cr recovery, averaged over both hay treatments, was fairly constant over the 6 days of measurement (Figure 1). Repeated measures of analysis of variance showed that Cr recoveries on days 3 and 4 were lower (P < 0.05) than for most other days in Run 1, but there were no such between-day differences in Run 2. Li recovery in both experimental runs differed significantly between days (Run 1, P < 0.001; Run 2, P < 0.05); recoveries increased over time for steers consuming both native pasture and lucerne hays. Hence, the daily, rather than cumulative, Li recoveries are shown (Figure 1).
Cumulative recovery of Cr in the urine of steers averaged for both treatments (—▾—; mean ± s.d.) and daily recovery of Li (mean ± s.d.) for steers given native pasture (—●—) or lucerne (—○—) hays, in Experiment 2.

When the volume of urine estimated for each animal from spot urine samples and intravenously infused CrEDTA was expressed as a percentage of the gravimetrically measured urine volume, the mean value was 104.6 ± 6.11% for urine volumes ranging from 3.6 to 14.7 l/day. For these animals fed once daily, the diurnal range in proportional PD : Cr ratios in spot urine samples, across the 24-h sampling period for the five steers, was 0.72–1.57.
Concentrations of Cr in the spot faecal samples taken from steers after 6 days of jugular infusion were negligible (average 1.4 ± 0.38 μg/g DM). This level of Cr output in the faeces (2.5 mg/day) equated to only 2.4% of the average 24-h Cr infusion. Corresponding concentrations of Li were 11.0 ± 2.35 and 5.3 ± 0.95 μg/g DM, representing a faecal output of 17.0 and 10.5 mg Li/day, or 17.3% and 10.7% of the infused amount for the native pasture and lucerne hay, respectively.
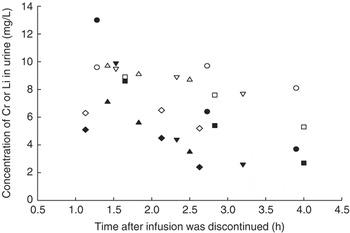
The concentration of Cr in the urine of steers consuming both the native pasture and lucerne hays declined rapidly over 5 h after discontinuing infusion, while Li concentration declined less rapidly. Data representing the decline of Cr and Li concentrations in urine over time, in steers consuming lucerne hay, are shown in Figure 2.
Changes in the concentrations of Cr (closed symbols) and Li (open symbols) in the urine of five steers receiving lucerne hay, after discontinuation of infusions, in Experiment 2. Within marker type, different symbols represent different steers. Times correspond with urination events.

Experiment 3. Grazing study: transfer of Cr and Li to the rumen fluid
No Cr was detected in the rumen fluid of seven out of eight steers grazing native tropical grass pasture in the dry season, on either days 2 or 6 of continuous infusion. However, trace amounts of Cr were detected in the rumen fluid of the other steer, i.e. <0.3 mg/l, on both days 2 and 6 of infusion. Lithium was detected in the rumen fluid of all eight steers on both days. The average Li concentration in rumen fluid was 0.41 ± 0.025 and 1.87 ± 0.079 mg/l on days 2 and 6, respectively.
Experiment 4. Grazing study: diurnal variation in the ratio of PD : Cr in the urine
There was a large range in diet chemical composition across the seven pasture types (Table 2). Diets of steers grazing tropical grass pastures (NPEW, NPT, NPD and BB) had much lower CP and higher NDF concentrations than those for tropical legumes (LL and BP) or the temperate grass, RG.
Mean crude protein (CP) and neutral detergent fibre (NDF) concentrations in extrusa from oesophageal fistulated steers grazing each of seven pasture types studied in Experiment 4

NPEW = native pasture (major species Heteropogon contortus and Bothriochloa bladhii) grazed in the early-wet season; NPT = native pasture (major species H. contortus and B. bladhii) grazed in the wet/dry transitional period; NPD = native pasture (major species H. contortus and B. bladhii) grazed in the dry season; BB = introduced tropical grass, creeping bluegrass (B. insculpta cv. Bisset); LL = introduced tropical legume, Dolichos lablab (Lablab purpureus cv. Highworth); BP = introduced tropical legume, butterfly pea (Clitoria ternatea cv. Milgarra); RG = annual ryegrass (Lolium multiflorum cv. Tetila).
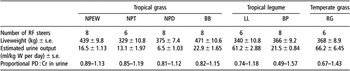
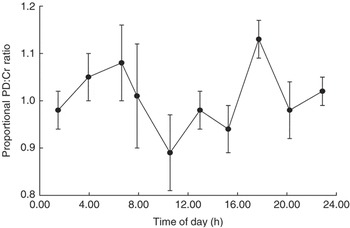
Inclusion of CrEDTA in urine did not interfere with the analysis of PD by HPLC in the bench-top study. The diurnal range in proportional PD : Cr ratios in the spot urine samples varied between pasture treatments (Table 3) with steers grazing NPEW pasture having the smallest, and those grazing BP pasture the greatest range. There were, however, no consistent diurnal trends in PD : Cr ratio across pasture types. An example of the variation in the PD : Cr ratio over 24 h is given in Figure 3, in which data for NPEW are presented. Estimated urine output varied widely across pasture types and ranked in a similar order to the CP content of the diet (Table 3).
Liveweight, estimated urine output and the diurnal range in the proportional purine derivatives (PD) : Cr concentrations in urine for rumen-fistulated (RF) steers grazing seven pasture types studied in Experiment 4

The proportional PD : Cr ratio was determined as the PD : Cr concentration in each spot sample of urine for a steer expressed as a proportion of the mean across all sampling times for that steer. For each sampling time, the mean of these proportions across steers was then determined. The range across the 24-h sampling period for all steers is presented.
NPEW = native pasture (major species Heteropogon contortus and Bothriochloa bladhii) grazed in the early-wet season; NPT = native pasture (major species H. contortus and B. bladhii) grazed in the wet/dry transitional period; NPD = native pasture (major species H. contortus and B. bladhii) grazed in the dry season; BB = introduced tropical grass, creeping bluegrass (B. insculpta cv. Bisset); LL = introduced tropical legume, Dolichos lablab (Lablab purpureus cv. Highworth); BP = introduced tropical legume, butterfly pea (Clitoria ternatea cv. Milgarra); RG = annual ryegrass (Lolium multiflorum cv. Tetila).
Diurnal variation in the ratio of purine derivatives (PD) : Cr (±s.e.) in urine spot samples, expressed as a proportion of the 24-h mean, for steers grazing native pasture in the early-wet season (NPEW) in Experiment 4.

Discussion
CrEDTA as a urine output marker
There are two features that need to be established to use intravenously infused CrEDTA as a marker to estimate urine volume and urinary output of a metabolite such as PD. The primary requirement is to measure a constant recovery of marker in the urine. The second requirement is to determine the extent of diurnal variation in marker concentration, and especially in the ratio of urinary metabolite to Cr, in spot urine samples. The latter is necessary to determine the required spot sampling regime for free-grazing ruminants so as to obtain a representative average ratio of urinary metabolite to Cr.
Cr recovery in the urine of cattle during continuous intravenous infusion of CrEDTA was quantitatively high at 90%, was constant across days and across animals, and was not affected by diet quality. In support, Downes and McDonald (Reference Downes and McDonald1964) also recorded 90% recovery of Cr in the urine of sheep after a single intravenous injection of 51CrEDTA. This consistency in recovery provides confidence in the wider use of the non-radioactive form of CrEDTA as a marker with potential to estimate urine output. This conclusion is based on the constant 90% recovery of CrEDTA across three diets varying from very low-quality native grass hay to higher quality lucerne hay and cattle pellets, when urine volume was gravimetrically measured and varied widely across diets. Urine volume was much greater for steers consuming lucerne as compared to native pasture hay in our experiment (50 v. 25 ml/kg W) and was most probably related to the higher intake, mineral content (not measured) and, to a lesser extent, N concentration of the lucerne hay (Church, Reference Church1979; Bannink et al., Reference Bannink, Valk and Van Vuuren1999). By applying the recovery value of 90%, urine volume may be calculated from knowledge of the intravenous infusion rate of CrEDTA and average concentration of CrEDTA in the urine by simple marker dilution principles. In the case of urinary metabolite output, it may be calculated by reference to the metabolite : Cr ratio (e.g. PD : Cr) and the intravenous infusion rate of CrEDTA (adjusted for recovery) without reference to urine volume per se. Both within-day and between-day variability need to be taken into account by an appropriate sampling regime as previously outlined. Siebert et al. (1978) found that a close approximation of total daily urine production was obtained using the marker dilution technique with intravenously infused CrEDTA and a sampling device which enabled a representative 24-h urine sample to be obtained. These authors assumed 100% recovery of intravenously infused CrEDTA in the urine. Our results indicate that it would be better to correct for the 90% recovery of CrEDTA in these calculations.
It was not possible from our experiments to categorically trace the fate of the 10% of the infused Cr, which was not recovered in the urine. The concentrations of Cr detected in the faeces of steers after intravenous jugular CrEDTA infusion were very low, being similar to background concentrations measured pre-dosing, but still representing up to 2–5% of the daily Cr infusion. However, this could be an artefact of the analytical method and its limitation in measuring very low concentrations of Cr. Downes and McDonald (Reference Downes and McDonald1964) used 51Cr and thereby had greater sensitivity in the detection of low concentrations of Cr, but found no radioactivity in faecal samples collected after a single intravenous dose of 51CrEDTA with sheep.
Consistent with the low faecal Cr concentrations, there was, for the most part, negligible Cr in the rumen fluid of RF steers even after 5.5 days of intravenous infusion of CrEDTA (Experiment 3). Downes and McDonald (Reference Downes and McDonald1964), using sheep, also detected no 51CrEDTA in rumen fluid samples taken up to 5 h after a single intravenous dose. However, in Experiment 3, trace amounts of Cr were detected in the rumen fluid of only one of eight steers on both days 2 and 6 of infusion. A possible explanation is that some of the steers grazing the low-quality native pasture were noticed to intermittently drink the urine of other steers, which may have contributed to the Cr detected in the rumen fluid of the one steer.
From measurements described above, it is possible that trace amounts of Cr were transferred to the rumen via saliva, or returned to the gut post-ruminally, and voided in the faeces. Additionally, it has been shown with human subjects that Cr in the blood system can be concentrated in the liver, spleen and bone marrow (Furst et al., Reference Furst, Radding and Wurzel1998) and it is possible that some of the infused CrEDTA had a similar fate in the steers in our experiments. This suggests the presence of a secondary slow-turnover pool for CrEDTA. Studies of the renal clearance of 51CrEDTA in sheep (Stacy and Thorburn, Reference Stacy and Thorburn1966) and humans (Fogh-Andersen, Reference Fogh-Andersen1980) have found the use of CrEDTA marker to underestimate renal clearance values obtained using inulin by 5–15%. Part of this difference has been explained by the binding of CrEDTA to plasma proteins. Fogh-Andersen (Reference Fogh-Andersen1980) estimated that there was at least 10% binding of CrEDTA to human albumin and Stacy and Thorburn (Reference Stacy and Thorburn1966) found that 1.5–2% of 51CrEDTA in sheep plasma could not be removed by dialysis. This may have similarly contributed to the incomplete recovery of Cr in the current experiments.
In our studies (Experiment 1), Cr concentrations in urine on the second day after completing infusions had declined to ca. 1% of those during infusion, in keeping with the finding of Downes and McDonald (Reference Downes and McDonald1964) that 96% of the Cr recovered in the urine appeared within 24 h of a single intravenous dose of 51CrEDTA in sheep. The apparent rapid decline of Cr in the plasma and urine in our experiments after ceasing infusion is also consistent with the results of Downes and McDonald (Reference Downes and McDonald1964), who found the disappearance of intravenously injected 51CrEDTA in sheep was best represented by two exponential lines with half-times of approximately 8 and 83 min. With half-times such as these, plateau concentration of CrEDTA would be rapidly achieved within a few hours, even without a priming dose, and well within the 24 h preliminary infusion period used here. A practical implication of our findings is that the continuous intravenous infusion method provides a robust technique for the field in that in the event of a disruption to the infusion, for instance due to equipment malfunction, the infusion can be recommenced and sampling resumed within about 24 h.
The primary requirement for use of CrEDTA as a marker to estimate urine and metabolite output has been established, with Cr recovery found to be constant across days, animals and diets. The second aspect, that of diurnal fluctuation in marker concentration and in the ratio of urinary metabolite to Cr, is now discussed. There was considerable diurnal variation in the concentration of marker in spot samples of urine and in the PD : Cr ratio. This in itself is not a problem but it does mean that there must be an intensive spot sampling regime at 2 to 3 h intervals to obtain an accurate mean marker concentration and/or PD : Cr ratio. In this case, the error in applying marker dilution principles is associated with this diurnal variation rather than the recovery of Cr marker in the urine. The same principle has been applied in grazing animals to estimate digesta flow, which is also known to exhibit diurnal variation (e.g. Cruickshank et al., Reference Cruickshank, Poppi and Sykes1992). The commonly accepted sampling regime for digesta markers in grazing animals is a sample approximately every 4 h, obtained by a twice-daily staggered sampling strategy (Faichney, Reference Faichney1975; Cruickshank et al., Reference Cruickshank, Poppi and Sykes1992). In the current grazing experiments, a twice-daily sampling regime was used between 9 and 15 h apart and at staggered times over 5 days so that samples were collected at approximately every 2.4 h of an average 24 h period. This indicated the extent of the diurnal variation in PD : Cr in urine and showed that it was necessary to have such an intensive sampling regime to account for this and to obtain an acceptable estimate of the average PD : Cr ratio (Table 3 and Figure 3). Urine volume was measured directly or by marker dilution in five animals (Experiment 2) and both measurements agreed closely and within sufficient accuracy for a field-based method (ratio of urine volume estimated by spot samples and marker dilution, to urine volume measured gravimetrically, was 1.05 for urine volumes ranging from 3.6 to 14.7 l/day). Any marker method relies on the establishment of steady-state conditions. Daily steady state was maintained in pen studies by fixing intake at less than the ad libitum intake. However, within-day steady state was not maintained, or desirable, as eating patterns vary throughout the day in grazing animals and any marker dilution method needs to be able to accommodate that variability.
Our results indicate that the continuous intra-jugular infusion of CrEDTA is a useful new method to estimate urine output and PD excretion (and hence MCP production) in the field. Experiments 1 and 2 have demonstrated a constant recovery (90%) across both low- and high-quality diets and Experiments 2 and 4 determined the diurnal variation in the PD : Cr ratio and Cr concentration in the urine and, by application of these factors, urinary excretion of PD may be determined. Furthermore, CrEDTA did not appear to affect measurement of PD concentrations by HPLC as evidenced by the bench-top study.
Lithium sulphate as a urine output marker
The average Li recovery in urine over 6 days of intravenous infusion into cattle consuming low-quality native pasture hay (46%) was much lower than that for lucerne hay (73%) but similar to that reported by Suharyono (Reference Suharyono1992) after a single intravenous injection of lithium chloride into sheep given oaten chaff (52% over 72 h). Our recovery calculation is based on the continuous intravenous method of infusion over the 7-day period. Other periods and routes of infusion may lead to different levels of recovery but the purpose here was to compare the recovery of two markers that could be infused over a relatively short period of up to 7 days. Schonewille and Beynen (Reference Schonewille and Beynen1999) found a mean urinary recovery of lithium chloride of 99% in goats but this was after daily ingestion in a concentrate pellet for 47 days.
With the lucerne diet, the pattern of daily Li recoveries in the urine of steers (Figure 2) indicated that recovery may have reached a plateau by day 6 of infusion, at 84% of that infused, whereas for the native pasture diet it was still increasing on day 7 of infusion and was by then only equivalent to 73% of the amount infused. These recovery values are to be expected, as urinary Li concentration followed a curvilinear pattern in accordance with a marker approaching plateau concentration after long-term continuous infusion, and simply reflect the time of sampling in relation to marker kinetics of Li and its movement between pools such as the digestive tract and the plasma.
Dixon et al. (Reference Dixon, Smith and Reid2003) found that the change in plasma lithium concentration over 96 h following intravenous injection was most adequately described by three exponential compartments. They hypothesised that the third compartment principally represented renal excretion, while the first and second compartments could have been associated with kinetic compartments in the extracellular fluid, rumen and post-ruminal digesta, and other body pools, or with mixing of lithium in these pools. Others have found evidence that Li in plasma is recycled to the rumen via saliva or returned to the gut post-ruminally (Harrison et al., Reference Harrison, Mangan and Hill1963; Ulyatt, Reference Ulyatt1964; Walker and Hawley, Reference Walker and Hawley1965; Suharyono, Reference Suharyono1992). In our experiment, the dietary interactions in Li recovery and inconsistencies in recovery patterns over time indicate that there is considerable movement of Li between such pools and, as such, plateauing of marker concentrations after continuous infusion takes variable time to develop. The marker concentration curve could be analysed to derive plateau values. However, it is not practical within the time frame of an infusion study to derive such values by which to determine marker recovery and hence potentially calculate urine volume. The longer term oral ingestion of 47 days described by Schonewille and Beynen (Reference Schonewille and Beynen1999) would have enabled plateau concentration to be achieved and provides another practical way to use this marker. The longer term approach overcomes the problem of variable time to reach plateau with relatively short-term infusion, as found here.
Considerable quantities of Li were detected in the rumen fluid and faeces of infused steers, providing evidence of transfer between the plasma and these secondary sites (Experiments 2 and 3). The estimated daily excretion of Li in the faeces of steers by day 6 of continuous jugular infusion was equivalent to 17% and 11% of the daily Li dose for steers consuming native pasture hay and lucerne, respectively. Once again, these results are similar to those of Suharyono (Reference Suharyono1992) who recovered 17% of the Li dose in the faeces of sheep following a single intravenous dose of lithium chloride. It must be emphasised that the recovery values relating to Li are determined by the period of sampling and are consistent with a marker that moves between a number of pools. In contrast, CrEDTA had a consistent recovery across days and diets.
A limitation of the current data set was the lack of sufficient sampling times to determine the fractional disappearance rate of Cr and Li in the urine after the intravenous infusion was discontinued. However, the data indicate that the decline in Li concentration in the urine was much less rapid than for Cr (Figure 2).
Conclusions
Intravenously infused CrEDTA in the urine of cattle consuming both low- and high-quality diets had a constant recovery (90%) and this information may be used in application of marker dilution to determine urine volume in animals grazing pastures of similar nutritional characteristics to those in the present study. There was a large variation in the concentration of Cr, and in the PD : Cr ratio, in spot urine samples. This necessitates an intensive sampling regime to estimate a mean Cr concentration, or PD : Cr ratio in urine, so as to apply marker dilution to estimate urine volume and urinary output of PD. Li salts do not reach plateau or constant recovery under the conditions of a 7-day intravenous infusion established by portable infusion pumps and so are not suitable for this method of marker infusion in the field.
Acknowledgments
The study was sponsored by the Department of Primary Industries and Fisheries, Queensland (DPI&F), who provided financial support for M. K. Bowen. M. K. Bowen was also in receipt of an Australian Government Postgraduate Research Award. We are grateful to the Health and Nutritional Biochemistry Laboratory of DPI&F and to Michael Nielsen of the University of Queensland for conducting laboratory analyses and Vivienne Doogan for assisting with statistical analyses. The technical support of Jim Kidd, the staff of Brian Pastures Research Station DPI&F, the staff of the University of Queensland Mt Cotton Research Farm and Antonio de Vega are acknowledged.