1. Introduction: African trade today and challenges in perspective
Until the financial crisis of 2008, world trade and investment flows had risen annually over the past several decades. The trade performance of Sub-Saharan African countries, however, has been disappointing. Africa's share of world exports has dropped by nearly two-thirds in the past three decades: from 2.9% in 1976 to 0.9% in 2006.Footnote 2 This implies that if Africa's share of world exports had remained constant since the mid-1970s, its export revenue would be approximately ten times larger than its current value.
The high cost of trade – i.e., the cost of transporting goods and moving them across borders – are a major obstacle to African trade performance. A growing literature has gathered empirical evidence of the negative impact of trade costs on a country's trade performance. High trade costs have a negative effect on country economic performance in several ways. For example, a country with relatively high trade costs confronts lower consumer welfare through higher prices of imported goods. Domestic producers are less competitive because inputs sourced outside the country are relatively more expensive. Direct evidence on border costs shows that tariff barriers are relatively low across all countries. Weak infrastructure and institutions, however, contribute to high trade costs along the logistics chain in Sub-Saharan African countries. Moreover, data and evidence suggest that African countries have some of the highest trade costs in the world.
Many of the slowest-growing economies in Africa are either engaged in conflict or have recently emerged from conflict. Geography has also played a major role in shaping the economic fortunes of African countries. Fifteen of them are landlockedFootnote 3 and about 40% of Africans live in these countries, which are dependent on the political stability, infrastructure, and institutional quality of their neighboring transit countries to reach overseas markets. A country's remoteness from major world markets, especially the landlocked countries in Africa, tends to drive trade costs higher than would be the case in other developing countries.
All these conditions – combined with corruption, underdeveloped institutions, constraints on business competition, and weak governance – make international trade and investment in Africa costly. Reducing traditional trade barriers on African exports, such as tariffs, remain important and must continue to be at the center of multilateral negotiations. We argue, however, that Africa will not be able to benefit from continued lowering of tariffs and other trade barriers unless action is taken to lower trade costs in the region. Moreover, as empirical research has demonstrated, growth in exports can be a powerful engine for poverty alleviation. For example, farmers that are able to grow high-yield export crops are, on average, less poor than those that engage in subsistence farming. High trade costs prevent the full realization of gains from trade and can diminish the poverty reduction effect of export opportunities for African countries.
The goal of this paper is two-fold. First, we review recent literature and indicators on trade costs relevant to Africa. We classify trade costs into four broad groups: border-related costs, transport costs, costs related to behind-the-border barriers, and the costs of compliance with rules of origin that are specific to preferential trade. Our review does not intend to be comprehensive. We primarily focus on recent research presenting evidence of the impact of trade costs on African countries and highlight new data addressing the sources of trade costs. The paper presents the limited evidence on direct costs related to trade transactions.Footnote 4 We also present data on indirect measures of trade costs, which are primarily inferred from case studies and empirical work in gravity models. Indeed, the lack of official statistics on trade costs in many countries around the world is a major limitation for empirical research.Footnote 5 It is important to note when considering these data that trade costs and facilitation can be either primarily tied to trade friction, such as resources necessary in getting a product to the final user, or costs associated with government regulation, which can be addressed through policy reform.
Second, building on data and gravity model estimates by Hoekman and Nicita (Reference Hoekman and Nicita2008), we estimate ad-valorem equivalents of a counterfactual improvement in trade-cost indicators for several African countries. As data on African countries are generally sparse, the advantage of Hoekman and Nicita's specification is the incorporation of trade cost variables with good coverage of African countries. This includes new data in the Logistics Performance Index (LPI) (World Bank, 2007) and trade indicators constructed by Doing Business (World Bank, 2008). Moreover, the model includes the ad-valorem trade restrictiveness indices estimated by Kee et al. (Reference Kee, Nicita and Olarreaga2009). These provide a theoretically sound way of summarizing – in a single figure – the restrictiveness of tariff and non-tariff barriers, which can be disparate across tariff lines.
Drawing on gravity estimates, we provide an illustrative assessment of the relative importance of trade costs captured by these estimators and proceed in three steps. First, we build on Hoekman and Nicita's proposed gravity model to obtain gravity estimates and analyze the sensitivity of the estimated coefficients to the inclusion of different indicators as well as to the use of several estimation techniques. Second, using gravity estimates, we compute the ‘ad-valorem’ tariff cut that would be equivalent to reducing the trade costs associated with moving a standardized container (as defined and reported by Doing Business) halfway to the value of Mauritius, the top performer in Africa. Finally, we compare these illustrative ad-valorem equivalents across African countries.
The paper is organized as follows. Section 2 presents the definition of trade costs and discusses some orders of magnitude. In Section 3, we review recent research on four dimensions of trade costs: border-related costs, transport costs, costs related to behind-the-border issues, and the costs of compliance with rules of origin that are specific to preferential trade. In Section 4, we use gravity estimates to compute illustrative ad-valorem equivalents of improvements in some trade cost-related dimensions for African countries. Section 5 concludes.
2. Definition of trade costs and orders of magnitude
Trade costs can be broadly defined to encompass all costs incurred in getting a final good to a final user – other than the cost of producing the good itself. In general, an exporter or importer incurs trade costs at all stages of the export or import process. This often starts with obtaining information about market conditions in a foreign market and ends with receipt of final payment for a good. Frequently, firms serving the local market and willing to sell their product overseas are subject to costs of compliance with standards and technical regulations imposed by the importing country. As these costs would not be incurred if the goods were sold exclusively on the domestic market, they can be considered a trade cost. A similar framework applies to preferential trade agreements because preferential access to partners' markets requires compliance with rules of origin. These rules may involve, for example, adjustments to the intermediates mix or production process that often involve additional costs for producers.
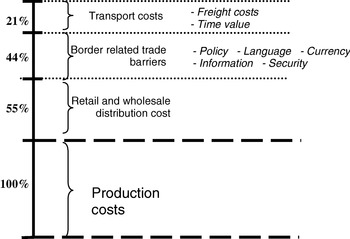
In an extensive review of the literature on the sources of trade costs, Anderson and Van Wincoop (Reference Anderson and van Wincoop2004) estimate that trade costs for industrialized countries, on average, are equal to an ad-valorem equivalent of 170%. The authors break down this estimate into three components: a 21% ad-valorem equivalent for transportation costs, 44% for border-related trade barriers, and 55% for retail and wholesale distribution costs, as shown in Figure 1.Footnote 6 It appears that trade costs have different magnitudes and patterns. This is true across countries and regions, as well as across sectors and goods. Available data suggest that for developed countries, the costs of trading a good, including both international trade costs and domestic distribution costs, can be even larger than the costs of production.
Estimates of trade costs in industrialized countries
Note: The breakdown of costs is expressed in ad-valorem equivalent terms: 1.7=1.21∗1.44∗1.55−1. Source: Estimates are drawn from Anderson and Van Wincoop (Reference Anderson and van Wincoop2004).

The ratio of trade costs to production costs appears to be larger for developing countries than for developed ones. This is true especially in Africa where producers face considerably higher transport costs than developed countries face. As outlined in Figure 1, Anderson and Van Wincoop's estimates can be considered as an illustrative benchmark for similar trade cost figures that can be estimated for African countries.
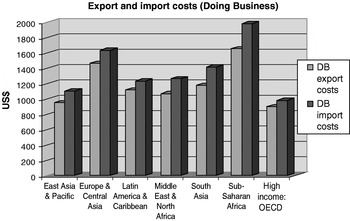
To illustrate the variability of trading costs across regional groups, Figure 2 shows the average costs of export and import procedures by group of countries presented in the World Bank's (2008) Doing Business report.Footnote 7 Among the developing countries in the data set, those in Sub-Saharan Africa have the highest costs on average. The costs of import and export procedures in Africa are about twice as high as those in high-income OECD countries.
Costs of export and import procedures in USD
Source: Doing Business (2008).

3. Trade costs and their impact: a review
A classification of the different types and sources of trade costs can be performed in several ways. In this review, we group trade costs in four categories, starting with border-related costs. These include both tariffs and non-tariff measures. The restrictiveness indices developed by Kee et al. (Reference Kee, Nicita and Olarreaga2009) provide a summary of both types of measures, allowing comparison across countries. Second, we review the evidence and the literature on transport costs. Next, we focus on trade costs related to behind-the-border issues. These include topics such as governance, transparency, and the business environment. Fourth, we provide a summary discussion of the costs of compliance with rules of origin found in preferential trade agreements. This is an issue central to trade and Africa. In the concluding section, we discuss the contrast between ‘hard’ infrastructure (highways, railroads, ports, etc.) and ‘soft’ infrastructure (standards, administrative procedures, transparency, etc.).
3.1 Border-related costs
Trade policy and border barriers
As goods enter a country, they are subject to a variety of trade policy barriers that increase the costs of trading. Traditional trade policy barriers include tariffs (ad-valorem and specific), quotas, and a combination of both (tariff-rate quotas, TRQ). Other less ‘traditional’ trade policy instruments include anti-dumping duties, countervailing duties, and safeguard measures. Trade policy barriers increase the costs of exported goods abroad and the costs of importing goods. Ng and Yeats (Reference Ng and Yeats1996) argue that the drastic decline in African exports has been related to closed trade regimes in Sub-Saharan Africa. Indeed, the authors suggest that high African tariffs on broad groups of production equipment and other goods (often key inputs in agricultural or manufacturing activity) represent additional direct costs for African producers.
Because trade policy can take different forms, it is difficult to find a single measure condensing trade policy restrictiveness. Although the impact of trade policy measures can be estimated as an ad-valorem equivalent for a single good, it can be useful to aggregate a large number of tariffs and other trade policy measures into a single figure that summarizes the overall level of restrictiveness in each country.
Kee et al. (Reference Kee, Nicita and Olarreaga2009) develop theoretically grounded indices based on research by Anderson and Neary (Reference Anderson and Neary1994) of trade restrictiveness across countries. The Overall Trade Restrictiveness Index (OTRI) and the Tariff Trade Restrictiveness Index (TTRI) provide summary measures of trade policies affecting a country's imports and allow comparison across 104 countries (counting the European Union as a single country). Both indices provide a measure of the equivalent uniform ad-valorem tariff, which, if applied by an importing country to its imports, would result in a level of aggregate imports equivalent to that prevailing under current policy settings. The OTRI captures all policies on which information is reported by international organizations collecting these data (International Trade Center (ITC), United Nations Conference on Trade and Development (UNCTAD), and the World Trade Organization (WTO). These comprise ad-valorem tariffs, specific duties, and non-tariff measures (NTMs), such as price control measures, quantitative restrictions, monopolistic measures, and technical regulations.
In contrast, the TTRI is narrower in scope. This index considers only ad-valorem and specific tariffs. Because many NTMs are not necessarily protectionist in intent, the OTRI reflects net overall restrictiveness. It is not a measure of the level of protection that a government seeks to provide domestic industry. Some NTMs comprise border restrictions, such as quotas or bans, and are motivated by protectionist objectives. Other regulatory policies, such as sanitary and phytosanitary standards, are aimed at safeguarding human, animal, or plant health. Unfortunately, the measures do not allow distinction between objectives. Thus, protection is arguably better measured by the TTRI, even if this index is most suited to producing lower-bound estimates of the extent of protection in a market. Both measures can be aggregated at the sector level.
There are two other indicators available on trade restrictiveness – the Market Access OTRI (MA-OTRI) and the Market Access TTRI (MA-TTRI). These are estimates of the uniform tariff, which, if imposed by all trading partners on exports of a given country, would leave the country's exports at their current level. The MA-TTRI measures restrictiveness associated with tariffs alone. The MA-OTRI can be calculated bilaterally in order to obtain the level of trade restrictiveness that a given importer country imposes on the exports of another exporter (see Kee et al., 2009, for details).
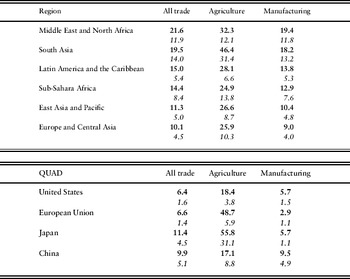
There are three important points to note with respect to restrictiveness indices and trade policy patterns. First, it may be misleading to focus only on tariffs as measures of restrictiveness. Non-tariff barriers clearly contribute to the overall restrictiveness of trade policy. For East Asia and the Pacific, Europe and Central Asia, and Latin America and the Caribbean, the non-tariff component (measured by the difference between OTRI and TTRI) is more important than the tariff component (measured by TTRI), as seen in Table 1a. The same applies to the United States, the European Union, and Japan – three of the four largest world traders (see Table 1a).
Second, most of the restrictive trade policies in the data are concentrated on agricultural products of particular importance for African countries. The value of the OTRI for agricultural products is about twice the OTRI for manufactured goods, as outlined in Tables 1a and 1b. Among the four major traders, Japan and the European Union are the markets with the most restrictive overall trade policies for agriculture. The European Union is the market with the highest restrictiveness tied to NTMs (about 90% of overall restrictiveness).
OTRI and TTRI (%), by region and for the four largest traders, 2006

Note: Tariff Trade Restrictiveness Index (TTRI) is in italics; Overall Trade Restrictiveness Index (OTRI) is in boldface font.
Source: Global Monitoring Report (2008), World Bank.
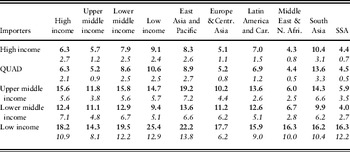
MA-OTRI and MA-TTRI by income group, 2006

Note: Market Access TTRI (MA-TTRI) is in italics; Market Access OTRI (MA-OTRI) is in boldface font.
Source: Global Monitoring Report (2008), World Bank.
Third, the effect of trade policies on exporters' market access differs across partners and regions. This is due to both the discriminatory use of trade policy measures (i.e., preferential trade arrangements) and to the composition of trade. Table 1b reports the MA-OTRI and MA-TTRI for exporters in each region and income group. Countries in Sub-Saharan Africa benefit from both relatively liberal market access, as a result of preferential market access to many countries, and low tariffs on commodities that African countries export. Among other regions, Eastern European and Central Asian market access to high-income countries is facilitated by preferences offered by the European Union. The low TTRI confronting the Middle East and North African exporters is largely due to the composition of exports – oil products are generally subject to low import tariffs.
Customs procedures
In a broad context, national customs administrations are in charge of implementing a country's trade policy at the border. This involves, for example, levying tariff duties, verifying conformity of imported goods with regulatory requirements, and preventing the importation of prohibited or unsafe imports (e.g., illegal weapons or out-of-date medicines).
Delays in customs clearance raise trade costs. This involves opportunity costs for firms that are slower to market and may lose contracts with importers, as well as higher storage fees at the port of entry, for example Djankov et al. (Reference Djankov, Freund and Pham2009) find that each day of delay at customs is equivalent to a country distancing itself from its trading partners by an additional 85 km. Keeping customs procedures as simple and transparent as possible contributes to reducing the time needed to clear customs.
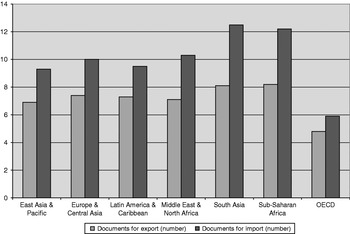
The World Bank (2008) Doing Business dataset reports procedural requirements for exporting and importing a standardized cargo of goods by ocean transport. Figure 3 shows the average number of export and import procedures across regions. South Asia has the highest number of export and import procedures, closely followed by Sub-Saharan Africa.
Number of export and import procedures
Source: Doing Business.

Product standards and technical regulations
Product standards and technical regulations can have a dual impact on trade costs. Meeting product standards can involve additional variable or fixed costs on exporters that need to alter production processes to adapt products to regulations in the importing country. Moreover, product certification is necessary to demonstrate compliance with standards can involve additional costs for the exporters in multiple markets. However, product standards and technical regulations in the importing country can reduce exporter's information costs if they convey valuable information as to consumer tastes or industry needs in the importing country. In the absence of standards, such information would be costly for the exporting firm to collect. Accordingly, standardization in sectors where information costs are important could help reduce trade costs and promote trade.
The net impact of product standards on trade depends on the relative magnitude of the effects. The empirical evidence on these issues is limited, primarily due to the impediment of collecting reliable dataFootnote 8 and constructing comprehensive indicators on standards in different sectors across countries. Among the papers that have found evidence as to the negative effects of standards on trade from African countries, Otsuki et al. (Reference Otsuki, Wilson and Sewadeh2001) examine the impact of European aflatoxin standards on African groundnut exports. They find that a 10% increase in restrictiveness is associated with a fall in trade volume of about 11%. Disdier et al. (Reference Disdier, Fontagné and Mimouni2007) use data on WTO notifications of mandatory sanitary and phyto-sanitary measures, as well as technical regulations, to measure the impact of standards across a large number of sectors. They generally find that standards are associated with negative trade impacts, in particular for exports from developing countries to OECD countries.
On the positive net impact of standards on trade, Moenius (Reference Moenius2004) observes that country-specific standards tend to promote trade in the manufacturing sector. However, the opposite result holds for homogeneous goods, such as agricultural products. Such an outcome could be consistent with the interpretation that higher information costs in manufactures can be surmounted by standards.
One way to reduce the costs associated with standards is through international harmonization of standards. This can limit the need for exporters to alter products to meet multiple standards for different markets. Czubala et al. (Reference Czubala, Shepherd and Wilson2007) examine the impact of EU standards on African textiles and clothing exports. By identifying standards aligned with ISO (International Organization for Standardization) standards (as a proxy for de facto international norms), the authors find evidence that non-harmonized standards reduce African exports. In contrast, they find that EU standards harmonized to ISO standards are less trade restricting. Their results suggest that efforts to promote African exports of manufactures may need to be complemented by measures to reduce the cost of product standards through new efforts to support international harmonization of standards. The authors suggest that steps to harmonize national standards with international norms, including through the World Trade Organization's Technical Barriers to Trade Agreement, promise concrete benefits for African exporters.
3.2 Transport costs
Transport costs also matter to trade. Each kilometer a good travels requires fuel, labor, and capital expense. Does distance to markets matter as much today as it did decades ago? Discussion on this matter continues and empirical work has addressed this question. For example, Hummels (Reference Hummels1999) estimates the elasticity of shipping and costs with respect to distance, and charts its evolution over time for air and ocean shipping over the period 1974–98. He finds that the difference between costs associated with shipping comparable ocean/shipped commodities over a long (9,000 km) route and a short (1,000 km) route decreased by 27 percentage points from 1974 to 1998. The effect of distance on costs appears to decline over time. Over the years, technological improvements, such as the introduction of containerization in maritime transport in the 1950s, appear to have contributed to the reduction in transport costs.
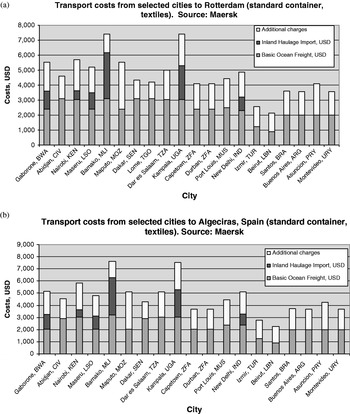
Despite the contribution of technical improvements to lowering trade costs, shipping costs from African countries to major world markets can be considerably higher compared with other regions. Figures 4a and 4b show shipping costs from several cities to two of the largest European ports, Rotterdam and Algeciras, reported by Maersk, a major shipping company. To ensure comparability among figures, we collected the freight costs for a standard 40-foot container transporting textiles. Despite the distance between both European ports, freight costs from each city in the sample to Algeciras and Rotterdam are similar. Consider Santos and Dakar, the closest South American and African cities in the sample to Algeciras. Despite the fact that distance to Santos is about twice the distance to Dakar, the cost of ocean freight is lower from the Brazilian city. Moreover, the presumably low-value of exports from developing countries, especially in Africa, inflates the transport costs of a container when expressed in ad-valorem terms.
Transport costs from selected cities to a European port
Source: Maersk. Transport costs corresponding to July 2008, see: http://www.maersk.com/en/Pages/Welcome.aspx

Indeed, maritime transport exhibits important economies of scale. Larger trade flows are conducive to scale economies in shipping. To further illustrate the relationship of freight costs for large versus small exporters, Hummels (Reference Hummels2006) considers the case of Japan and Côte d'Ivoire. These countries are equidistant to the west and east coasts of the United States, respectively. Shipping costs from Côte d'Ivoire are twice as high as shipping costs from Japan. This is true even after adjusting for differences in the commodity composition of trade. In addition, Hummels and Skiba (Reference Hummels and Skiba2004) use data from importer–exporter pairs to estimate that doubling trade quantities leads to a 12% reduction in shipping costs. Arvis et al. (Reference Arvis, Raballand and Marteau2007) illustrate the tendency of shipping lines to set higher tariffs in smaller ports with less traffic, describing the case of exporters of fruits and vegetables from south Mauritania. They argue that because of maritime transport price differentials, exports are processed in the Dakar port, in Senegal, rather than in Nouakchott, despite the border crossing costs and longer distance to market for these products.
Recent research also identifies poor infrastructure as a significant barrier to trade expansion (e.g., Limao and Venables, Reference Limao and Venables2000). Buys et al. (Reference Buys, Deichmann and Wheeler2006) investigate the potential trade benefits of investing in upgrading and maintaining a trans-African highway network. The proposed network links 83 major cities at a length of about 100,000 km, and the estimated benefits are found to be significant. Buys et al. find that intra-African trade, as a whole, can be expected to increase from 10 billion to about 30 billion US dollars per year, while initial investments and annual maintenance costs would be relatively moderate over the course of the investment cycle. For instance, an upgrade of the road from Bangui in the Central African Republic to Kisangani in Congo DR is expected to increase the volume of trade by 7.93%.
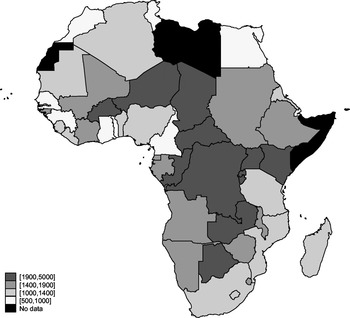
Landlocked countries in Africa are particularly at a disadvantage. To access overseas markets, landlocked countries rely on the physical infrastructure and logistic capacity of transit countries. They are also subject to costs related to the administrative practices and political stability in transit countries. As for African landlocked countries, dependence on a transit country implies higher transaction costs. Figure 5 shows the costs associated with completing export procedures as reported by Doing Business in 2008 for several African countries. The fees include costs for documents, administrative charges for customs clearance and technical control, terminal handling charges, and inland transport costs. Not surprisingly, export costs are ranked among the highest for most landlocked countries.
Costs associated with completing export procedures (US$)
Source: Graph constructed with data from Doing Business (2008).

Limao and Venables (Reference Limao and Venables2000) estimate that the median landlocked country's transport costs are 46% higher than the equivalent costs in a median coastal economy. They also find that distance explains only 10% of the change in the transport costs. Poor road infrastructure represents 40% of the transport costs predicted for coastal countries and 60% for landlocked countries, which is especially relevant for African countries where transport costs seem to be particularly high because of location and poor infrastructure.Footnote 9
International transport in Sub-Saharan Africa also suffers from low competition, reflecting the regulations of African governments intended to promote national shipping companies and airlines. For example, as described by Collier and Gunning (Reference Collier and Gunning1999), many African governments (especially in West Africa) have adopted ‘cargo reservation schemes’, which allow privileged liner operators to set inflated freight rates.
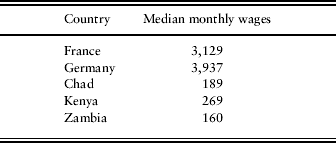
Studying primary international corridors in Africa,Footnote 10 Teravaninthorn and Raballand (Reference Teravaninthorn and Raballand2008) argue that the costs backed by transport-service providers are not excessively high in Africa. Nevertheless, the transport prices charged to end-users in Africa are relatively high compared with prices in developed countries and most developing countries. This finding is notable given the low level of wages for truckers in Africa compared with wages elsewhere, as illustrated in Table 2.
Median monthly wages for truckers (US$)
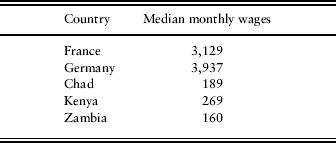
Source: Teravaninthorn and Raballand (Reference Teravaninthorn and Raballand2008).
Teravaninthorn and Raballand suggest that the trucking market structure and environment in West and Central Africa are characterized by strict market regulation leading to low transport quality. By contrast, in East Africa, the trucking environment is more competitive and the market is more mature. Trucking operators from landlocked countries, especially in West and Central Africa, have benefited from formal and informal protection for decades. The result is higher transport prices and lower quality of services. Trucking surveys also find the presence of a large mark-up and profit margin for transport providers. This is due, in part, to regulation leading to high transport prices along international corridors, such as those in West and Central Africa. By contrast, Teravaninthorn and Raballand also find that major corridors in Southern Africa are the most advanced of all corridors included in their study in terms of prices and efficiency of services; this is mainly because of an unregulated transport market.
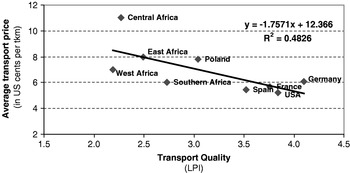
Figure 6 compares transport prices with the Logistics Perception Index (LPI)Footnote 11 for some countries as well as African regions. Compared with other countries, such as France and the United States, transport prices in Africa are more expensive and provide a lower quality of service, as measured by the LPI. The Central African region is an extreme case of high prices associated with low quality.
Transport services in Africa: quality and cost
Source: Teravaninthorn and Raballand (Reference Teravaninthorn and Raballand2008).

Building on Wilson et al.'s (Reference Wilson, Mann and Otsuki2003) methodology, Njinkeu et al. (Reference Njinkeu, Wilson and Fosso2008) analyze the impact of reform along four categories of trade facilitation efforts: port efficiency, customs environment, regulatory environment, and services infrastructure. Using a gravity model, they find that the port and service infrastructures are the primary factors that tend to expand intra-African trade.
3.3. Behind-the-border issues and other sources of costs
Corruption, governance, transparency, and the business environment
Recent research has focused on the channels through which institutions impact trade. Anderson and Marcouiller (Reference Anderson and Marcouiller2002) find that weak institutions act as significant barriers to international trade. Trade transactions are inherently risky due to, for example, imperfect contract enforceability that goes along with weak institutional regimes. The authors use World Economic Forum data to construct an index of the strength of institutions that support trade, focusing on contract enforcement and the existence of impartial and transparent government policies.
Weak institutions are evident in the widespread corruption at various points in the supply chain. The empirical evidence supports the view that trade costs are an important determinant of extortion and evasion behaviors. Gatti (Reference Gatti2004) uses data on corruption and trade policy to show that higher trade costs – in this case, tariff rates – are indeed associated with a higher level of corruption. Focusing on the evasion mechanism, Fisman and Wei (Reference Fisman and Wei2004) measure the difference between declared export and import values in bilateral trade between Hong Kong and the Chinese mainland. They find that higher tariff rates are associated with larger differences in declared values, which is highly suggestive of an important evasion effect.
A recent working paper by Dutt and Traca (Reference Dutt and Traca2007) provides preliminary evidence on the importance of extortion and evasion in regard to the impact on bilateral trade flows. Using a gravity model, they show that the trade inhibiting effect of corruption depends on the level of trade costs. The authors show that the extortion effect dominates when tariffs are low, but becomes less important as they increase. Moreover, the data also appear to support the proposition that the trade-impeding effects of tariffs are lower in more corrupt countries. This finding is consistent with the existence of an evasion mechanism. As tariff rates increase, firms in corrupt countries can limit their impact by making side payments to customs officials.
Francois and Manchin (Reference Francois and Manchin2007) measure institutional quality through the lens of economic freedom, focusing on aspects such as the size of government, freedom of trade, the protection of property rights, and business regulation. They find that strong institutions are associated with increased trade at both the intensive and extensive margins.
Helble et al. (Reference Helble, Shepherd and Wilson2007) conduct empirical investigations of the role of transparency in trade, focusing on the Asia-Pacific region. They use a combination of ‘objective’ and perception-based indicators to produce composite measures of importer and exporter transparency. Their measures cover two fundamental dimensions of transparency: predictability and simplification. To capture the former, they consider data such as administrative favoritism, dispersion of tariff rates, extent of tariff bindings, and uncertainty surrounding import times. Simplification of a country's trade regime is analyzed using variables including the time taken to import, the number of agencies an importer must deal with, the extent of trade barriers other than published tariffs, and the prevalence of trade-related corruption. Transparency, particularly as it relates to the import regime, can be a significant factor in promoting bilateral trade. Helble et al. (Reference Helble, Shepherd and Wilson2007) find that improving import transparency in Asia-Pacific Economic Cooperation (APEC) member economies to the regional average could have a larger impact than reducing tariffs or non-tariff barriers to the same level. The gains from reform accrue primarily to the reformers themselves. The authors suggest that making trade policy more predictable reduces uncertainty, and therefore costs, for businesses. The reform measures outlined by the authors to raise the transparency of trade policy include: (i) binding tariff rates through the WTO; (ii) moving toward ‘flatter’ tariff structures; (iii) making import and export delays less variable; (iv) lowering uncertainty surrounding unofficial payments; and (v) reducing favoritism in administrative decision making.
Using data from the World Bank's investment climate surveys, Balchin and Edwards (Reference Balchin and Edwards2008) examine the relationship between the business climate, manufacturing productivity, and export performance in eight African countries: Egypt, Kenya, Madagascar, Mauritius, Morocco, South Africa, Tanzania, and Zambia. Based on principal components analysis, they construct several indices summarizing different aspects of the business climate, and find that indices representing micro-level supply constraints, macroeconomic conditions, and the legal environment are all significant determinants of the probability of exporting. At the country level, the quality of the business climate is found to matter most for export participation in Mauritius and Zambia. The study also finds that individual firm characteristics – such as size, age, ownership, use of information technology, and managerial education levels – are important determinants of the decision to enter foreign markets. Indeed, larger and younger firms are more likely to export, as well as firms with a larger share of foreign-owned firms. Moreover, a higher propensity to export is found for firms whose top manager has some form of tertiary education and for those having access to the Internet.
Information and communication costs
Border costs associated with information barriers are important. Recent empirical work reflects this fact in assigning importance to modern information and communications technologies as determinants of international trade costs. Limao and Venables (Reference Limao and Venables2000), for instance, include a measure of telecommunications development (the number of mainlines) in their indices of infrastructure quality. Francois and Manchin (Reference Francois and Manchin2007) take a broader approach, including data on mobile telephone usage. Consistent with the view that communications costs are an important component of trade costs, both papers find an overall positive impact of infrastructure quality, including communications infrastructure quality, on bilateral trade.
In line with these arguments, expanded use of the Internet appears to lower the costs of trading internationally. It is now much easier – and cheaper – to obtain information on foreign market conditions, product standards, and consumer preferences through the Internet. This should lower the costs of entering foreign markets and promote trade at the margin. Freund and Weinhold (Reference Freund and Weinhold2004) provide the first empirical evidence in support of this theory. They find that a 10% increase in the number of a country's Web hosts is associated with an export gain of around 0.2%. Although this effect is statistically significant, it is relatively small in economic terms. Moreover, they find that development of the Internet does not seem to have brought about significant changes in the impact of distance on trade. This outcome may be consistent with a scenario in which the Internet significantly reduces the fixed costs of market entry, such as obtaining information on product requirements or preferences, but does not significantly alter the variable costs of international trade reflected in distance to markets.
Other sources of costs
Other non-market institutions, such as exporters' clubs, can have an impact on trade costs. For instance, Negri and Porto (Reference Porto2008) assess the benefits of Burley tobacco clubs in Malawi. Tobacco clubs are formed by about ten to 30 farmers that grow tobacco collectively and are designed to promote smallholder tobacco production. One of the major services provided by these clubs is access to selling floors in Malawi. In addition, club members jointly acquire inputs under group lending (that is, under a common loan that is repaid at the time of sales in the auction floors) and work together to monitor debt repayment and input use (preventing side selling of fertilizer, for instance). They also act collectively to purchase inputs collectively, often at lower prices.
Moreover, tobacco clubs contribute to economies of scale, particularly in transportation services to the selling floors. Finally, the clubs are instrumental in the development of supporting networks by encouraging the interchange of farming advice and the provision of labor assistance. Negri and Porto find that club members are much more productive than non-members. The tobacco club premium in yield (per acre) ranges from 40% to 74%. Members also earn between 45% and 89% more (per acre) than non-members via sales. This implies income gains from Burley membership of between 20% and 37%. The authors affirm that these gains would be equivalent to increases in tobacco prices, for instance due to improved market access abroad, lower transportation costs, or better infrastructure, of between 37% and 54%.
In another paper exploring the role of export costs in poverty reduction in rural Africa, Balat et al. (Reference Balat, Brambilla and Porto2008) claim that the marketing costs incurred when the commercialization of export crops requires intermediaries can lead to lower participation in export cropping and, thus, to higher poverty. The study uses data from the Uganda National Household Survey and highlights three major results: (i) farmers living in villages with fewer outlets for sales of agricultural exports are likely to be poorer than farmers residing in market-endowed villages; (ii) market availability leads to increased household participation in export cropping (coffee, tea, cotton, fruits); and (iii) households engaged in export cropping are less likely to be poor than subsistence-based households. The authors examine the role of complementary factors that provide market access and reduce marketing costs as key building blocks in the link between the gains from export opportunities and the poor.
Another source of trade costs relates to the lack of competitive markets in smaller countries. For example, Yeats (Reference Yeats1990b) analyzes unit values of iron and steel African imports. He finds that 20 former French colonies in Africa paid a price premium of 20–30%, on average, over other importers for iron and steel imported from France over the period 1962–1987. Losses associated with these prices totaled approximately 2 billion dollars by 1987. Yeats also finds that similar price premia (20–30%) were paid by former Belgian, British, and Portuguese colonies in Africa for imports of these products from the former colonists.
3.4 Costs related to preferential trade: rules of origin
A high percentage of African exports to developed countries are shipped on a preferential basis. In order to benefit from enhanced market access through a lower preferential tariff, producers must comply with rules of origin. The primary purpose of rules of origin in such preferential agreements is to prevent trade deflection. This may occur if a beneficiary country – with most favored nation tariff status lower than the one set by the country offering the preferences – imports a product and re-exports it at a profit. Nevertheless, well-organized interest groups in any of the partner countries can influence the application of these rules to raise costs and restrict trade beyond what is necessary to prevent trade deflection. Cadot, de Melo, and Portugal-Perez (Reference Cadot, de Melo and Portugal-Perez2007) apply revealed-preference arguments to estimate upper and lower bounds of compliance costs of rules of origin. The authors obtain trade-weighted ad-valorem estimates of compliance costs of 4.7–8.2% for PANEURO preferences, which include Sub-Saharan African countries.
The textile sector is important for Africa and the sector is eligible for trade preferences in the United States and the European Union. The textiles industry employs a large number of low-skilled laborers. Many low-income African countries benefit from preferential market access for their apparel to the United States and the European Union. The extent of preferential access for apparel to the US market provided by the African Growth and Opportunity Act (AGOA) is similar to that provided under the European Union's preferential regimes. These agreements differ, however, in their application of rules of origin. The European Union, under the Everything But Arms initiative and the Cotonou agreement, requires yarn to be woven into fabric and then made up into apparel in the same country or in a country qualifying for cumulation. The AGOA grants a ‘Special Rule’ (SR) to ‘lesser developed countries’, allowing them the use of fabric from any origin to still meet the criteria for preferences.
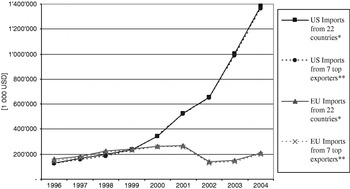
Figure 7 shows a substantial increase in the value of apparel exports with AGOA's entry into force in 2000. Unlike AGOA's special regime (SR), neither Cotonou nor Everything But Arms appeared to have offered a preference mix (tariff preferences and rules of origin) conducive to export growth. Comparing African apparel exports with the European Union and the United States provides an opportunity to analyze the effects of rules of origin on the uptake of trade preferences. By taking advantage of this natural experiment, de Melo and Portugal-Perez (Reference Portugal-Perez2008) find econometric evidence that relaxing rules of origin by allowing the use of fabric from any origin increased exports of apparel by about 300% for the top seven beneficiaries of AGOA's SR, while also broadening the varieties of apparel exported by these countries.
Apparel exports of 22 countries benefiting from AGOA-SR by 2004
Notes: The 22 Sub-Saharan African countries benefiting from AGOA-SR by 2004 as well as ACP are: Benin, Botswana, Cameroon, Cape Verde, Ethiopia, Ghana, Kenya, Lesotho, Madagascar, Malawi, Mali, Mozambique, Namibia, Niger, Nigeria, Rwanda, Senegal, Sierra Leone, Swaziland, Tanzania, Uganda, and Zambia. **The top 7 exporters are: Botswana, Kenya, Lesotho, Madagascar, Namibia, Nigeria, and Swaziland. Source: Portugal-Perez (Reference Portugal-Perez2008).

Strict rules of origin have been justified as a means to support more processing in developing countries by encouraging integrated production within a country, or within groups of countries through cumulation schemes. However, rules of origin can have a negative effect as they discourage developing country exports at the intensive margin, as well as at the extensive margin through product diversification. In sum, development-friendly policies would benefit from relaxing the stringency of rules of origin requirements.
Recent research provides evidence that the current system of trade preferences granted by developed countries to African countries is undermined by the current rules of origin (see Cadot and de Melo, Reference Cadot and de Melo2008, for an extensive review). Rules of origin have a legitimate justification in preventing trade deflection. Evidence indicates, however, that they have largely been captured by protectionist interest groups and hinder the integration of preference-receiving developing countries in the world economy. A first step in any reform agenda should focus on simplification of rules to reduce compliance costs. For example, the different combinations of rules of origin that exist for a single good in preferential agreements could be abandoned for single value content. The World Trade Organization could play a role in facilitating the harmonization of rules of origin across preferential trade agreements.
3.5 ‘Soft’ vs. ‘hard’ infrastructure
Trade facilitation measures can be thought of along two dimensions: ‘hard’ infrastructure (highways, railroads, ports, etc.) and ‘soft’ infrastructure (transparency, customs efficiency, institutional reforms, etc.). A particular interest of this distinction centers on comparing the benefits and costs of investment or policy reform along both dimensions. Francois and Manchin (Reference Francois and Manchin2007) provide evidence on the benefits of reform in these two dimensions. They estimate a gravity model of international trade that includes two aggregate indices of institutional performance, and two indices of infrastructure quality. Their results suggest that both hard and soft infrastructure matter for trade performance – indeed, they appear to explain more of the observed variation in North–South trade flows than do tariffs. For low-income exporting countries, the authors find that in terms of upgrading hard infrastructure, transport is the most important area. However, as income increases, communications infrastructure becomes more important. For low-income countries, openness and protection of property rights are relatively more important than for higher-income countries. Moreover, the negative impact of government and regulatory interventions in an economy is more strongly felt in high-income countries than in low-income ones.
Large investments in hard infrastructure projects to improve infrastructure quality alone do not necessarily lead to lower transport prices. Complementary steps in regulatory reform are also important. The lack of competition along the different segments in the trade logistics chain, for example, can result in high markups favoring cartels among logistic service firms. Interest group lobbying and corruption can lead to regulatory barriers (such as market access restrictions, technical regulations, and customs regulations). Regulation in transport services can protect inefficient logistics operators and discourage the entry of more modern logistics operators with lower operational costs. Reform to dismantle cartels and enhance competition along different segments of the logistics chain is crucial to lower trade costs. In a more competitive environment, measures to improve physical infrastructure are likely to yield more significant results.
4. Using gravity estimates to compare domestic trade cost indicators
This section provides an illustrative assessment of the relative importance of trade costs using gravity model estimates. The gravity model predicts that the volume of trade between two countries is proportional to their income and inversely related to the distance between them. In addition to these core variables, gravity equations can contain other variables influencing trade, including institutional characteristics or trade policy variables. Estimates from gravity models have been used in a wide variety of applications due to the ease with which one can infer the impact of a change in an explanatory variable on trade flows. Indeed, much of the research reviewed in the previous section centers on exploring the impact of trade costs in a gravity context. One difficulty in the research on Africa in regard to trade costs is the limited data available for the region.
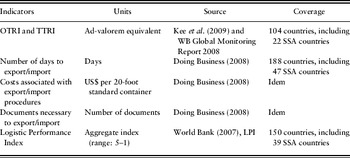
Among data surveyed in the previous section, however, three sets of indicators have reasonably good coverage in Africa. These include the trade restrictiveness indices (TRI) estimated by Kee et al. (Reference Kee, Nicita and Olarreaga2009), the trading-across-the-border indicators reported by Doing Business, and the Logistics Performance Index (LPI). Table 3 describes their main attributes.
Trade-cost indicators

In order to make the Doing Business trading-across-the-border indicators (time, number of documents, and costs of import and export procedures) comparable across countries, several assumptions are made about the shipped products and the container that contains them. Indeed, products considered in the data are not hazardous, do not require refrigeration, and do not require any special phytosanitary or environmental safety certification. In addition, the products are shipped by ocean in a dry cargo, full container load of 20 feet. The costs do not include unofficial payments such as bribes that may be involved with trading goods. Although shipping some products involves conditions that increase trading costs – such as refrigeration or observance of phytosanitary measures – the Doing Business figures on export and import costs can be thought of as lower-bound estimates. These indicators provide information on the distribution of procedural requirements for export and import across countries. Even if the Doing Business indicators measure the costs of export and import procedures of a standardized container, it is difficult to know the average value of merchandise that a country exports and imports in the container, in order to express the costs as a percentage of the value of traded products. Another database is relevant in assessing trade costs in Africa. Based on a worldwide survey of express carriers and freight forwarders, the LPI provides a snapshot of the logistic-chain performance in the surveyed countries, including those in Africa. The data set covers logistic attributes closely related to ‘soft infrastructure’ (e.g., efficiency of customs clearance, competence of local logistics industry, etc.).
To provide orders of magnitude of the relative importance of trade costs in the context of Africa, we build on Hoekman and Nicita's (Reference Hoekman and Nicita2008) database that incorporates Doing Business, LPI, and OTRI indicators to estimate a gravity model. After checking the robustness of estimated coefficients to the inclusion of different variables and to the use of several estimation methods, we employ the estimated coefficients to compute ad-valorem equivalents of diminishing the costs associated with trading a standardized container of goods, as measured by Doing Business, for the African countries in the sample (i.e., the equivalent change in ad-valorem tariff restrictiveness that leaves exports unchanged following a change in trade costs). Our counterfactual estimates offer insight into the effect of policy intervention to lower costs in the absence of more detailed measures of trade costs across products and countries.
Methodology
Several studies have provided theoretical foundations for the gravity model and contributed to its popularity. These studies show that estimates can be derived from different theoretical frameworks, such as the Ricardian, Heckscher–Ohlin, and increasing returns to scale models.Footnote 12 Theoretical foundations for estimating gravity equations were also enhanced in Anderson and van Wincoop (Reference Anderson and van Wincoop2003, Reference Anderson and van Wincoop2004). More recently, Helpman et al. (Reference Helpman, Melitz and Rubinstein2008) (henceforth HMR) develop an international trade model with firm heterogeneity. We use the HMR framework as our starting point for the empirical work. The model incorporates firms with varying productivity so that only the more productive ones find it profitable to export. In addition, profitability of exports varies by destination, as exports are higher to countries with higher demand and lower variable and fixed export costs. According to the model, the distribution of firms in country i exporting to country j is bound by a marginal firm that just breaks even when exporting to j, whereas more productive firms make positive profits when exporting to j.
The model has several appealing characteristics that make it appropriate to explain some empirical patterns of trade flows. First, the model can generate asymmetric trade flows between two countries. Second, it can yield zero trade flows between some country pairs in either one or both directions. Third, the model yields a generalized gravity equation that accounts for the self-selection of firms into export markets and their impact on trade volumes. Finally, no information on the distribution of firms in a given country is required to carry out estimates.
HMR use their analytical framework to develop a two-stage estimation procedure that generalizes the empirical gravity equation by taking into account the extensive margin (the decision to export from country i to country j), and the intensive margin (the volume of exports from i to j, conditional on exporting). The first stage consists of a probit regression that explains the probability that country i exports to country j (selection equation), where the dependent variable is a dummy that is equal to one if country i exports to country j. The second stage consists of a gravity equation estimated in logarithmic form that explains the volume of exports from i to j (outcome equation) and incorporates a term based on estimates of the first-stage, known as the inverse Mills-ratio, to correct for the non-random prevalence of zero trade flows and intra-sector firm heterogeneity.
The two-stage procedure aims at correcting for two potential drawbacks prevalent in the estimation of gravity models. First, a standard selection bias can result from the necessity to drop observations with zero trade. Second, there is a potential bias due to unobserved firm-level heterogeneity resulting from an omitted variable that measures the impact of the number of exporting firms, an aspect related to the extensive margin in the model. We follow HMR and implement a two-stage procedure to estimate our proposed gravity specification.
Gravity model estimates
We estimate a gravity model that includes the above-mentioned trade cost indicators using data from Hoekman and Nicita (Reference Hoekman and Nicita2008). The data set covers 104 importers and 115 exporters, including 22 African countries. Trade data correspond to 2006. Only for the few cases where 2006 data were not available, 2005 or 2004 data were used. Using Doing Business data on the regulations to start a business, we updated the entry costs indicator for fixed entry costs constructed by HMR to enlarge the coverage of the countries in the sample. This binomial indicator uses the sum of the relative costs for a pair of trading countries to identify high-fixed cost country pairs, in which the sum of costs is above the median for both countries. By construction, this variable reflects regulation costs that should not depend on a firm's volume of exports to a given country, and satisfies the exclusion restrictions by being included in the first stage selection equation and excluded from the outcome equation in the second stage.Footnote 13
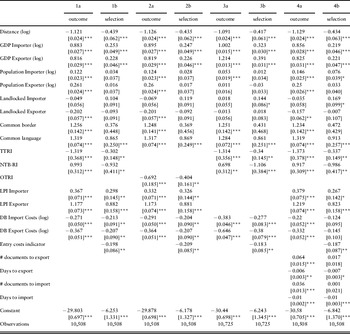
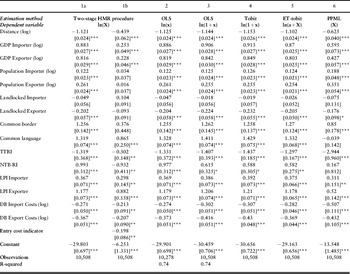
Table 4 reports estimates of the selection and outcome equation using this two-stage procedure for a series of specifications aiming at checking the robustness of the estimates. Nearly all the estimated coefficients in the outcome equations for the specifications in Table 4 are statistically significant and have the signs expected in gravity models. As confirmed by the estimates, trade volumes are positively related to partners' GDP as well as population, and negatively related to distance. Landlocked partners trade less. In the case of landlocked importers, however, the dummy coefficient is not significant. Countries sharing a border and a language also tend to trade more.
Gravity estimates (2-stage HMR procedure)

Note:* significant at 10%; ** significant at 5%; *** significant at 1%. Robust standard errors are in brackets.
All regressions are estimated using the PPML estimation method.
Columns 1a and 1b report estimates of the outcome and selection equation for our baseline specification that includes LPI and Doing Business trading costs for importers and exporters. TTRI and NTB-RI are expressed in levels rather than in logarithms – a convenient choice to compute ‘ad-valorem equivalents’. Some variables are not significant in the selection equation but remain significant to explain the volume of trade, such as population, the landlocked dummy, and the border dummy. The coefficient of the entry-costs indicator is significant and negative in the selection equation, as a pair of countries with high entry costs for exporters is less likely to trade.
Clearly, the higher the trading costs of exporting and importing as measured by Doing Business indicators, the lower the propensity to trade and the lower the volume of traded goods. Similarly, the positive and significant LPI coefficients for exporters and importers corroborate the favorable impact of a country's logistics environment on trade. As to trade restrictiveness indicators, the coefficient of TTRI is negative in the outcome and selection equations, whereas the NTB-RI seems to have a positive impact on the propensity to export but a negative impact on the volume of exports. The mixed signs of the NTB-RI coefficients may be due to two reasons. First, the NTB-RI is positively correlated with the TTRI and the coefficient of the latter may be capturing some effect of the former in the outcome equation. Second, the NTB-RI is a less reliable measure of protection than the TTRI, as the raw data used to construct the NTB-RI is less reliable than the tariff data used to construct the TTRI.
In specification 2, TTRI and NTB-RI are replaced by OTRI, the sum of the two figures. The OTRI coefficient is negative and significant in both equations, which confirms the negative impact of restrictiveness on trade.Footnote 14 When LPI data are excluded in specification 3, the Doing Business export and import cost coefficients become larger in absolute value. Finally, specification 4 incorporates the other Doing Business variables related to trade costs: the time and the number of documents required to export and import. Among their estimated coefficients, only the coefficients of the time to import and export are both significant and with the expected signs. However, trading cost coefficients become non-significant in the selection equation. These variations are likely due to the high correlation among the included Doing Business indicators.
We also check the robustness of estimates to the choice of alternative econometric methods. Table 5 reports estimates using alternative methods and reproduces in column 1 the first specification of Table 4, which is our baseline estimate. Column 2 reports OLS estimates when a logarithmic transformation is applied to exports (ln(X)) in order to ensure comparability of coefficients.Footnote 15 However, the use of logarithms brings in a truncation problem in the dependent variable, leaving out observations with zero-trade values. To address this issue, a standard solution in the literature consists of shifting all export values by one dollar before applying the logarithmic transformation in the dependent variable of the equation (i.e., ln(1+X)), which increases the mean of exports by one unit, but does not affect its variance. In addition, observations with zero-trade values are linked to zero-values in the dependent variable. OLS estimates with this correction in the dependent variable are reported in column 3. Nevertheless, using OLS under these circumstances may lead to biased results if the number of zero-value observations in the dependent variable is large. Tobit estimation, reported in column 4, appropriately accounts for the censorship of the dependent variable. Nonetheless, as noted by de Melo and Portugal-Perez (Reference Portugal-Perez2008), coefficient estimates can be very sensitive to this (arbitrary) choice of adding one dollar in the presence of a large number of zero-trade value observations. Indeed, if instead of one dollar a different amount is added to exports before the logarithmic transformation to avoid truncation (say, one cent, or ten cents, or ten dollars), all coefficient estimates may vary significantly. Eaton and Tamura (ET) (Reference Eaton and Tamura1994) propose to estimate a variation of the Tobit model in which the independent variable is the log of exports added by a parameter ‘a’ that is endogenously estimated.Footnote 16 Column 5 reports estimates of this ET–Tobit model. Since our sample does not contain a large proportion of observations with zero-trade values, coefficients estimated with these techniques do not vary greatly, as seen in Table 5.
Robustness checks of different estimation methods

Note: Robust standard errors are in brackets.
* significant at 10%; ** significant at 5%; *** significant at 1%.
Finally, column 5 reports results of the Poisson Pseudo Maximum Likelihood (PPML) estimator recommended by Santos Silva and Tenreyro (Reference Santos Silva and Tenreyro2006) to deal with heteroskedastic errors in log-linear gravity models.Footnote 17 The magnitude of coefficient estimates varies the most when using this technique, although nearly all signs remain as expected. In particular, coefficient estimates for TTRI and Doing Business are greater. A possible explanation is that the dependent variable to carry out PPML estimation is in levels rather than in logarithmic form, which gives more weight to extreme observations.
Ad-valorem equivalent estimates
As the gravity model contains TTRI, a measure of tariff restrictiveness in ad-valorem terms, the coefficient estimates are used to compute counterfactual ad-valorem TTRI variations that would otherwise be generated by a variation in Doing Business trade cost figures for a given country.Footnote 18 To illustrate how these counterfactuals are constructed, suppose that regulatory reform or investment in an exporter country leads to a 1% reduction in reported Doing Business export costs. This leads to a change in trade flows of about 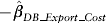 percent according to gravity estimates.Footnote 19 The same change in trade flows would be brought about if importers cut the tariffs applied to imports from this country by an equivalent value of the TTRI equal to
 .Footnote 20 Therefore, the latter figure roughly represents the ‘tariff-cut equivalent’ or ‘ad-valorem equivalent’ of a 1% change in the cost of export procedures inferred from gravity model estimates.
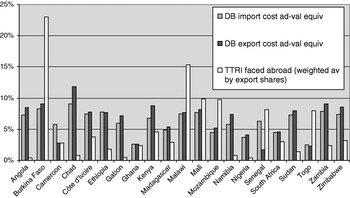
We use estimated coefficients of the outcome equation in specification 1 (Table 4) to compute the ‘ad-valorem equivalent’ reduction in the costs of both export and import procedures for each African country in the sample halfway to the level of Mauritius, the country with the lowest costs along these measures.Footnote 21Figure 8 reports these estimates as well as the average value of TTRI faced abroad by each African exporter weighted by its export share. Although the latter figure is rough and dependent on the composition of exports across destinations, it provides a helpful summary of tariff restrictiveness faced across destinations by each African exporter.
Average TTRI and estimated ‘ad-valorem equivalents’ of an improvement in LPI and Doing Business exports

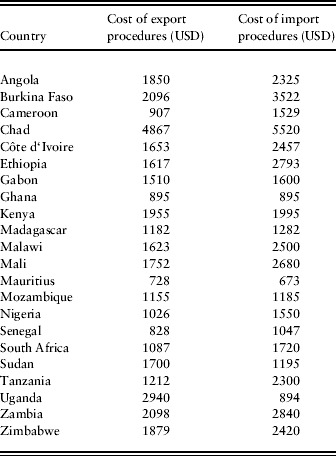
For most countries, the ad-valorem equivalent of the change in export costs is larger than the change in import costs. This is a consequence of the estimates of the elasticity of export and import costs with respect to trade flows,Footnote 22 even if the table in the Appendix shows that the cost of importing a standardized container of goods is larger than the cost of exporting a similar one for countries other than Mauritius. As illustrated in Figure 8, for most of the countries, the cut in export costs is more important than completely canceling the tariff barriers they face, as measured by the TTRI of importers.
Consider the case of Ethiopia if its logistic environment were to improve so that the import costs measured by Doing Business were cut halfway to the level of Mauritius. The equivalent change in imports would be brought about by a reduction in Ethiopian tariffs of about 7.8%, assuming the composition of import volumes across partners does not change.Footnote 23 Similarly, if costs of exporting the standardized container in Ethiopia were cut halfway to the level of Mauritius, the change in exports would be equivalent to the one triggered by an average cut in the TTRI it faces of about 7.65%. This figure is substantial for Ethiopia as it faces an average TTRI of 1.85%.
It is also worth noting that such an exercise produces illustrative estimates. The standard caveats for gravity estimates hold, such as the appropriateness of the constant elasticity functional form, the dependence of the value of estimates on the choice of independent variables, and so on. However, constant elasticity gravity models are standard in the literature, and the estimated coefficients used to compute the ‘ad-valorem equivalents’ seem stable across specifications and a specification leading to ‘conservative’ estimates is retained.
5. Conclusion: looking ahead
High trade costs prevent the full realization of the gains from expanding global trade opportunities. This is particularly true in regard to Africa, which has some of the highest trade transactions costs among all developing countries. Action to lower trade costs and facilitate trade is critically important today. World trade is projected to decline in 2009 for the first time since 1982. Steps to reform regulatory barriers to trade that raise trade costs, such as those outlined in this paper, can help facilitate exports and imports at a time of significant stress in the international economic environment. The agenda over the short and long term to stabilize the world economy and support trade growth is especially important to Africa. As reviewed here, both regulatory barriers and costs of inadequate infrastructure raise trade costs in the region. The aid-for-trade agenda, collective global programs to support the poor during the crisis, and trade policy talks can productively address trade facilitation as part of the new approaches to mitigate the crisis.
This paper outlines important links between trade costs and poverty that are ever-more important today. Farmers that are able to better support high-yield export crops are on average less poor than farmers more oriented toward subsistence activities, as shown by Porto (Reference Porto2008). High trade costs in Africa prevent farmers from moving into production of major export crops. Policies to reduce trade costs and encourage marketing activities in rural areas can be useful to facilitate exports and reduce poverty. Examples include expanding roads, access to marketing information, and measures that promote the development of market arrangements as Porto has shown.
The empirical research reviewed here suggests that important gains can be achieved in Africa through trade facilitation reform. Estimates in this paper suggest that improvements in trade logistics to cut trade costs for the less advanced African countries to a level comparable to more advanced countries in the region could be more important in terms of trade expansion than a reduction in tariffs. New analysis, for example, indicates that increasing South Africa's capacity in trade facilitation half-way to the high-income country average would increase trade by an amount equivalent to the effect of South Africa's trading partners decreasing their tariffs on imports by 18.94% (Wilson et al., Reference Wilson, Portugal-Perez and Taylor2009). In sum, unilateral action and domestic reform matter for Africa.
It is also important, however, to place the discussion of trade costs in the context of multilateral trade negotiations. Successful completion of the Doha Round of the WTO that achieves cuts in agricultural barriers, for example, would benefit Africa. The Doha Agenda also includes talk on a trade facilitation agreement that would increase the transparency of trade rules with a goal of lowering trade costs. Success in this agreement is also important in regard to Africa's domestic and international agenda to expand trade opportunities.
Despite the unfavorable factors reviewed here, there are potential good prospects for growth in Africa over the long term. Apart from the oil producing nations, some countries have been experiencing strong growth, in part with global price increases in primary export commodities. This worldwide increase in commodity prices has been engendered in large part by the rapid growth of developing countries in Asia, especially China and India, before the financial crises. Their demand for these commodities is likely to recover when the world economy moves beyond recession. A number of countries in Africa are diversifying their exports. The region no longer relies solely on exports of a few raw commodities. Exports are increasingly composed of light manufactured goods, processed foods, and services such as tourism and call centers. Some countries – such as Nigeria and South Africa – have been increasing their shares of exports in technology-based products, as noted by Broadman (Reference Broadman2007). Lowering trade costs to take advantage of future opportunities is part of the context in which African trade and development prospects can strengthen over the long term.
Appendix
Doing business cost of import and export procedures for African countries in the sample

Source: World Bank Doing Business (2008).
 be the estimated elasticity of imports with respect to the variable X entering in the gravity equation. In the case of Doing Business export costs, the estimates should be negative.
 being larger than
 in absolute value, a 1% cut in export costs would increase exports more than imports induced by a 1% cut in import costs.