

As noted in the introduction to this special issue, there is a growing recognition that democratic states struggle to maintain their vitality and legitimacy; they appear as politically dysfunctional. There can be many causes for this perceived dysfunctionality: Jones and Matthijs (Reference Jones and Matthijs2017) point to the important role played by a decline in solidarity; others point to a receding faith in democratic institutions (and their capture by economic elites); the hollowing-out of national sovereignty by the forces of globalization; the rise of populist, anti-establishment, parties; and so on. The modern democratic state, it seems, has difficulty satisfying the demands of its citizenry.
In Europe, these concerns are often packaged with reference to a democratic deficit.Footnote 1 As with other democratic states, only more so, the forces of economic integration have made it difficult for European elected officials (at the national level) to satisfy the economic and political desires of their citizenry. As the EU encourages and facilitates political and economic integration, it necessarily undermines the sovereign reach of its component (and more representative) governments.
I believe that there are two concomitant developments that help to explain political dysfunction in Europe. First, and most obviously: there has been an ongoing transfer of political authority from democratically accountable national parliaments and governments to European-wide institutions that are further removed (e.g. geographically) from the people they represent. Worse still, many of these EU-level institutions lack democratic legitimacy. Second, Europeans are beginning to feel squeezed by the shrinking democratic scope that accompanies any process of economic liberalization. As governments embrace rules over discretion, they lose discretionary (read democratic) influence over policy and outcomes. In short, democratically elected governments in Europe are less able to influence their own national contexts, and these very governments are becoming less germane for determining political and economic outcomes in Europe.
Europe’s dysfunctionality was clearly evident in its response to the recent financial crisis, as member states and EU officials seemed paralysed by the scope of the challenge. In the face of rising unemployment levels, and the exorbitant costs of bailing out their financial sectors, one member state economy after the other was choked by austerity, for lack of any real policy alternatives. When forced to choose between prioritizing the needs of domestic constituents, or those of the international financial community, Europe’s political elite consistently sided with the latter, or were replaced by technocrats when they dithered.Footnote 2 Even clear electoral mandates for policy reform, such as the Irish general election in February 2011, were unable to deliver the change they promised.Footnote 3 It is no wonder that a majority of Europeans feel that their voice does not count in the EU,Footnote 4 and a majority of British people voted to exit the EU.
Clearly, if the EU hopes to overcome its democratic deficit, it will need to modify its practices and institutions, such that the voice of European voters can be better heard. Recent efforts to extend the influence of the European Parliament, and to increase transparency in European policymaking, are aimed at these important objectives. While these types of solutions are welcome, they only address one component to the democratic deficit: institutional deficiencies at the EU level.Footnote 5 Citizens of Europe’s sundry member states are still left with national governments that are losing their sovereign grip. Worse, the very size and heterogeneity of the European Union will complicate any effort to generate democratically responsive solutions: local challenges will necessarily vary and resist any common solution generated by a distant and larger body in aggregate.Footnote 6
While the challenge to representative democracy may be especially evident in Europe, so too is one possible solution. Unlike states in the international system, the European Union offers its residents the right of expatriation:Footnote 7 the freedom to vote with their feet, from one member state to another. This freedom provides Europeans with a democratic safety valve and the opportunity to retract consent from one government (and grant it to another). This right of expatriation is a costly one – in that most people will not resort to it if they enjoy access to other channels of influence – but it is a significant one, linked to the heart of the European project.
When suffering under dysfunctional government – that is, governments that either cannot or will not address their people’s needs – Europeans can wield a powerful corrective tool. In voting with their feet, Europe’s migrants reveal a dirty little secret at the heart of Europe: that some member states are not doing a very good job at providing for their citizens’ needs, and that voting offers little recourse for righting those wrongs. Just as important, Europe’s migrants can help resolve the political inadequacies from which they flee by providing a clear signal about their political preferences and by shining a spotlight on those EU member states that are most (and least) successful in delivering desirable outcomes. In the doing, we can shift the public’s perspective on migration from fretting over where migrants are heading, to understanding why (and from where) they are fleeing.
This article examines recent migration patterns in the EU in an effort to pinpoint Europe’s most dysfunctional states. I offer a novel and controversial argument, and a brief investigatory check. By doing this, we consider a series of related questions: To what extent can/should migration be read as an extension of political voice? If internal migration offers a surrogate measure for political dysfunction, what does the pattern of migration tell us about the quality of governance across Europe? Which EU member states are able to provide for their citizens’ needs, and which are sending them packing?
THEORETICAL MOTIVATIONS
There are many reasons why people migrate, and migration studies are famous for their propensity to undertheorize. Migrants can be pushed and pulled by any number of political, economic and social factors, or they can be seen as small parts in elaborate networks. Given the nature of contemporary migration restrictions, many migrants are also motivated by family reunification. Consequently, migrants relate to their countries of origin in different ways (some will maintain strong ties after emigration) and display varying levels of commitment (political and otherwise) to their host country.Footnote 8
I wish to avoid this quagmire and to posit a very simple view of migrants: that their actions signal political consent. In doing so, I do not mean to suggest that migrants cannot be motivated by other factors (e.g. family reunification and/or sunny beaches), or that some migrants will maintain strong ties to friends and family at home. I am trying to simplify what is necessarily a very complex phenomenon. In the context of a Great Recession, it does not seem unreasonable to interpret migration as a political signalling device.
In particular, I suggest that we can interpret emigration as a surrogate indicator for dysfunction. On leaving their country of origin, migrants are tacitly withdrawing their consent for that regime. This is clear with respect to refugees, but it is also true of so-called economic migrants, who flee desperate situations born of poor economic stewardship.Footnote 9 On leaving home, migrants signal a protest to the leadership (political, economic, social etc.) of the state from which they flee. On choosing a new state of residence, migrants provide a tacit vote of confidence in the leadership for the state that they enter.
Consent plays an important role in democratic thought, if not always in contemporary practice (Moses Reference Moses2009). Since at least John Locke, Western thinkers have recognized that consent for government can take two main forms: explicit and tacit. Unfortunately, the modern state system provides little recourse for either type of consent: our influence is mostly limited to voice (whose effectiveness varies significantly).Footnote 10 The democratic promise of the EU lies in the possibility of exit, which provides citizens with a real opportunity to signal (or withdraw) consent to political power. In granting this consent, migrants signal their commitment to the host community (and with this, solidarity). This opportunity is mostly absent in the rest of the world,Footnote 11 so it must not be undervalued.
This proposition will not be controversial when applied to those migrants who seek asylum in Europe (from abroad); after all, we assume that refugees are fleeing unresponsive states in which the political voice of the citizenry was muted and where policymakers showed little regard for political dissent or difference. Recall that the legal definition of a refugee is one:
owing to well-founded fear of being persecuted for reasons of race, religion, nationality, membership of a particular social group or political opinion, is outside the country of his nationality and is unable or, owing to such fear, is unwilling to avail himself of the protection of that country; or who, not having a nationality and being outside the country of his former habitual residence as a result of such events, is unable or, owing to such fear, is unwilling to return to it.Footnote 12
A stream of refugees sends a clear political signal: these migrants are fleeing dysfunctional states and seeking refuge in preferable states. Recognizing this, we should be studying the size and makeup of migrant flows, with an eye to stopping them at their source. Our attention should be drawn to what we can do in Syria and Afghanistan (but also Romania and Lithuania) in an effort to improve the conditions that provoke migration. Likewise, on the receiving end, we need to be more aware of what political and economic features attract migrants. Given the options available (i.e. that there are many such states to choose from), when a refugee prioritizes entry into one state over another, s/he is signalling a preference for that state. That preference may be grounded in something as simple as familiarity with the language spoken, nearness to the origin country, or the fact that friends or family members already await them there. But even these seemingly individual and personal preferences reflect regime characteristics (e.g. an openness to strangers, a more international attitude) that signal political preference.
It is more controversial to assign political motives for those migrating within Europe.Footnote 13 After all, EU member states are representative democracies that have sworn to protect human rights and liberties, and we expect them to satisfy the needs of their constituent citizens. But what if their governments cannot, or will not, satisfy those needs? What if voting is no longer seen to be an effective means to influence relevant outcomes? What if governments are no longer able to manage their national economies in a way that can secure economic well-being for their people? What recourse, then, does the dissatisfied citizen have? I suggest that when voting or voice becomes ineffective, and exit is an option, we should expect to see Europeans fleeing dysfunctional states.
As with the motivation of international refugees, the motivation for internal European migrants can vary significantly: migration might be driven by family reunification, the need for work, the existence of diasporic transnational networks, strong language connections, or even by a sense of adventure. As I suggested in respect of international refugees, these apparently personal motives can also be linked to a level of dissatisfaction with the nature of politics at home. Consider, for a moment, what motivates the internal migration that is propelled by family reunification. What could have prompted other family members to have (earlier) left the country of origin? What message might they have sent to encourage other family members to follow? Why is the family reunification occurring in the foreign (host) state, and not at home? Those who are familiar with the ‘America letters’ from European immigrants in the US at the end of the nineteenth century will recognize how very personal motivations are often embedded in deeper political concerns about the scope of opportunity available ‘at home’ (Moses Reference Moses2011: ch. 5).
When migration is motivated by the lack of economic opportunities at home, the implied political criticism is more apparent. Citizens should expect their government to provide a stable economic environment – one that can secure their livelihood. If elected officials are unable or unwilling to secure that environment, we can expect citizens to raise their voice to policymakers, in hopes of being heard (and securing change). But when voice fails – or falls on deaf ears – the disgruntled citizen must find alternative solutions. When citizens leave their home state in search of better economic opportunities abroad, they are clearly broadcasting their political dissatisfaction.
It is important to note that migration is neither a simple nor an easy solution. Most people will prefer to remain near their friends and family, and secure their livelihoods under familiar conditions. Voting or protest will almost always trump migration in the initial calculations of dissatisfied citizens. In this light, we can assume that migration is a desperate political act; it is a decision that is not made lightly; and we can expect it only after several other options have been tried and proved unsuccessful. As exit is extremely costly (e.g. emotionally, financially, socially), the signal it sends should not be discounted or ignored.
The way I have framed this problem is borrowed from Albert Hirschman (Reference Hirschman1970, Reference Hirschman1993), whose work has been an inspiration for me on several earlier occasions (Moses Reference Moses2005, Reference Moses2006, Reference Moses2011). Hirschman wished to provide decision-makers with the sort of information they need to reform their organizations, in the face of what he assumed was the inevitability of entropy. For Hirschman, all organizations – whether they are states, firms, political parties, and so on – are prone to entropy: they need to adapt constantly, or risk eventual demise. For this reason, decision-makers need to rely on the signals sent by dissatisfied consumers of the goods they provide (whether they are the rights of citizenship, the quality of a service provided, or the nature of a political platform to be embraced). I am proposing that we do the same: rather than seeing migrants as a potential threat to democracy, we can use them to gauge the quality of government in (and its variance across) Europe.
This sort of political signalling is also the hallmark of so-called Tiebout studies,Footnote 14 which gauge how citizens choose among competing packages of locally provided public goods (tax levels, quality of schools and parks, zoning policies, etc.). In Tiebout studies, local governments are assumed to be responsive to local populations and they offer sundry packages of government services, each at a different price (tax rate).Footnote 15 Mobile citizens choose the particular tax/services package that best fits their needs/preferences by moving to that location. By so doing, mobile citizens sort themselves into optimum communities (i.e. some of us prefer more developed (read expensive) welfare states; other prefer less so).
In either framework, migration trends reveal important signals about political preference – signals that are akin to (and maybe even more effective than) voting. Because European citizens are free to move around the continent unhindered,Footnote 16 we can use this movement to gauge the degree to which European states satisfy their citizens’ needs (and which do not). In this context, Europe provides an interesting prototype of how we might strengthen democratic influence by allowing exit to fortify voice in facilitating change.
MIGRATION PATTERNS IN EUROPE
In this section we examine the nature of migration patterns in Europe, from an ‘exit as voice’ perspective. This examination contains three parts. We begin by looking at the character of external migration (asylum flows) to the European Union. This examination is brief, in that it requires little elaboration: by breaking down and examining the external migration flows, we can clearly see which states in the global system are dysfunctional, and which states in Europe are most attractive.
The second section then zeros in on those European countries that are attracting the most (internal and external) migrants. If we interpret migration as a signalling device revealing political preferences, these states offer Europe’s most attractive citizenship bundles. The third section then turns to the EU member states that are shedding citizens. These states can be identified as the EU’s most dysfunctional states.
Asylum Patterns
We begin by tracking asylum applicants to Europe, as the resulting pattern provides an unambiguous case of political signalling. In these circumstances it is clear that people are voting with their feet: people are fleeing political persecution and repression, and seeking to stake out a new life under better circumstances.
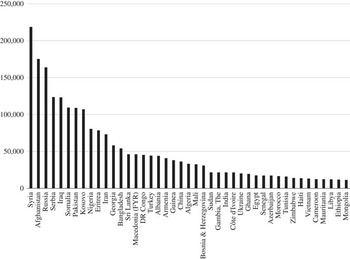
Figure 1 provides an overview of where Europe’s asylum applicants originate in the period 2008–14. Not surprisingly, most asylum applicants were from war-torn Syria and Afghanistan. More unexpected, perhaps, is that Europe’s neighbours (in the form of Russia, Serbia and Kosovo) are also among the top 10 asylum generators. In effect, Figure 1 provides a list of the most dysfunctional states for the period under consideration. There is a surprisingly large number of dysfunctional states in the world, and this figure includes only those states that have sent more than 10,000 asylum-seekers to Europe. Indeed, between 2008 and 2014, Europe received 2,422,115 asylum applications from 186 states – and another 37,115 from stateless applicants (Eurostat [migr_asyappctza]).
Total Asylum Applicants, 2008–14, by Country of Origin Note: Only those countries who have more than 10,000 asylum-takers registered. Source: Eurostat [migr_asyappctza]

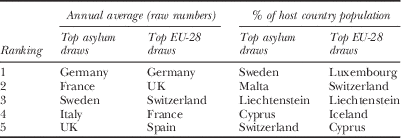
Where did these migrants seek refuge? One might expect that geographic proximity (to the state of origin) is an important consideration when seeking asylum, but the ranking in Table 1 suggests otherwise. Asylum-seekers recognize that some states are more generous and provide better protections than others, and they tailor their asylum applications accordingly. In terms of overall numbers, the most attractive states in Europe for asylum-seekers are Germany, France, Sweden, Italy and the UK (in that order).
Asylum and New Asylum Applicants: Annual Aggregated Data (Averaged 2008–14) and Per Capita

Note: The top five states (in terms of annual average asylum numbers) are indicated by italics. The per capita figures take the 2008–14 average (from the middle column) and divide it by the 2014 population of the host country, multiplied by 100. Hence, in the country most exposed to refugees, Sweden, the annual refugee flow between 2008 and 2014 constituted less than one half (0.43) of one per cent of the total population.
Sources: Eurostat [tps00191] and [demo_gind].
Table 1 ranks countries by the relative size of the asylum stream, given the host country population. Here we see that a whole new set of states reveal themselves to be more attractive (relative to their size): Sweden is the most attractive state, followed by Malta, Liechtenstein, Cyprus, Switzerland and Norway. As with the overall rankings (which are dominated by large states), it is reasonable to assume that these states offer the most attractive citizenship packages for asylum-seekers, in part because their asylum policies may be more liberal than in other states. What is curious about this list is that small states are carrying such a large share of the burden, and that many of the most attractive states find themselves outside of the European Union (Liechtenstein, Switzerland, Norway). Malta and Cyprus are the only countries on this list that are geographically exposed to recent migrant flowsFootnote 17 – the other states are clearly drawing migrants because of what they offer (they are not, in other words, casualties of geographic consequence).
Europe’s Magnet States
In 2013, a little more than 3.4 million people had immigrated to EU member states, with the UK, Germany, Italy, Spain and France being the largest destination countries (in that order).Footnote 18 In the UK, for instance, most of the immigrants were citizens of Poland (14.8 per cent), followed by India, Ireland, Pakistan and Lithuania. In other words, and as we might expect, the largest countries in Europe are attracting the largest numbers of immigrants (in total), and they are attracting immigrants from both within the European Union, and beyond. It could be that migrants are most attracted to large states, given their more cosmopolitan features and the increased likelihood of finding a suitable immigrant milieu/ghetto in which to settle. But if we control for size (by dividing the immigrant figures by the population of the host country), we get a better picture of the inherent country features that attract European migrants. When this is done, the most attractive destination countries are very small countries: Luxembourg, Cyprus, Switzerland, Liechtenstein and Malta (in that order).Footnote 19 In Luxembourg, for example, most immigrants came from Portugal (21.7 per cent), followed by France, Belgium, Italy and Germany – the first non-European source of immigrants to Luxembourg was the US.
While interesting, these figures and rankings are far too rough for our purposes, as they include return immigrants and immigrants from non-EU member states. Indeed, in several countries (e.g. Romania, Lithuania, Latvia, Estonia), a majority of the immigrants in 2013 were nationals returning home. In other countries (Italy, Bulgaria, Slovenia, Sweden), the majority of immigrants in 2013 were from non-EU states.
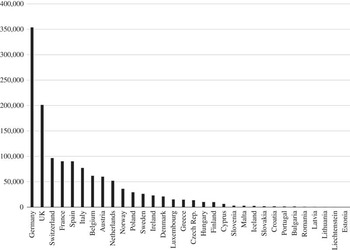
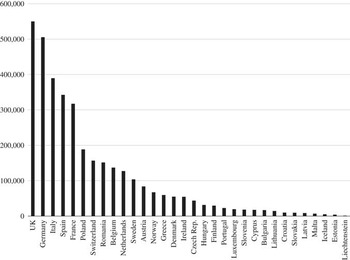
If we focus solely on the immigrants from other EU member states, the total number of EU immigrants shrinks to just 1.2 million people, or about 0.24 per cent of the total (EU-28) population in 2013.Footnote 20 When we examine the national backgrounds of these (internal) EU migrants, then the geographic pattern varies slightly from the overall immigration trends described above. Figure 2a lists European states in order of the number of immigrants in 2013 who were citizens of (other) EU-28 member states.Footnote 21 Here we see that the most attractive destinations included large states (Germany and the UK), but also Switzerland (which is a non-EU member state and relatively small).Footnote 22
Total EU-28 Immigrants, 2013 Source: Eurostat [migr_imm1ctz].

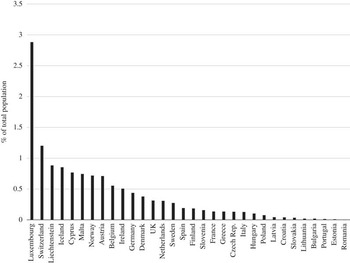
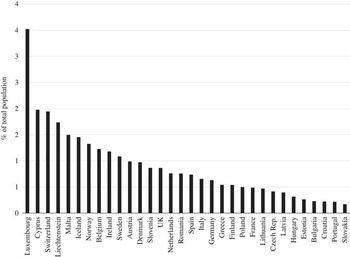
The pattern becomes even more surprising when we weigh these internal EU-immigration figures by the total population, and rank the states accordingly (as is done in Figure 2b). In light of the discussion from the previous section, this is probably the best indicator for capturing those states that offer the most attractive citizenship bundles for EU citizens voting with their feet.
EU-28 Immigrants, % Population, 2013 Sources: Eurostat [migr_imm1ctz] and [demo_gind].

In Figure 2b, Luxembourg towers above the other states, with an impressive share of immigrants (almost 3 per cent of its total population consists of citizens from other EU-28 member states). Given Luxembourg’s unique status as a wealthy international hub (Luxembourg tends to top the global GDP/capita tables (see also Figure 4b, below), and the City of Luxembourg is the seat of several EU agencies and institutions), this is not too surprising. What is surprising, however, is the list of small countries that follows in Luxembourg’s wake: Switzerland, Liechtenstein, Iceland, Cyprus, Malta, Norway …). Not only are these countries very small, but four of the top seven host countries of EU-28 immigrants are not members of the European Union! Without ignoring other potential determinants for migration, we can say that all of these states are seen to be attractive and successful polities: people want to live there.
If we use this indicator as a measure of political attractiveness in 2013, what kind of states are appealing to Europe’s politically alienated? The sundry rankings are listed in Table 2, to ease comparisons. Here we can see that foreigners seem to be attracted to large, relatively wealthy states with robust economies (such as Germany and the UK, with Spain being the possible exception). These are the same states that are attracting asylum-seekers, as we saw in Table 1. Indeed, there is a surprising degree of overlap across the list of top five states receiving asylum-seekers and immigrants from the EU-28. The two surprises, I would say, are Sweden (among asylum havens) and Switzerland (as an EU-28 magnet): as these are both relatively small states.
Most Attractive States in Europe, 2013

When we turn to the two columns at the right-hand side of Table 2, which rank states in terms of their draw (relative to the domestic population), we see that wealthy states tend to dominate both of these lists (Malta and Cyprus being the exceptions), but that these states tend to be very small. Here too there is significant overlap across the two rankings, with non-EU states (such as Switzerland, Lichtenstein and Iceland) doing surprisingly well.
Europe’s Dysfunctional States
It is remarkably difficult to find good emigrationFootnote 23 figures, even within the EU; it seems that counting those who leave a country is harder than counting those who enter, and so-called mirror statistics (which compare immigration and emigration statistics) tend to reveal as much. To estimate the emigration destinations of those Europeans who are voting with their feet, I have had to conduct a number of tedious recalculations.
Using the EU’s population statistics for 2013, we can examine the population on 1 January 2013, by citizenship (using Eurostat’s [migr_pop1ctz]). This is one of Eurostat’s favourite means of measuring internal emigration.Footnote 24 Taking the citizenship makeup for each of the EU-28 member states as my point of departure, I then factored out the domestic population (citizens of the home state) and generated emigration statistics for each of the other member states. Breaking down the population statistics in this way shows us where citizens from individual member states are choosing to reside abroad (in other member states). For example, we can learn that there were 23 Belgian citizens living in Latvia in 2013, while 28,209 Belgians had moved to the Netherlands. This reveals something about the attractiveness to Belgians of settling in the Netherlands, relative to Latvia.Footnote 25
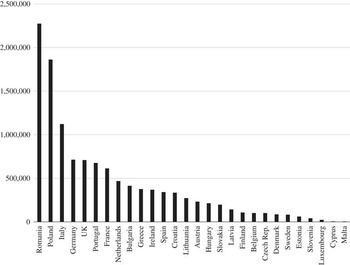
Figure 3 ranks Europe’s most dysfunctional states, in terms of total number of emigrants, and as a percentage of the home population. In Figure 3a, we find that the EU’s largest overall exporter of citizens was Romania (2,271,379), followed by Poland, Italy, Germany and the UK.Footnote 26 When we examine more closely where emigrants were choosing to re-settle, we find that the top 10 destinations for all of these countries were remarkably similar: relatively wealthy states, with developed markets such as Switzerland, Austria, UK, the Netherlands, Belgium, Italy, Sweden, Norway, Denmark, etc.Footnote 27
Europe’s Dysfunctional States: Emigration to EU-27, 2013 Note: Registered number of citizens living in one of the other EU-28 member states in 2013. The study includes all EU-28 countries (as is seen along the horizontal axis), but the emigration figures are calculated by looking at the out-migration from one member state to the other 27. Source: Eurostat [migr_pop1ctz].

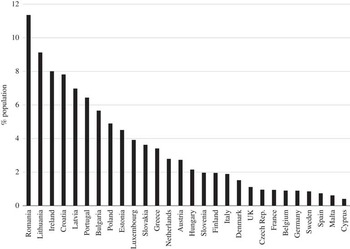
For our purposes, it is more interesting to look at the share of the population in any country that seems to be dissatisfied with conditions at home. Figure 3b provides the best measure of Europe’s most dysfunctional states, in that it lists states in terms of their per capita emigration rates to other EU member states. When this is done, we see a large number of states that appear unable to provide for their citizens’ needs. I find it astonishing that almost 11 per cent of Romania’s population (over 2 million people) is now living in another EU member state. The share of Lithuanians, Irish, Croatian and Latvians who have left home in search of better conditions is lower, but equally shocking. For whatever reason, these countries are not able to satisfy the needs of a significant share of their population.
Europe’s Dysfunctional States: Emigration, as % of Origin Population, to EU-27, 2013 Note: Registered number of citizens living in one of the other EU-28 member states in 2013. The study includes all EU-28 countries (as is seen along the horizontal axis), but the emigration figures are calculated by looking at the out-migration from one member state to the other 27. Source: Eurostat [migr_pop1ctz] and [demo_gind].

We can now see which states in Europe are able to attract mobile Europeans and which states are repelling them. In the next section we consider whether it is reasonable to attach political significance to this internal mobility. Does the flow of migrants within the EU signal the ineffectiveness of voice across Europe?
EXIT AS VOICE
To what extent is it reasonable to interpret exit in Europe as a form of political voice? This section tries to answer that tricky question by looking at how emigration relates to several economic and political variables. Given the exploratory nature of this project, and the remarkable paucity of data, I rely on simple bivariate scatter plots to consider the degree to which political and economic indicators of strife are related to per capita emigration figures (to other EU member states).
Economic Variables
When applied to economic conditions, the argument for exit as voice rests on two, related, observations.
First, we should recognize that states in Europe lack many of the discretionary tools that were once used to secure full employment and economic stability (Moses Reference Moses2015). To facilitate economic integration (and consistent with the neoliberal economic logic that drives it), the EU has slowly outlawed the sort of protectionist measures that states once used to achieve domestic economic growth (e.g. public procurement projects, infant industry protections, local content requirements and industrial policies, etc.). More obvious has been the need to jettison domestic monetary policy (and politically responsive central banks) as part of the effort to secure a monetary union in Europe. Now, in the wake of the recent crisis, additional constraints are being drawn up to limit the capacity of states to pursue counter-cyclical fiscal policies.Footnote 28 In short, member states can no longer employ the policy instruments that they have traditionally used to secure economic stability. As a result, politicians find themselves at the mercy of market conditions.
This brings me to the second point. As member states are no longer able to manage their domestic economies, elected officials can no longer be held accountable for economic failure. Consequently, the outcomes of national elections mean less for the national economy – as the most relevant policy decisions are now being made in Frankfurt or Brussels. If national policymakers have less influence over real economic outcomes, then there is less incentive to influence them by traditional channels of voice (voting, lobbying, public advocacy, etc.). In this context, exit is more effective than voice in securing (personally) preferable economic outcomes (at least in the short term).
Imagine you are a citizen of contemporary Greece, in the midst of a deep economic crisis, and mainstream political elites are informing you that the only possible remedy is an internal devaluation, or wage squeeze, which will probably take several years before it has the desired effect on your country’s international competitiveness. As a citizen of Greece, what can you do to improve your circumstances? You might vote for more populist and/or radical parties, only to find that they cannot deliver what they promise; you could protest and/or abstain from the mainstream political process, but this hardly changes matters on the ground. It seems to me that there are only two options available: stay and suffer (while you pray for long-term improvements); or leave for greener pastures. In this context, exit represents a vote against the status quo. Migrants are demonstrating that they lack confidence in the ability of elected officials to turn things around – and are heading out on their own (despite the significant personal costs incurred).
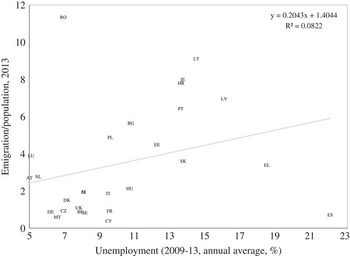
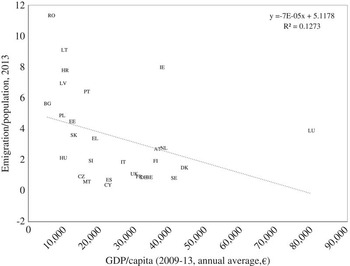
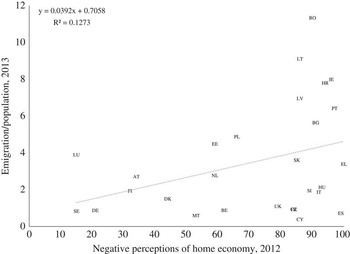
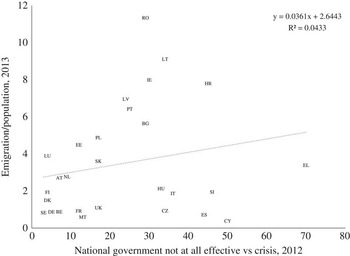
To examine the relationship between economic mismanagement and emigration, Figure 4 provides scatter plots of the level of internal EU migration (emigration/population, as depicted in Figure 3b, above), and a series of economic variables. My intent with these scatter plots is not to exaggerate causal linkages, but to provide readers with an opportunity to see the general patterns, and how individual member states relate to these patterns. On offer is a simple, initial investigation – not a formal test or argument.
Economic Drivers: Unemployment Note: The horizontal axis displays the average annual unemployment level (in %) for the period 2009–13. The vertical axis uses the data in Figure 3b.

Economic Drivers: GDP/Capita Note: The horizontal axis displays the average annual GDP/capita level in euros for the period 2009–13, in current prices. The vertical axis uses the data in Figure 3b. Sources: Eurostat [migr_pop1ctz] and [tec00001].

Economic Drivers: Perception of National Economy Note: The horizontal axis displays the share of total ‘Bad’ responses to the question: ‘How would you judge the current situation of the national economy?’ (QA4a.1), spring 2012. The vertical axis uses the data in Figure 3b. Sources: Eurostat [migr_pop1ctz] and Eurobarometer (2012: T8).

Economic Drivers: Government Response to the Financial Crisis Note: The horizontal axis displays the share of total ‘Not effectively’ responses to the question: ‘Since the beginning of the economic crisis, would you say that the national government acted effectively or not to combat the crisis up to now?’ (QC8.2), spring 2012. The vertical axis uses the data in Figure 3b. Sources: Eurostat [migr_pop1ctz] and Eurobarometer (2012: T151).

In each of the four panels that make up Figure 4, we see a clear relationship, in the expected direction: emigrants are fleeing contexts that are characterized by poorer economic management (or the perception of such). While some of the relationships are stronger than others (GDP/capita; perceptions of the national economy), the overall picture is clear.Footnote 29 Per capita emigration, to another EU member state, is highest in those member states that suffer relatively more unemployment and national poverty, and it is highest in those countries where citizens are most sceptical about the state of the country’s economic strength and its capacity for economic management. Emigrants from Europe’s most dysfunctional states are clearly fleeing from their home state’s inability to secure economic opportunity and/or stability. These emigrants lack confidence in the ability of their elected officials to correct the problem, and their exit signals a vote of no-confidence.
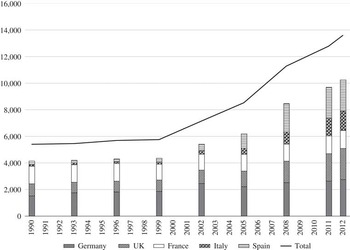
Having said that, given the depth of the economic crisis, I find it remarkable that the level of internal migration within the EU is not even greater, and recent studies have confirmed that economically motivated migration in Europe is not as prevalent as one might expect (e.g. Recchi Reference Recchi2015: 45–6). When we look more closely at the overall stock of European immigrants in the EU over time, as is done in Figure 5,Footnote 30 we see that the number of internal (EU) immigrants took off in 1999, and received a boost in 2005. It is important to note that this increase was driven by the EU’s expansion eastwards, and the access to (western) labour markets that it provided. The post-2008 growth trend is still high, and may have increased in recent years, but it is not significantly higher than we saw in the pre-crisis years. When we consider the immigration figures for some of the largest states in Europe (in the stacked columns beneath the line), we see the largest growth seems to be occurring in Spain, Italy and the UK.
European Immigrant Population in the EC/EU Note: Total number of European citizens residing in a member state different from their own, EC/EU total. Source: Recchi (Reference Recchi2015: 53).

Political Variables
The political argument for exit as voice is tangential to the economic argument outlined above, but much broader in scope. Here too, we expect migrants to be aware of the reduced effectiveness of political sovereignty at the member state level – but now the sovereign scope extends to broader concerns (than just the economy). In effect, emigration can be read as a sign of political alienation or frustration: citizens abandon hope of trying to influence policymakers to improve conditions at home, and seek refuge abroad.Footnote 31
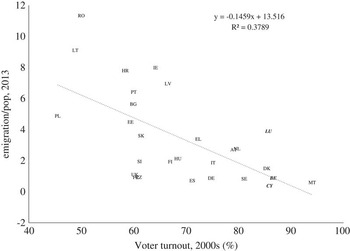
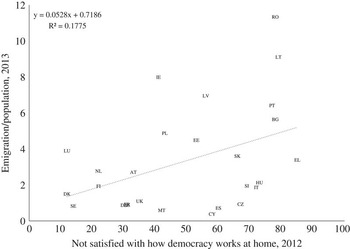
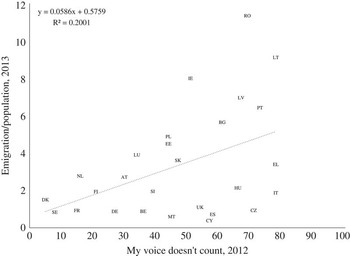
If citizens feel that they have no voice, or that their voice is not being heard, we might expect them to avoid the ballot box, have diminished trust in the national government, be dissatisfied with the democratic quality of their home government and presume that their voice does not count. Figure 6 considers each of these relationships.
Political Drivers: Voter Turnout Note: The horizontal axis displays average voter turnout over 10 years (valid votes cast in the elections compared with the list of registered voters). The vertical axis uses the data in Figure 3b. Three countries (in bold italics in the figure) have compulsory voting laws in effect: Belgium, Cyprus and Luxembourg. Sources: Emigration: Eurostat [migr_pop1ctz] and Delwit (Reference Delwit2013: 49).

Political Drivers: Trust in Home Government Note: The horizontal axis displays the share of those who ‘Tend not to trust’ their national government (QA13.2), spring 2012. The vertical axis uses the data in Figure 3b. Sources: Emigration: Eurostat [migr_pop1ctz] and Eurobarometer (2012: T47).

As in the previous figure, Figure 6 provides four different panels that relate emigration figures (per capita) with a number of variables related to political alienation. Here too, we find that the relationships are as hypothesized, and in some of these scatter plots the relationships appear to be remarkably strong. For example, in Figure 6a we see that the almost 40 per cent of the variance in emigration rates can be explained by a single variable: voter turnout levels in the preceding decade (R2=0.38). There are also clear links between the relative size of the emigrant diaspora and the level of dissatisfaction with the nature of democracy at home (Figure 6c), and the belief that their voice is not being heard at home (Figure 6d). Although the correspondence is weaker, we can also see how emigration is inversely related to trust in national governments (Figure 6b).
Political Drivers: Satisfaction with Democracy at Home Note: The horizontal axis displays the share of total ‘Not satisfied’ responses to the question: ‘On the whole, are you very satisfied, fairly satisfied, not very satisfied or not at all satisfied with the way democracy works in your country?’ (QA20a), spring 2012. The vertical axis uses the data in Figure 3b. Sources: Eurostat [migr_pop1ctz] and Eurobarometer (2012: T75).

Political Drivers: Voice Is Not Heard Note: The horizontal axis displays the total share of those who ‘Disagree’ with the statement, ‘My voice counts in my country’ (QA21a.5), spring 2012. The vertical axis uses the data in Figure 3b. Sources: Eurostat [migr_pop1ctz] and Eurobarometer (2012: T81).

In all of these scatter plots, we find the level of emigration to be highest in those countries where we find a greater sense of political alienation and frustration. In light of these exploratory findings, it does not seem unreasonable to read emigration as a kind of political voice, enunciating political frustration about the dysfunctional states from which they flee.
When we remember that the list of dysfunctional states is topped by Romania, Lithuania, Ireland, Croatia, Latvia and Portugal, it seems clear that citizens from these countries are escaping the economic fallout from the eurozone crisis. These emigrants recognize that their national governments can do little (or are willing to do little) to generate the economic growth (and jobs) they need. Left to their own devices, citizens leave their dysfunctional states and head off to greener pastures. When one considers the kind of states to which they are fleeing: small states with strong economies, many of which are outside the EU (and its eurozone), then the lesson becomes even more pronounced.
Indeed, case evidence from Romania suggests it is not unreasonable to interpret the emigrant population as politically dissatisfied, and Romanian democracy as dysfunctional. When provided an opportunity to vote, the Romanian diaspora tends to support the opposition centre-right parties and candidates (Burean Reference Burean2011; Burean and Popp Reference Burean and Popp2015). This influence became especially evident in the 2015 elections, when Klaus Iohannis managed to become president with the help of a motivated diaspora community voting through foreign embassies. Obtaining 89 per cent of the emigrant vote, he secured a 4 per cent gain over his opponent (Burean and Popp Reference Burean and Popp2015: 2; The Economist 2014).
On the other hand, the timing of the immigration spurt, as seen in Figure 5, suggests that the growth may be fuelled by something else. Recchi (Reference Recchi2015: 52) argues that the motivation may be political: that the take-off occurs at a time when visa requirements for Eastern Europe were being removed, and the people had free access to Western Europe as new EU member states.Footnote 32 The data are too sparse to test this conclusively.
CONCLUSIONS
I have suggested that many citizens in Europe have given up on voice as an instrument of democratic influence. It would seem that elected officials at the member state level lack the tools, or the will, to secure better conditions at home. Clearly, citizens in Europe need stronger tools to influence political outcomes. Exit is one possibility, and Europeans are lucky to enjoy it. This article has indicated that Europeans are using this opportunity to signal their dissatisfaction with political leadership. The empirical evidence, although it is rough, suggests that this is not an unreasonable interpretation: emigration is clearly related to the sort of economic and political variables that are consistent with the argument.
I have been careful not to overstretch the argument. I recognize that some migration in Europe is motivated by non-political factors. The British immigrants to Spain are a case in point. I am also sympathetic to the notion, often made by EU officials, that migration represents a real opportunity (and a fourth freedom), but it is important to rein in this political rhetoric, as it seems that most Europeans are not leaving home to expand their cultural horizons or to embrace their new European identities. Rather, Europeans are being forced to leave home because their governments are unable to meet expectations. In a context where a vote is seen to be ineffective, Europeans are turning to exit to secure preferable outcomes.
I have begun to trace out the relationship with a series of very simple scatter plots. More sophisticated empirical tests are possible, but this is really not necessary.Footnote 33 It should not be controversial to argue that people flee desperate situations, when given the opportunity. Rather, the point of this article is to draw attention to the political consequences that should follow in the wake of these internal migration flows. The existence of these emigration patterns is consistent with an argument that voice in Europe is not working as it should, and that local (national) officials are either unwilling or unable to provide stable economic and political conditions at home.
Europeans are lucky and privileged to have recourse to exit, but they would be luckier still if they had governments that could deliver the sort of economic and political conditions that would allow their citizens to stay at home, near friends and family. By examining migration trends we can focus attention on the shortcomings of some EU member states, with hopes of shaming them into providing more for their citizens. In other words, I hope to leverage citizen influence by focusing on the signalling effect of exit.
Acknowledgements
A previous version of this paper was presented to the mini-symposium on ‘Dysfunctional Democracy’ at Johns Hopkins University School of Advanced International Studies (SAIS), Bologna, Italy, 26 January 2016. I would like to thank the two special issue editors, Erik Jones and Matthias Matthijs, along with participants at the symposium and the anonymous referees for their many useful comments. In addition, I thank Ettore Recchi for his willingness to share data so that I could create Figure 5.
APPENDIX
Total Immigrants, Annual Average, 2009–13

Total Immigrants/Population Sources: Eurostat [migr_imm1ctz] and [demo_gind].