I. INTRODUCTION
Corrosion in metallic materials is a serious problem for the equipment, buildings, machines, etc.Reference Hou, Li, Ma, Du, Zhang, Zheng, Xu, Lu and Ma1 Numerous techniques, such as alloying treatment, coating, and corrosion inhibitors, have been developed to suppress the corrosion behaviors.Reference Xu, Gao, Lv and Pang2–Reference Beom, Kalubarme, Yun and Park7 Alloying is an effective method to decrease the corrosion rate for many metallic materials, including both Fe-based alloys and Ni-based alloys. Cu element has been approved to be an appropriate alloying element to improve the uniform corrosion resistanceReference Hong, Lee, Kim and Yoon8–Reference Liu, Li, Jiang, Zhang, Zhou and Lei12 and to increase the pitting corrosion resistance in chloride-containing solution.Reference Li, Zhao, Liu, Zhao, Xu, Yang, Zhang, Gu and Yang13–Reference Jiang, Xu, Xi, Shahzad, Khan, Zhao, Fan, Yang, Gu and Yang15 Recent investigations indicate that slight addition of Cu element could yield a tremendous reduction on the corrosion rate of 17Mn steel in neutral chloride solution.Reference Hao, Dong, Wei, Etim and Ke9 This is mainly ascribed to Cu element’s superior corrosion resistance, higher hydrogen over potential, and excellent mobile performance. Moreover, many researchers have found the outermost surface enrichment of Cu in passive systems, which is effective in enhancing the corrosion performance of Ni-based alloys.Reference Hao, Dong, Wei, Etim and Ke9–Reference Li, Xu, Hou, Zhang, Wang, Omura, Koizumi and Chiba11,Reference Zhang, Zagidulin and Shoesmith16,Reference Ujiro, Satoh, Staehle and Smyrl17
The passive film strongly depends on the nature and composition of the alloy as well as the surrounding environment, considering that it is always in constant exchange of species with the electrolyte.Reference Oguzie, Li, Liu, Chen, Li, Yang and Wang18,Reference Ningshen, Mudali, Mittal and Khatak19 The thickness and composition of the passive film are strongly influenced by the electrolyte. Moreover, the nature of passive films attached on alloys is the fundamental factor, which controls the stability and protective ability of the passive films. Thus, it is of great importance to systematically determine the electronic structure and composition distribution of the passive films. A lot of investigations on the passive film’s composition and thickness have been carried out in the nickel-based alloys.Reference Li, Xu, Hou, Zhang, Wang, Omura, Koizumi and Chiba11,Reference Zhang, Zagidulin and Shoesmith16,Reference Zagidulin, Zhang, Zhou, Noël and Shoesmith20–Reference Ter-Ovanessian, Alemany-Dumont and Normand23 However, the passive films of Ni–Co–Cr–Mo alloys are rather complex, and the relationship between the structure, chemical composition, and electronic properties of films and their ability to protect the underlying matrix from different types of corrosion are still unclear. In addition, there are few detailed studies on the Ni–Co–Cr–Mo alloy in acidic chloride environment to our knowledge.
In this work, we employ electrochemical techniques to analyze the effect of various Cu additions on the corrosion resistance and electrochemical behavior of the Ni–Co–Cr–Mo alloy in deaerated 2 mass% HCl solutions. This work is a continuation of our interest in characterizing the corrosion behavior of some novel Cu containing Ni–Co–Cr–Mo alloys, which has been reported in our previous work.Reference Li, Xu, Hou, Zhang, Wang, Omura, Koizumi and Chiba11,Reference Yang, Li, Gong, Nie and Li24 The effect of Cu addition on Ni–Co–Cr–Mo alloy’s passivation is neither certain nor definite, and both beneficial and adverse effects have been observed.Reference Zhang, Li, Hou, Tang, Ohmura, Koizumi and Chiba10,Reference Yang, Li, Gong, Nie and Li24 Earlier reports showed that 2 mass% Cu additions have significantly improved Ni–Co–Cr–Mo alloy’s corrosion resistance in aqueous hydrofluoric acid.Reference Zhang, Li, Hou, Tang, Ohmura, Koizumi and Chiba10 However, the investigation in NaCl solution has elucidated that 0.5 mass% Cu additions were detrimental to the corrosion resistance of the Ni–Co–Cr–Mo alloy and 2 mass% Cu additions were of little influence on it at open-circuit potential.Reference Yang, Li, Gong, Nie and Li24
This work includes determination of the corrosion resistance of different Ni–Co–Cr–Mo specimens alloying with 0–4 mass% Cu in 2 mass% deaerated solution, evaluation of the impedance responses of the open-circuit potential Ni–Co–Cr–Mo alloys’ surfaces, and determination of the semiconducting character and dopant levels in the passive films. The results and findings will reveal new evolution information and mechanisms of Cu addition’s impact on the corrosion resistance and electrochemical response of the passive films in the acidic chloride solution.
II. EXPERIMENTAL PROCEDURE
A. Materials
Ni–30Co–16Cr–15Mo–6Fe–xCu–0.7Mn (mass%) alloys with nominal Cu concentrations of 0, 0.5, 2, and 4 mass%, were selected for this work, which hereafter are referred to as 0Cu, 0.5Cu, 2Cu, and 4Cu, respectively. Ingots of alloy were fabricated by vacuum induction melting and then subjected to a homogenization treatment at 1250 °C for 14 h25 followed by hot forging (60%, finial reduction) at a starting temperature of 1250 °C and then homogenization treatment at 1250 °C for 1 h, finally water quenching to avoid precipitation.
B. Electrochemical measurements
The electrochemical measuring specimens were cut after the above homogenization treatment by using an electrical discharge wire-cutting machine. The obtained disk-like samples have a diameter of 16 mm and a thickness of 1 mm. Before the electrochemical measurement, specimens with mirror-like surface were prepared by grinding with SiC paper (up to 2000 grit), mechanical polishing with Al2O3 suspension, and vibratory polishing with 0.05 μm SiO2 suspension. Then, all the specimens were rinsed by using an ultrasonic cleaner with deionized water and ethanol sequentially. All the measurements were performed at room temperature in 2 mass% deaerated HCl solution. Analytical grade chemicals and ultrapure water (18.25 MΩ cm) were used for the solution preparation. A conventional three-electrode glass cell was used, and the diameter of the round specimens’ end face was 10 mm. A Pt counter electrode and a saturated calomel electrode (SCE) were fixed in the cell. All the experiments were performed on Autolab PGSTAT302N equipment (Metrohm, Herisau, Switzerland) under purified nitrogen atmosphere at 25 °C.
After removing the nature oxide surface by cathodic polarization for 30 min at an applied potential of −0.450 V (versus SCE) in 2 mass% deaerated HCl solution, the specimens were naturally immersed in investigated solution for 5 h to form passive film. Then electrochemical impedance spectroscopy (EIS) measurements were performed with an amplitude of 10 mV over the range from 0.01 to 105 Hz and the corresponding impedance data were fitted by ZVIEW 2.0 software (Scribner Associates, Southern Pines, North Carolina). Potentiodynamic polarization (PDP) tests were carried out from −0.300 to 0.900 V/SHE at a scan rate of 0.167 mV/s. Polarization test and EIS measurements for each specimen condition were repeated at least three times.
The semiconductor properties of the passive films were assessed by the Mott–Schottky analysis performed after its 1000 h exposure in 2 mass% deaerated HCl solution. Mott–Schottky experiments were carried out in the ascending and descending voltage directions at 1 kHz in the potential range of −0.100 V/SHE to +0.600 V/SHE, with a voltage scan rate of 100 mV/s.
C. Microstructure characterization
The constituent phases of the initial specimens were identified through X-ray diffraction (XRD) analysis (Philips X′Pert MPD, Eindhoven, Netherlands). The X-ray photoelectron spectroscopy (XPS) (Axis ultra DLD, Kratos, Manchester, United Kingdom) analysis of the immersed samples were performed to present the depth profiles of the passive films obtained from immersion of 2 mass% deaerated HCl solution for 1000 h. The beam and spot sizes used in the XPS measurements were 300 × 700 μm2 and 2 mm (diameter), respectively. Incident monochromatic Al Kα X-ray source with an energy of 1486.61 eV was used.
III. RESULTS AND DISCUSSION
A. Initial microstructure
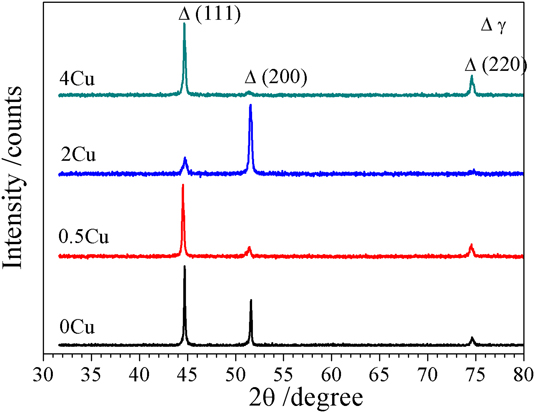
The initial specimens’ XRD analysis results are shown in Fig. 1. The peaks in the patterns are from the γ phase’s diffraction, and there are no peaks attributable to second-phase precipitates, i.e., μ phase and σ phase. It should be noted that the peak strength is varied in alloys. For example, the strongest diffraction peak is (111) crystal face for the 0Cu sample, while it is (200) crystal face for the 2Cu sample. This difference should be ascribed to preferred orientation resulting from the hot forging.
X-ray diffractogram of 0Cu, 0.5Cu, 2Cu, and 4Cu samples.

B. Electrochemical behavior
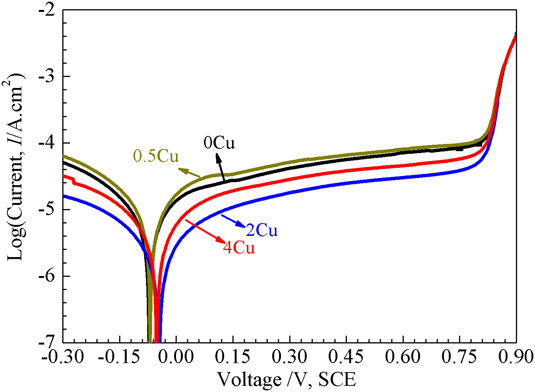
The PDP curves for the studied alloys in 2 mass% deaerated HCl solution at 25 °C are shown in Fig. 2. All alloys passivate and show similar spontaneous passivation behavior, irrespective of the Cu addition. With increasing applied potential, all alloys experience a transition from the passive region to transpassive region without transition of the active-passive region, and the polarization curves overlap each other gradually. However, the passive behavior and the passive current density are significantly influenced by the amount of Cu addition. Distinctive differences both in the cathodic and anodic branch of the polarization curve are also observed with incremental Cu content.
Typical PDP curves in 2 mass% deaerated HCl solution at room temperature of 0Cu, 0.5Cu, 2Cu, and 4Cu samples.

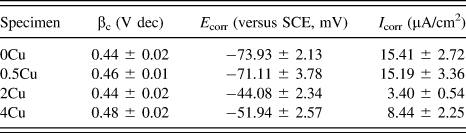
We consider the values of the curves as the corresponding corrosion potentials (E corr). The cathodic Tafel slopes (b c) are obtained from linear fittings of cathodic polarization Tafel region. Given that all systems investigated here does not fit the Butler–Volmer equation, the corrosion current densities (I corr) are calculated based on the corrosion potentials (E corr) and the cathodic Tafel slopes (b c) instead of by Tafel fitting. A similar method can be seen in our previous studies.Reference Yang, Li, Gong, Nie and Li24 These parameters obtained from polarization curves are listed in Table I. 0–4% Cu addition has little impact on values of the cathodic Tafel slopes (b c), and the cathodic region can be ascribed to the hydrogen revolution reaction. However, the anodic region is influenced greatly with it, which can be deduced from the different corrosion potentials (E corr) and similar cathodic Tafel slopes (b c). 2Cu exhibits the best corrosion resistance to 2 mass% deaerated HCl solution, with the noblest corrosion potential and the lowest corrosion current density. This is different with our previous study in neutral chloride solution, which indicates that the 4Cu sample presents the best corrosion resistance. The difference suggests that the role of Cu on corrosion behavior of the Ni–Co–Cr–Mo alloy in acidic chloride solution differs it in neutral chloride solution.
Values of cathodic Tafel coefficient (βc), corrosion potential (E corr), and corrosion current density (I corr) of Ni–Co–Cr–Mo alloys with different Cu additions in 2 mass% deaerated HCl solution, as well as the deviations, obtained from PDP curves (shown in Fig. 2).

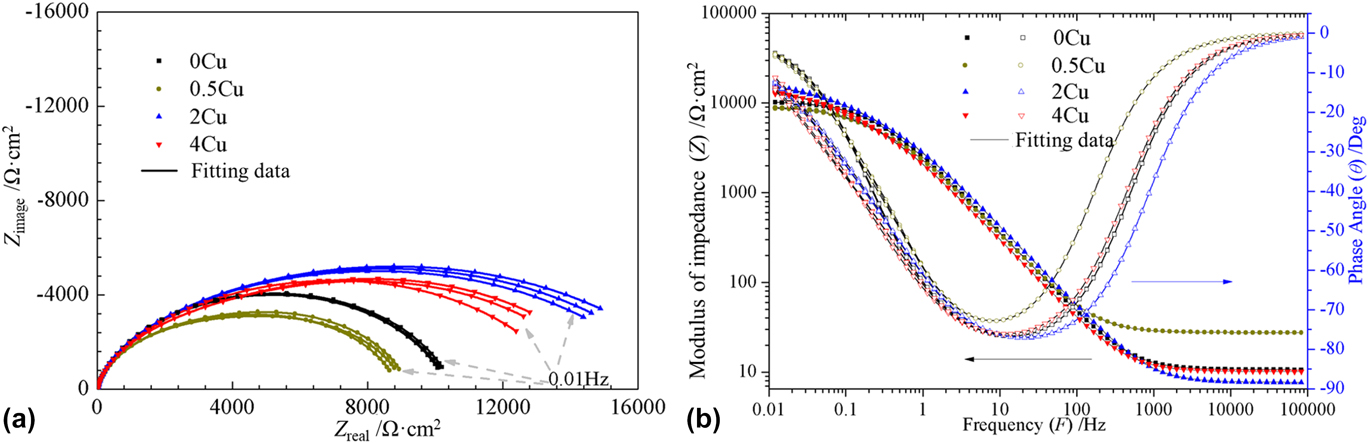
To attain more information of corrosion process at open-circuit potentials, EIS measurements were carried out after specimens immersed in 2 mass% deaerated HCl solution at 25 °C for 5 h. Figures 3(a) and 3(b) show Nyquist and Bode impedance responses. Nyquist impedance spectra demonstrate depressed semicircles, indicating the formation of porous passive layers on the matrix surface. Meanwhile, the minimum phase angles of Ni–Co–Cr–Mo alloys shown in Fig. 3(b) are about −75°. The Bode spectra shown in Fig. 3(b) can be divided into three parts: (i) low frequencies between 10−2 and 10−1 Hz, |Z| (which represents the polarization resistances of the samples) for all Ni–Co–Cr–Mo alloy samples examined: between 0.9 × 10⁴ Ω cm2 and 1.8 × 10⁴ Ω cm2; (ii) similar double layer characteristics and maximum phase angles represented in Bode-phase plots are characterized at intermediate frequencies between 10−1 and 104 Hz. This frequency range seems larger than that attained from typical (RC) circuit, which means two or more time constants existReference Cao26; and (iii) between 104 and 105 Hz is clearly characterized as the solution (electrolyte) resistance of 5–15 Ω cm2.
(a) Nyquist and (b) Bode impedance spectra for Ni–Co–Cr–Mo alloys with various Cu additions in 2 mass% deaerated HCl solution at room temperature.

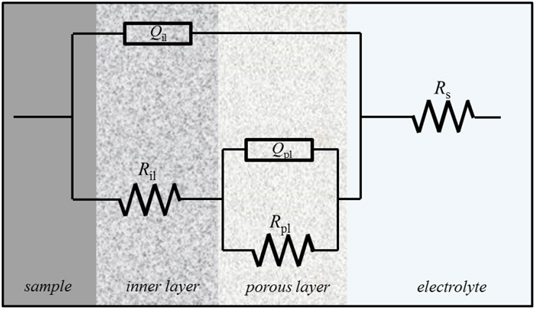
To obtain impedance parameters such as layer resistances and capacitances, a well-known equivalent circuitReference Osório, Freitas and Garcia27–Reference Osório, Peixoto and Garcia30 was applied by using ZVIEW 2.0 software, as shown in Fig. 4. Considering the proposed equivalent circuit, R s is the resistance of the 2 mass% deaerated HCl solution and it is expressed at high frequency limit (between 105 and 104 Hz). R pl and R il are the resistances of the porous and inner layers, respectively, which express the charge transfer resistance through the porous layer and the inner compact layer. Q pl and Q il represent the capacitances of the porous layer and inner layer, respectively. A constant phase element (CPE) representing a shift from an ideal capacitor is used for simplicity instead of the capacitance itself. The impedance of CPE is described as follows:
 $${Z_{{\rm{CPE}}}} = {1 \over {{Y_0}{{\left( {j\omega } \right)}^n}}}\quad ,$$
where Y 0 is the magnitude of the CPE, j is the imaginary unit (j 2 = −1), ω is the angular frequency, n is the deviation parameter regarding phase shift, with n ranging from 0 for a pure resistor to 1 for a pure capacitor. The value of n seems to be related to the distribution of current density owing to roughness and possible oxide surface defects.Reference Osório, Freitas and Garcia27–Reference Osório, Peixoto and Garcia30 The porosity of the layer increases as the n value decreases from n = 1.
Equivalent circuit proposed to fit EIS spectra.

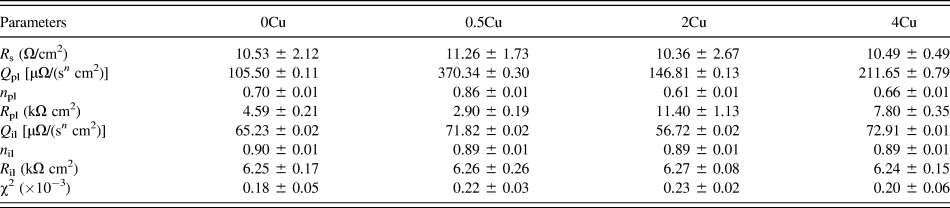
Table II summarizes the parameters and derivations from the fitting using EEC described in Fig. 4 for Ni–Co–Cr–Mo alloys after 5 h immersion in 2 mass% deaerated HCl solution. The chi-squired values in Table I confirm that the fitting plots well match the experimental data. The distinct difference of Q pl, n pl, and R pl with various Cu additions to the Ni–Co–Cr–Mo alloy shows that Cu addition has greatly influenced the structure of the porous layer. The 2Cu sample performs with the lowest n pl and the biggest R pl evincing the highest porosity and the most excellent charge resistance of the porous layer. Previous studies showed that the capacitance value is inversely proportional to the thickness of the passive layer.Reference Cvijović-Alagić, Cvijović, Bajat and Rakin31,Reference Hwang, Park, Moon, Song and Park32 Thus, the 0.5Cu sample exhibits the thinnest porous layer, and the 2Cu sample has comparative thickness to the 0Cu sample from Table II. Additionally, Cu addition seems to have little influence on the inner layer, considering little change of R il and n il. However, the values of Q il vary slightly with elemental Cu addition. This suggests that the thickness of the inner passive film has been varied with Cu addition. Inner passive film’s thickness can be ascribed to outer porous layer’s stability. In other words, the thicker inner layer suggests higher corrosion resistance to surrounding environment. The 2Cu sample performs with the lowest Q il, suggesting the thickest inner layer and the highest corrosion resistance to 2 mass% deaerated HCl solution.
Electrical parameters of the equivalent circuit obtained by fitting the impedance data of Cu-free and Cu-containing Ni–Co–Cr–Mo alloys.

Important information about the semiconducting properties of the passive film can be obtained by capacitance measurements, which disclose the charge distribution when a semiconducting film is exposed to an electrolyte. These measurements are important because of their contribution to the investigation of the electronic structure of the film. The capacitance measured corresponds to the space charge region forms in the passive film near the film/electrolyte interface. The relation between this capacitance and the applied potential is given by the well-known Mott–Schottky equationReference Bott33:
 $${1 \over {{C^2}}} = {2 \over {e\varepsilon {\varepsilon _0}N}}\left( {E - {E_{{\rm{fb}}}} - {{kT} \over e}} \right)\quad ,$$
where C is the capacitance of the space charge region, N represents the carrier concentration (electron donor concentration (N D) for n-type semiconductors or hole acceptor concentration (N A) for p-type semiconductors), ε is the dielectric constant of the passive film (ε = 30 has been assumed for all Ni–Co–Cr–Mo alloys in this studyReference Macdonald and Sun34,Reference Macdonald, Sun, Priyantha and Jayaweera35 ), ε0 is the vacuum permittivity (8.85 × 10⁻¹⁴ F/cm), k is the Boltzmann constant (1.38 × 10⁻²³ J/K), T is the absolute temperature, e is the elementary charge (1.60 × 10⁻¹⁹ C), and E fb is the flat band potential, which can be determined by extrapolation to C −2 = 0.
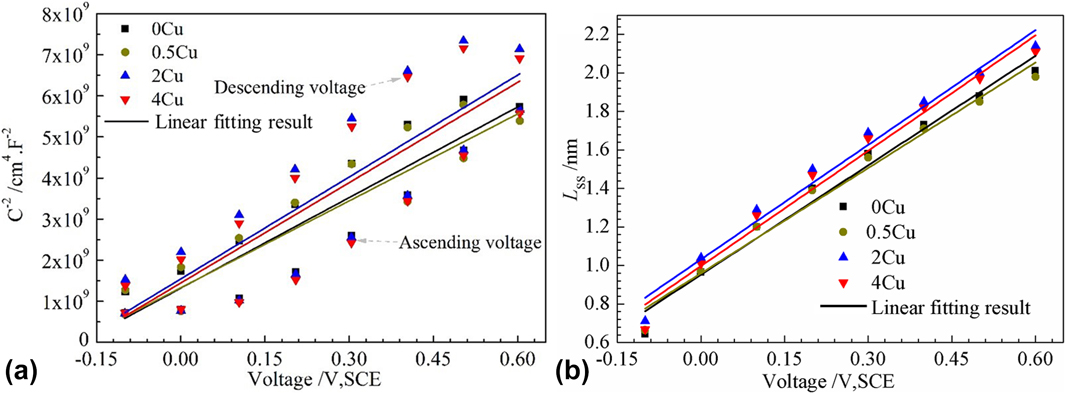
The observations from Fig. 5(a) reveal that the capacitance of all investigated samples decreased when the anodic potential increased. Furthermore, C −2 and E depict the linear relationship in one region for all samples. In practice, linear relationship with positive slopes between the applied potential and C −2 shows that the passive layers on all the samples presented n-type semiconductor behavior. Similar M–S plots (n-type semiconductor behavior) for Alloy-22 in NaCl brine have been obtained by Macdonald et al.Reference Macdonald, Sun, Priyantha and Jayaweera35 Donors in the passive layer of Ni–Co–Cr–Mo alloys can be attributed to chromium interstitials and/or oxygen vacancies. The donor density, N D, can be determined from the slopes in the M–S plots shown in Fig. 5(a), according to the following equation:
 $${N_{\rm{D}}} = {2 \over {\varepsilon {\varepsilon _0}e}}{\left[ {{{{\rm{d}}\left( {{C^{ - 2}}} \right)} \over {{\rm{d}}E}}} \right]^{ - 1}}\quad .$$
(a) Mott–Schottky plots of C −2 as a function of potential for passive films on Ni–Co–Cr–Mo alloys with various Cu additions in 2 mass% deaerated HCl solution. Note that the specific capacitance was measured in the ascending and descending voltage directions. (b) Film thickness of Ni–Co–Cr–Mo alloys with various Cu additions in 2 mass% deaerated HCl solution as a function of formation potential.

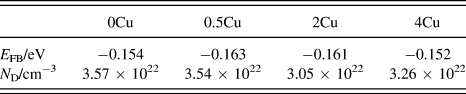
Table III displays the N D values of all the samples that are obtained from the slope of M–S plots. In fact, depending on the passive layer thickness and the surrounding electrolyte, the literature showed that the value for N D is in the range of 1018–1023 cm−3.Reference Macdonald, Sun, Priyantha and Jayaweera35–Reference Fattah-alhosseini, Naseri, Gashti, Vafaeian and Keshavarz38 N D measured in this procedure are in the order of 1022 cm−3, assuming a dielectric constant of 30. From Table III, it is evident that the 2Cu sample shows the least amount of N D, suggesting excellent corrosion resistance. It is worth mentioning that the reaction mechanisms of charge carriers within the passive film formed on nickel-based alloys (not shown here) have been studied and reported in detail based on the point defect model.Reference Macdonald, Sun, Priyantha and Jayaweera35 There seems little influence on flap band potential with Cu content increasing, from Table III.

Moreover, the passive layer thickness (d) is obtained by the following equationReference Macdonald, Sun, Priyantha and Jayaweera35:
 $$d = {{\varepsilon {\varepsilon _0}} \over {{C_{\rm{g}}}}},\;\left( {{\rm{Helmholtz}}\;{\rm{model}}} \right)\quad ,$$
where c g (F/cm2) is the geometric capacitance of the barrier layer and the other parameters are as previously defined. Disregarding the inconsistency of space region capacitance and double layer capacitance, we use herein simply c obtained from Mott–Schottky measurements to estimate passive film thickness. Equation (4) depicts that the passive layer thickness is proportional to the reciprocal of the passive layer capacitance. The relation between film thickness and potential of various Cu-containing Ni–Co–Cr–Mo alloys is illuminated in Fig. 5(b). From this, all the specimens turn thicker with potential increasing. The 2Cu sample shows the maximum value of polarization resistance, illustrated by the higher passive film thickness rather than other specimens. This agrees with the results of EIS, as can be seen in Sec. III(b). The passive films’ thickness is ranging between 0.6 and 2.2 nm, which is in line with the literature.Reference Macdonald, Sun, Priyantha and Jayaweera35,Reference Fattah-alhosseini, Naseri, Gashti, Vafaeian and Keshavarz38
C. XPS etching analysis
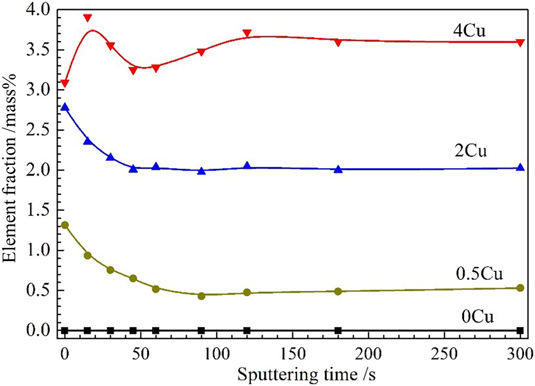
To analyze the evolution process of Cu element’s contribution at various depths, XPS etching experiments were conducted. The results are shown in Fig. 6. Obviously, the metallic fraction of Cu at the outermost surface is increasing with Cu addition increasing. The depth analysis was carried out for the passive films of the 0.5Cu sample and 2Cu sample and both analyses reveal the same trend that an enrichment of Cu in the external surface of the passive films is found. As to the Cu profile of the 4Cu sample, an obviously different behavior has been observed. The Cu profile of the 4Cu sample starts to increase from the external surface rather than the decreasing trend for 0.5Cu and 2Cu samples, and it passes through a maximum of its metallic fraction at around 3.75 mass%, then attain a minimum of around 3.25 mass% before it reaches the bulk composition of the alloy (around 3.6 mass%). This can explain why the corrosion resistance of the 4Cu sample is poorer than that of the 2Cu sample as discussed above. A maximum amount of Cu element distributing on the outermost passive film can be estimated to be 3.1 mass% in this investigated environment. This further elucidates that excessive Cu addition to the Ni–Co–Cr–Mo alloy will not further improve alloy’s corrosion resistance in 2 mass% deaerated HCl solution at 25 °C. Previous studies of various Cu in stainless steel have indicated slight additive copper will diffuse and distribute homogeneously in the steel matrix,Reference Hao, Dong, Wei, Etim and Ke9 while excessive copper may precipitate in the epsilon-copper phase leading to the possibility of galvanic corrosion.Reference San, Zhang, Wu, Wei, Oguzie and Ma39 However, no second-phase precipitates are detected with additive Cu incrementing from 0 to 4 mass% in the present study, as can be seen from Fig. 1. This means Cu element has distributed in Ni–Co–Cr–Mo alloys homogeneously. The difference of corrosion resistance for Ni–Co–Cr–Mo alloys investigated should be ascribed to the content or distribution of Cu element in passive films.
Depth profiles of mass percentages of Cu element on the surface film of Ni–Co–Cr–Mo alloys with various Cu additions at room temperature after immersion in 2 mass% deaerated HCl solution for 1000 h.

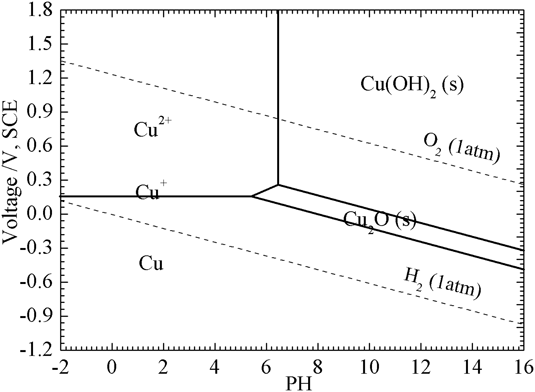
Moreover, the enrichment and distribution of Cu in the outer passive film can explain why outer porous layer’s electrochemical properties can be influenced easily with Cu addition varying from 0 to 4 mass%, as discussed in Sec. III(b). This enrichment phenomenon can be seen in many previous studies.Reference Hao, Dong, Wei, Etim and Ke9,Reference Li, Xu, Hou, Zhang, Wang, Omura, Koizumi and Chiba11,Reference Ujiro, Satoh, Staehle and Smyrl17 For example, Hao et al. reported that the corrosion resistance of 16MnCu steel was higher than that of 16Mn steel resulting from the deposition of nanosized Cu particles on the external surface.Reference Hao, Dong, Wei, Etim and Ke9 The Pourbaix diagram calculated by FactSage 7.1 software (Thermfact/CRCT, Montreal, Canada and GTT-Technologies, Aachen, Germany) is shown in Fig. 7. This shows that metallic Cu will exist stably at open-circuit potential (about −50 mV, SCE), which suggests that Cu will segregate on the surface after selective solution of Co and Fe.
Pourbaix diagram of the Cu–Cl−–H2O system at room temperature with a molarity of 1 × 10⁻⁶ mol/kg, calculated using FactSage Software.

IV. CONCLUSIONS
The effect of various Cu additions to the Ni–Co–Cr–Mo alloy on the corrosion resistance and electrochemical response of passive layers at open-circuit potentials in 2 mass% deaerated HCl solution has been investigated. The following conclusions can be drawn from the obtained results:
(1) The corrosion resistance at open-circuit potential of investigated alloys in decreasing order follows: 2Cu > 4Cu > 0.5Cu ≈ 0Cu. The Cu-containing Ni–Co–Cr–Mo alloys’ corrosion resistance is not simply increasing with Cu addition increasing.
(2) The variation of Cu influences the outer porous layer more significantly than the inner layer. This is associated with Cu element’s distribution in the passive film.
(3) Cu element’s distribution in the passive film differs with the amount of Cu addition. 0.5Cu and 2Cu samples show distinct enrichment at the outermost surface, while the 4Cu sample exhibits different behaviors. A maximum limit of Cu element distributing on the external surface exists in the present condition.
(4) The type of semiconductor and flab band potential has little relation with the Cu content, while the donor density has a connection with that. The 2Cu sample shows the lowest donor density and the thickest passive film in the present study.
ACKNOWLEDGMENTS
This investigation is supported by the Fundamental Research Funds for the Central Universities of Central South University, the Science Fund for Distinguished Young Scholars of Hunan Province, China (2016JJ1016), the project of Innovation and Entrepreneur Team introduced by Guangdong Province (201301G0105337290), and the Special Funds for Future Industrial Development of Shenzhen (No. HKHTZD20140702020004).