Introduction
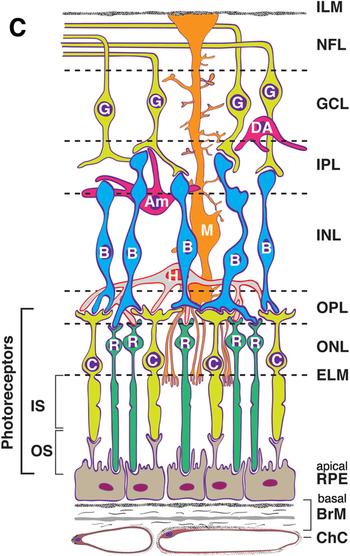
The retina is a part of the central nervous system (CNS), with both it and the brain developing from the anterior part of the neural tube early in development. Because of this, the retina has been viewed as a ‘window to the brain’ (Chu et al. Reference Chu, Kolappan, Barnes, Joyce and Ron2012; London et al. Reference London, Benhar and Schwartz2013; Jindal, Reference Jindal2015; Schonfeldt-Lecuona et al. Reference Schonfeldt-Lecuona, Kregel, Schmidt, Pinkhardt, Lauda and Kassubek2016) in terms of their many similarities in structure, neurotransmitters, and function. Data supporting this view come from studies, in multiple conditions, indicating that thinning of neural layers of the retina predicts cortical atrophy and other disease characteristics. For example, thinning of the axon layer of retinal ganglion cells (i.e. the retinal nerve fiber layer or RNFL; see Fig. 1) is related to brain volume loss, illness progression and cognitive decline in multiple sclerosis (MS) (Gordon-Lipkin et al. Reference Gordon-Lipkin, Chodkowski, Reich, Smith, Pulicken and Balcer2007; Pulicken et al. Reference Pulicken, Gordon-Lipkin, Balcer, Frohman, Cutter and Calabresi2007; Toledo et al. Reference Toledo, Sepulcre, Salinas-Alaman, Garcia-Layana, Murie-Fernandez and Bejarano2008) and Alzheimer's disease (AD) (Iseri et al. Reference Iseri, Altinas, Tokay and Yuksel2006; Liu et al. Reference Liu, Zhang, Li, Zhang, Wu and Yang2015; Ferrari et al. Reference Ferrari, Huang, Magnani, Ambrosi, Comi and Leocani2017). RNFL thinning is also related to brain volume loss in aging (Ong et al. Reference Ong, Hilal, Cheung, Venketasubramanian, Niessen and Vrooman2015). In addition, RNFL thinning is related to the severity of visual hallucinations and functional decline in Parkinson's Disease (Lee et al. Reference Lee, Ahn, Kim and Jeon2014; Satue et al. Reference Satue, Seral, Otin, Alarcia, Herrero and Bambo2014). Because retinal ganglion cell axons form the optic nerve, leave the retina, and synapse at the lateral geniculate nucleus (LGN), where they provide segregated input to the subcortical magnocellular (M) and parvocellular (P) visual pathways, examination of retinal structure may be especially relevant to schizophrenia, where impairments in both pathways, but especially the M system, have often been reported (Butler et al. Reference Butler, Silverstein and Dakin2008; Lalor et al. Reference Lalor, De Sanctis, Krakowski and Foxe2012; Jahshan et al. Reference Jahshan, Wolf, Karbi, Shamir and Rassovsky2017).
Illustration of retinal cell types and layers. Cells: RPE, retinal pigment epithelium (support to photoreceptors); C, cone photoreceptor; R, rod photoreceptor; H, horizontal cell (interneuron); B, bipolar cell (interneuron); M, Müller cell (radial glial cell); Am, amacrine cell (interneuron); DA, displaced amacrine cell (interneuron); G, ganglion cell (output neuron). Müller cells (M) form the ELM, and their foot processes partially form the ILM. Layers: ChC, choriocapillaris (capillary bed for RPE and photoreceptors); BrM, Bruch's membrane (vessel wall and RPE substratum); ELM, external limiting membrane (junctional complexes); ONL, outer nuclear layer; OPL, outer plexiform layer (synapses); INL, inner nuclear layer; IPL, inner plexiform layer (includes ganglion cell dendrites, bipolar cell axons, and amacrine cells); GCL, ganglion cell (body) layer; NFL, nerve fiber layer (ganglion cell axons); ILM, inner limiting membrane. Image, and the majority of the figure caption reproduced from Fig. 2c in: Zheng W, Reem RE, Omarova S, Huang S, DiPatre PL, et al. (2012) Spatial Distribution of the Pathways of Cholesterol Homeostasis in Human Retina. PLOS ONE 7(5): e37926. https://doi.org/10.1371/journal.pone.0037926 via a Creative Commons Attribution (CC BY) license.

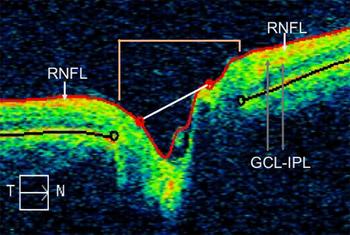
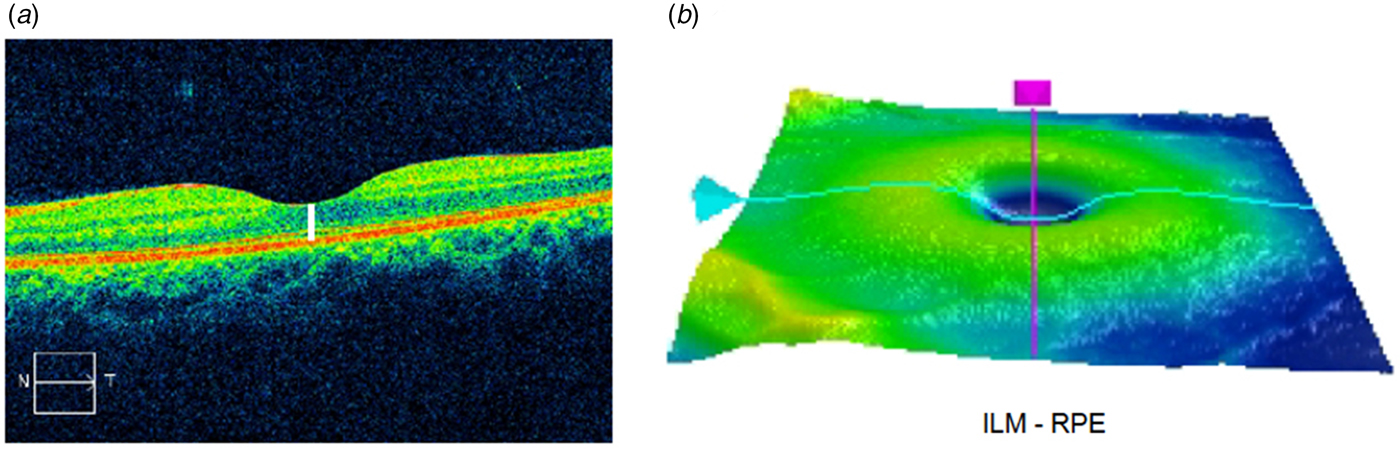
Examination of the thickness of the RNFL and other retinal layers is typically achieved using optical coherence tomography (OCT). OCT is a non-contact retinal structural imaging technique in which infrared light is projected both into the eye and to a reference mirror. The difference between the spectral frequency composition of light reflected back from the eye (i.e. the original spectral frequency profile minus what was absorbed by retinal structures), in comparison with the unaltered light spectra reflected back from the reference mirror, is used to reconstruct images of retinal layers, in a manner analogous to that used by ultrasound. Examples of typical pseudocolorized (to differentiate layers) OCT images, of the RNFL and macula respectively, are presented in Figs 2 and 3. In addition to thickness of the RNFL near the optic nerve head, and of the macula (through all layers anterior to the retinal pigment epithelium), both of which are two-dimensional (2-D) measurements (i.e. of length), volumetric (3D) measurements are possible, such as macular volume which is commonly referred to in the OCT literature as macular cube volume, within a pre-specified range of coordinates. Several other OCT metrics are also useful and commonly reported. These include the thickness of the retinal ganglion cell body layer (GCL, the cells whose axons form the RNFL), and of the inner-plexiform layer (IPL) which consists of the ganglion cell dendrites, bipolar cell axons, and amacrine cell neuritic processes that subserve lateral connections between ganglion cells. The thickness of the combination of these layers (GCL-IPL) is typically reported, and we follow that convention here. Measurements at the optic nerve head are also informative. For example, cup volume (see Fig. 2) often reflects the overall size of the optic nerve, and cup-to-disc ratio, when enlarged, can reflect a number of issues including neural tissue loss, vascular abnormalities, inflammation, or an enlarged optic nerve, issues that are common in retinal diseases (Chen et al. Reference Chen, Chui, Alhadeff, Rosen, Ritch and Dubra2015; Scripsema et al. Reference Scripsema, Garcia, Bavier, Chui, Krawitz and Mo2016; Geyman et al. Reference Geyman, Garg, Suwan, Trivedi, Krawitz and Mo2017; Mo et al. Reference Mo, Phillips, Krawitz, Garg, Salim and Geyman2017). A final OCT variable we report on is RNFL symmetry, which is the degree to which RNFL thickness is similar across the two eyes. Deviations from symmetry typically reflect some form of optic neuropathy (Budenz, Reference Budenz2008). Data generated with OCT scans are virtually identical to those generated from histologic examination of retinal tissue (Ghazi et al. Reference Ghazi, Dibernardo, Ying, Mori and Gehlbach2006; Vajzovic et al. Reference Vajzovic, Hendrickson, O'Connell, Clark, Tran-Viet and Possin2012), and are highly reliable, with intraclass correlations from repeated measurements exceeding 0.99 (Wadhwani et al. Reference Wadhwani, Bali, Satyapal, Angmo, Sharma and Pandey2015).
Horizontal tomogram indicating regions assessed by RNFL scans, in this case for the left eye of a study subject: inner limiting membrane (ILM; red line); RNFL (orange area just beneath ILM); GCL and IPL layers (beneath RNFL); optic disc (area indicated by width of tan lines near top, and also by the distance between the black circles within the image); cup boundaries (indicated by white line between the two red circles on the red ILM line). The cup-to-disc ratio is the width of the cup divided by the width of the disc. T, temporal; N, nasal.

(a) OCT image generated by macula scan. The vertical white line has been added to demonstrate the depth of the scan, from the inner limiting membrane (ILM) at the top to the retinal pigment epithelium (RPE; in red, beneath the photoreceptor layer). (b) Topographic map showing the region of the macula scan. Scan depth indicated by concavity in blue line at the position of the scan axis (purple line).

OCT studies of schizophrenia generally indicate RNFL or macula thinning (Silverstein & Rosen, Reference Silverstein and Rosen2015). However, not all studies have demonstrated these effects, and many of the studies with positive findings are characterized by potential confounds or serious methodological limitations. For example, in a study from Spain, (Ascaso et al. Reference Ascaso, Cabezon, Quintanilla, Gutierrez-Galve, Lopez-Anton and Cristobal2010) reported RNFL but not macula thinning in schizophrenia. However, their sample consisted of only 10 patients and 10 controls, and none of the findings would have been statistically significant if the p values were adjusted for multiple comparisons [e.g. on the 5 RNFL comparisons alone (4 quadrants plus the overall thickness), the lowest uncorrected p value was 0.047]. Also, while subjects with observable retinal pathology were excluded, subjects with diseases that are overexpressed (Liao et al. Reference Liao, Chang, Wei, Chang, Liao and Lane2011), and typically untreated (Nasrallah et al. Reference Nasrallah, Meyer, Goff, Mcevoy, Davis and Stroup2006) in schizophrenia and that can also cause subtle retinal changes (e.g. diabetes and hypertension) were not excluded. A follow-up study from this group (Cabezon et al. Reference Cabezon, Ascaso, Ramiro, Quintanilla, Gutierrez and Lobo2012), with 30 patients and 30 controls, reported RNFL but not macula thinning, and enlarged cup-to-disc ratio and cup volume. This study, however, only investigated the right eye (precluding the built-in chance for replication afforded by studying both eyes), and the data were presented in a published conference abstract only, not in a peer-reviewed article. In another study from this group (Ascaso et al. Reference Ascaso, Rodriguez-Jimenez, Cabezon, Lopez-Anton, Santabarbara and De La Camara2015) with 30 schizophrenia patients and 30 controls, the patient group was characterized by RNFL thinning, but the between-group difference was only significant for the right eye. In contrast, significant macula thinning was observed only in the left eye. Significant differences from controls were found only for the patient subgroup that had not had a psychotic episode within the past 6 months, suggesting that acute psychosis may be associated with inflammation and tissue swelling that prevents detection of retinal atrophy. However, the limitations of findings to specific eyes, the differences between findings in each eye, and the divergence of these findings from other studies once again raises questions about the robustness and validity of OCT findings in schizophrenia. Moreover, potential confounds with this study were that: (1) it is not clear whether potential subjects with relevant comorbidity were excluded (e.g. subjects with diabetic retinopathy were excluded, but it is not clear whether subjects with diabetes alone were excluded); and (2) the patient group was on an average dose of antipsychotic medication (chlorpromazine equivalent dose = 711.6 ± 490.6 mg/day) that was at the upper end of what is observed worldwide (Gardner et al. Reference Gardner, Murphy, O'Donnell, Centorrino and Baldessarini2010). The latter is important because one potential consequence of antipsychotic medication use is the blockade of retinal dopamine (DA) receptors, which can lead to death of ganglion and other retinal cells (since all retinal cell types have DA receptors), due to reduced activity – all of which could contribute to thinning of retinal layers (Silverstein & Rosen, Reference Silverstein and Rosen2015). This is similar to what is observed in MDTP treated monkeys (Ghilardi et al. Reference Ghilardi, Chung, Bodis-Wollner, Dvorzniak, Glover and Onofrj1988), and in humans with Parkinson's disease (Yu et al. Reference Yu, Feng, Xiang, Huang, Savini and Parisi2014), where reduced input due to loss of DA-containing amacrine cells is thought to lead to loss of axons and cell bodies in other retinal cells (Inzelberg et al. Reference Inzelberg, Ramirez, Nisipeanu and Ophir2004).
A study from Malaysia (Lee et al. Reference Lee, Tajunisah, Sharmilla, Peyman and Subrayan2013) also reported reduced RNFL (overall, and in 3 of 4 quadrants) and macula thickness in 30 schizophrenia patients compared to 30 healthy controls. Interestingly, this effect was observed only in patients with longer duration of illness, while those with less than 2 years since illness onset did not differ from controls. However, a confound in this study was that while the patient and control groups were age-matched overall, the older and more chronically ill patient subgroups were compared with the control group as a whole, not to an age-matched subgroup of controls. Therefore, while the authors emphasized the potential effects of illness progression on retinal thinning (which could also be due to longer-term antipsychotic medication use), it is also possible that the effects are due to normal aging, since it is known that aging is associated with retinal thinning (Harwerth et al. Reference Harwerth, Wheat and Rangaswamy2008; Harwerth & Wheat, Reference Harwerth and Wheat2008). Support for this comes from the study by Ascaso et al. (Reference Ascaso, Rodriguez-Jimenez, Cabezon, Lopez-Anton, Santabarbara and De La Camara2015) that found no relationship between illness chronicity and any OCT variable after correcting for age.
Celik et al. (Reference Celik, Kalenderoglu, Sevgi Karadag, Bekir Egilmez, Han-Almis and Simsek2016) reported on a study from Turkey of 81 schizophrenia patients and 41 healthy controls. In this study, the schizophrenia group demonstrated thinning of the RNFL overall, and in 2 RNFL segments. RNFL thickness was not related to treatment-refractory v. responsive status, but the thickness of the choroid at the macula was reduced in the treatment-refractory group (but not in patients overall relative to controls). Data on macula thickness was not reported. Importantly, none of the findings from this study would survive correction for multiple statistical comparisons. In addition, the antipsychotic medication dose of patients was not reported. Another study from Turkey (Yilmaz et al. Reference Yilmaz, Kucuk, Ulgen, Ozkose, Demircan and Ulusoy2016) compared 34 patients and 30 controls. This study reported a significant degree of RNFL thinning, overall and in the nasal quadrant, and macula thinning in two quadrants, and these findings survived a Bonferroni correction for multiple comparisons. No data on medication usage were reported for the patients, however. In contrast to all of these studies, a study from the UK of 49 patients and 40 controls (Chu et al. Reference Chu, Kolappan, Barnes, Joyce and Ron2012) reported normal RNFL and macula thickness values in schizophrenia, overall and in all segments. This study used an older form of OCT, time domain OCT (TD-OCT), whereas all other studies used the newer, faster and higher resolution technique of spectral domain OCT (SD-OCT). On the other hand, TD-OCT has been used in many research studies in ophthalmology over many years and it is clearly able to detect retinal pathology when it exists. Therefore, we consider it unlikely that the negative findings from Chu et al. are solely equipment-related.
Taken together, these studies raise several questions. One is whether retinal layer thinning in schizophrenia can be observed independently of comorbid medical conditions such as diabetes and hypertension. Another question is whether retinal layer thinning would be observed in chronically ill patients on normative or low doses of antipsychotic medication. Also, given evidence of other retinal abnormalities in neuropsychiatric disorders, such as enlargement of the cup-to-disc ratio at the optic nerve head (see Fig. 2) (Tsai et al. Reference Tsai, Ritch, Schwartz, Lee, Miller and Chi1991; Syc et al. Reference Syc, Warner, Saidha, Farrell, Conger and Bisker2011), and the suggestion from a single published abstract (see above) that this abnormality may be present in schizophrenia, a question is whether this index is indeed abnormal in schizophrenia, and if so, whether it is related to loss of retinal tissue. Finally, given the well-documented visual processing abnormalities in schizophrenia [reviewed in (Silverstein, Reference Silverstein2016)], there remains the unanswered question of the extent to which these reflect retinal impairment (Silverstein & Rosen, Reference Silverstein and Rosen2015). The goal of this study was to address each of these questions.
Method
Subjects
Participants were 32 people with schizophrenia (SZ) (19 male) and 32 psychiatrically healthy controls (CON) (18 male), between the ages of 21 and 60. The groups were matched, at the group level, on age and gender. Within each group, 21 subjects were free of medical comorbidity that can affect retinal health (e.g. diabetes, hypertension) (Sz-DH and Con-DH subgroups) and 11 subjects had documented diabetes or hypertension (Sz + DH and Con + DH subgroups). All subjects were free of retinal or other eye injury or disease (e.g. cataracts, macular degeneration, diabetic retinopathy, glaucoma), as documented by medical records and by slit lamp biomicroscopy of the retina, conducted by an ophthalmologist (SG) as part of this study. All subjects were also free of neurological disorders, intellectual and developmental disorders (e.g. autism), active substance abuse disorders for at least 6 months, and a history of head injury with loss of consciousness of more than 10 min. All subjects provided written informed consent. The study was approved by the IRB at Rutgers Biomedical and Health Sciences.
Clinical assessment
Diagnoses of schizophrenia were confirmed by trained and experienced research assistants using the Structured Diagnostic Interview for DSM-IV, Patient Version (First et al. Reference First, Spitzer, Gibbon and Williams2002). Control subjects self-reported no history of DSM-IV Axis-I disorders. For the patient group, symptom severity for the past 2 weeks was assessed using the Positive and Negative Syndrome Scale (Kay et al. Reference Kay, Fiszbein and Opler1987), which was scored using a five-factor model consisting of positive, negative, cognitiveFootnote †Footnote 1, depression and excitement syndromes (Lindenmayer et al. Reference Lindenmayer, Bernstein-Hyman and Grochowski1994a, Reference Lindenmayer, Bernstein-Hyman and Grochowskib). The overall level of functioning of patients was assessed with the Multidimensional Scale of Independent Functioning (MSIF) (Jaeger et al. Reference Jaeger, Berns and Czobor2003). The current level of cognitive functioning in patients was assessed using the Wechsler Abbreviated Scale of Intelligence (WASI-II) (Wechsler, Reference Wechsler2011).
OCT
OCT data were acquired with a Cirrus 4000 HD-OCT scanner, which is an SD-OCT device. Data were acquired at a scan depth of 2 millimeters, with a resolution of 5 micrometers, at a rate of over 27 000 axial (A-) scans per second. Data were processed, in terms of layer segmentation, and thickness and volume values, using Cirrus software version 8.1.0.117. Macular and RNFL scans were acquired for each eye separately. GCL-IPL images were generated based on macular scan data. Prior to OCT scans, subjects’ pupils were pharmacologically dilated. For each eye, we report on: overall RNFL thickness as well as thickness of each RNFL quadrant (superior, inferior, nasal, temporal); symmetry of average RNFL values across the two eyes; macula central subfield (CSF) thickness, macula average thickness (including the CSF, intermediate regions bordering the CSF, and the 4 outer quadrants), macula volume (a 3D metric); GCL-IPL thickness; optic cup volume; and cup-to-disc ratio.
Visual assessment
Prior to the OCT session, all subjects were tested for visual acuity using a logarithmic acuity chart. Patients were also tested with: (1) a computerized contrast sensitivity task (Deveau et al. Reference Deveau, Lovcik and Seitz2014), from which peak (spatial frequency) and mean contrast sensitivity were recorded; (2) a contour integration test (Silverstein et al. Reference Silverstein, Keane, Barch, Carter, Gold and Kovacs2012); (3) a test assessing sensitivity to spatial frequency manipulation in facial images requiring gender discrimination (Silverstein et al. Reference Silverstein, All, Kasi, Berten, Essex and Lathrop2010); and (4) a test of size constancy (Silverstein et al. Reference Silverstein, Keane, Wang, Mikkilineni, Paterno and Papathomas2013). All of these tests measure functions that have been shown to be impaired in schizophrenia, and so their inclusion was to determine whether evidence of retinal structural impairment was related to performance on these tasks.
Data analysis
Differences between the two primary groups, and between the four subgroups, on OCT variables, were analyzed using the general linear model/univariate analysis of variance (ANOVA) procedure in SPSS 24. Effect sizes ( $\eta _{\rm p}^2 $), are reported (in Tables 2 and 3) in all cases. When a significant difference was observed in the analyses with the four subgroups, post-hoc Scheffé tests were used to probe for between-subgroup pairwise differences. Correlations between OCT indices and scores on other measures were explored using Spearman's Rho correlations. Group differences in demographic variables were explored using chi-square and ANOVA.
Results
Demographic data
Demographic data are presented in Table 1. The two primary groups (i.e. SZ, CON) did not differ in age [t(62) = −0.48, p = 0.64] or gender [χ2(1) = 0.064, p = 0.80]. However, when the four subgroups were considered there was a significant group difference in age [F(3,63) = 6.18, p = 0.001], with the Sz + DH group being older than the SZ-DH and CON-DH groups (ps = 0.002 and 0.012, respectively) based on post-hoc Scheffé tests.
Demographic data

OCT data
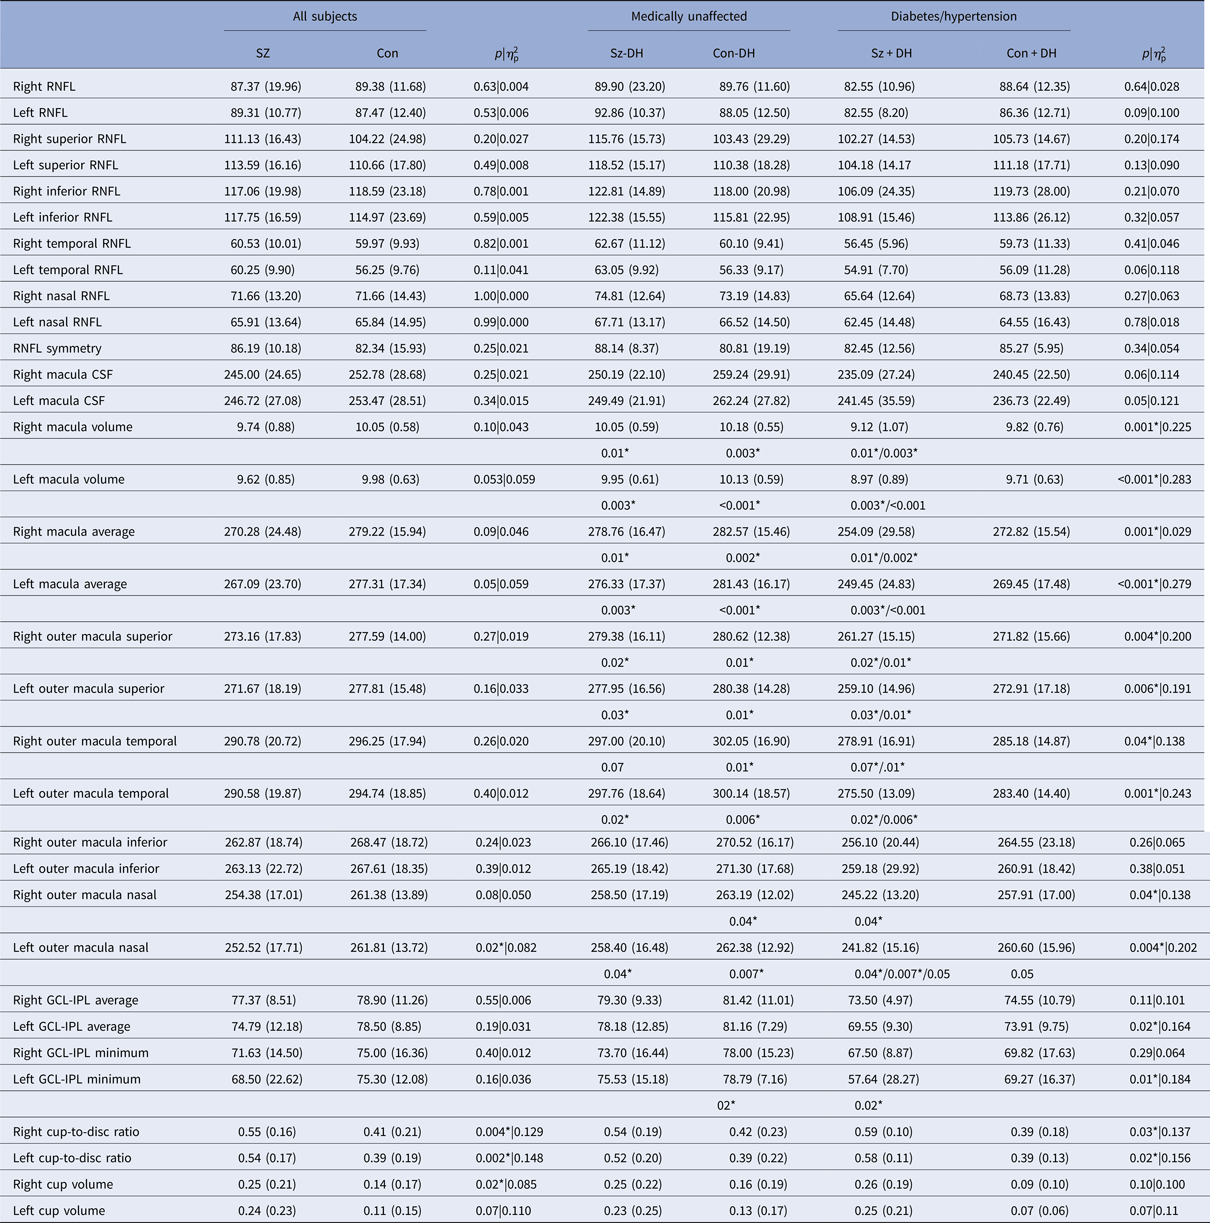
Means, standard deviations, and p values for group comparisons on RNFL, macula, GCL-IPL, and cup-to-disc ratio data are presented in Table 2. The two primary groups did not differ significantly on any RNFL variables (even without correction for multiple comparisons), including overall RNFL thickness, the thickness of any quadrant, and RNFL symmetry. Similarly, when the four subgroups were compared, there were no significant differences on any RNFL variables.
Means (SDs) of study variables for the two primary groups, and four subgroups. Column 4 displays the p values and effect sizes for the primary between-group comparisons (SZ v. CON). Column 9 displays p values and effect sizes for the four subgroup comparisons. In cases where the ANOVA revealed a significant difference between the four groups, post-hoc Scheffé tests were used to explore pairwise differences. Significant post-hoc test results are indicated in the row under the means and SDs for the four subgroups, with the p value associated with the significant pairwise difference under the groups that differed from each other

RNFL, retinal nerve fiber layer; CSF, central subfield; GCL-IPL, ganglion cell layer and inner plexiform layer.
* indicates a statistically significant result.
The two primary groups also did not differ significantly on macula CSF. The SZ group was characterized by trend level (using uncorrected p values only) thinning on measures of macula cube thickness and total macula cube volume, for both eyes. When the outer quadrants of the macula were examined, the SZ group demonstrated significant thinning of the left nasal region and a trend towards thinning of the right nasal region. When the four subgroups were compared on the same variables, there were significant group differences in all cases except for left and right macula inferior quadrants. Post-hoc Scheffé tests indicated that in all cases except one where the subgroup difference was significant, this was due to the Sz + DH group having lower thickness values than both the Sz-DH and Con-DH groups. This may be an age effect, however, as the SZ + DH group was the oldest of the four subgroups, and the CON + DH group did not demonstrate thinning relative to either the Sz-DH or Con-DH groups.
The two primary groups did not differ in either GCL-IPL mean thickness or minimum thickness in either the left or right eye. When the four subgroups were compared on the same variables, there were two cases where the Sz + DH group was characterized by thinner values than the Con-DH group only.
Striking differences were observed, however, on the variables of cup volume and cup-to-disc ratio. Here, the primary groups differed significantly on both variables, for both eyes. In some cases, the mean values for the SZ group were double that of the CON group (see Table 2). When the four subgroups were compared, the main effect of group was significant for the cup-to-disc ratio for both eyes, and at the trend level for cup volume for both eyes. While in every case the two patient subgroups had larger (i.e. more abnormal) values than the two control subgroups, post-hoc comparisons were not significant between any of the group pairs.
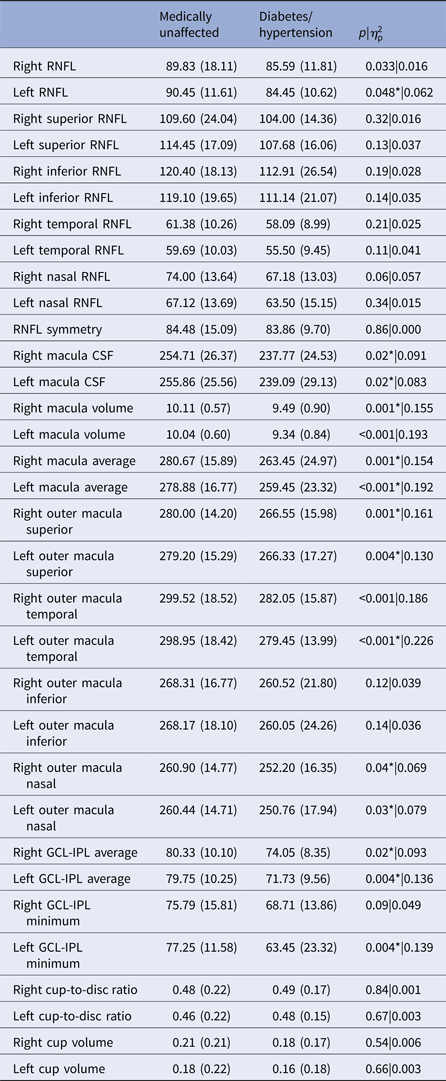
A final set of tests compared those subjects with diabetes or hypertension v. those without, regardless of whether they had schizophrenia. These data are presented in Table 3. In many cases, the medically affected group demonstrated thinning of retinal structures. This included left (but not right) eye RNFL, all macular thickness, and volume variables, most outer macular quadrants, GCL-IPL average thickness in both eyes, and GCL-IPL minimum thickness in the left eye (with a trend level finding for the right eye).
Comparisons between subjects medically affected by diabetes and/or hypertension and unaffected subjects (collapsed across schizophrenia and control). Column 4 displays the p values and effect sizes for these between-group comparisons

RNFL, retinal nerve fiber layer; CSF, central subfield; GCL-IPL, ganglion cell layer and inner plexiform layer.
* indicates a statistically significant result.
Relationships between OCT findings and visual function, symptoms, community functioning and medication dose (patient data only)
To reduce the number of tests and Type I error, for these sets of analyses (with the exception of correlations with medication, see below) we limited the OCT variables to cup volume, and cup-to-disk ratio, since these were the only indices on which the two primary groups differed. However, correlations were run for data from both eyes to serve as a preliminary check on the replicability of any significant finding. There were no cases where these variables correlated significantly or at a trend level with the visual task (e.g. contrast sensitivity, contour integration, sensitivity to spatial frequency manipulation, or size constancy), WASI-II, or MSIF scores for both eyes. In terms of symptoms, significant or trend level relationships were observed between PANSS Cognitive factor scores and: left cup-to-disc ratio (r = 0.34, p = 0. 07), right cup-to-disc ratio (r = 0.41, p < 0.05), and left and right eye cup volumes (rs = 0.48 and 0.45, ps = 0.01 and 0.02), respectively. Relationships with other symptom dimensions were not significant.
The mean daily CPZ equivalent dose of antipsychotic medication for the patient group was 462 mg (5% trimmed mean = 408; median = 391). Correlations with CPZ equivalent dose were examined with the variables of mean RNFL, macula CSF, cup-to-disc ratio, and cup volume, for the right and left eyes. Correlations with left and right RNFL thickness were not significant: (rs = −0.25 and −0.05, ps = 0.19 and 0.81, respectively). Similarly, correlations with left and right macula CSF were not significant (rs = 0.04 and 0.08, ps = 0.84 and 0.68, respectively). However, there were significant positive relationships between medication dose and cup volume for both the left and right eye (rs = 0.41 and 0.39, ps < 0.05). Correlations with cup-to-disc ratio were not significant (rs = 0.05 and 0.04, ps = 0.80 and 0.83).
Discussion
Our findings suggest that past reports of RNFL and macula thinning in schizophrenia overestimate their prevalence and severity. In this study, when medical comorbidity and age were eliminated as confounds, patients and psychiatrically healthy control subjects did not differ on a range of RNFL or macula variables. In contrast, across all subjects, the presence of diabetes or hypertension, conditions that can cause retinal thinning and that are over-represented and often untreated in schizophrenia, was consistently associated with, and presumably the cause of, RNFL and macula thinning.
Further support for the validity of our findings comes from data on healthy controls in several studies that used the same OCT scanning device that we used (Cirrus 4000). For example, (Vizzeri et al. Reference Vizzeri, Weinreb, Gonzalez-Garcia, Bowd, Medeiros and Sample2009) reported a mean RNFL thickness of 89.80 microns with a confidence interval of ±3.2. This is very close to our SZ means of 89.31 (left eye) and 87.37 (right eye), and CON group means of 87.47 (L) and 89.38 (R). The means for the Sz-DH (92.86 left; 89.90 right) and Con-DH (88.05 left; 89.76 right) groups were also close to the mean reported by Vizzeri et al. (see Table 2). Similar results were reported by (Wadhwani et al. Reference Wadhwani, Bali, Satyapal, Angmo, Sharma and Pandey2015) (mean = 93.62) and (Knight et al. Reference Knight, Chang, Feuer and Budenz2009) (mean = 92.00). These values agree with the normative RNFL mean of 93.00 published by CirrusFootnote 2. If indeed our data indicate normal RNFL and macula thickness in schizophrenia, it raises the possibility that the abnormal, but often inconsistent, findings reported in past studies are due to medical comorbidity, age effects, failure to control for multiple statistical tests (as discussed in the Introduction), and/or to the use of different OCT scanners and/or different retinal layer segmentation algorithms, which can vary in their findings (Warner et al. Reference Warner, Syc, Stankiewicz, Hiremath, Farrell and Crainiceanu2011). It is also possible that, as noted in the Introduction, differences across studies could result from variation in antipsychotic medication dosages across countries (e.g. Spain, Turkey, Malaysia, UK, USA). In our study, for example, the mean CPZ equivalent dose (even when including high dose outliers) was 35% lower than that reported by (Ascaso et al. Reference Ascaso, Rodriguez-Jimenez, Cabezon, Lopez-Anton, Santabarbara and De La Camara2015). The effect of retinal dopamine blockade on atrophy of post-synaptic retinal cells, as described in the Introduction, is an issue in need of further exploration.
A novel and potentially important finding from this study was that the cup-to-disc ratio was enlarged in people with schizophrenia, in both eyes, and independent of diabetes or hypertension. Findings of the enlarged cup-to-disc ratio are typically attributed either to RNFL thinning, vascular compromise (e.g. loss of retinal capillaries) (Geyman et al. Reference Geyman, Garg, Suwan, Trivedi, Krawitz and Mo2017), or enlarged optic nerves. Because we did not observe evidence of RNFL thinning in schizophrenia, we consider it unlikely that this is involved. On the other hand, the second possibility is supported by prior evidence of vascular abnormalities in schizophrenia (Curtis et al. Reference Curtis, Iacono and Beiser1999; Moises et al. Reference Moises, Wollschlager and Binder2015; Najjar et al. Reference Najjar, Pahlajani, De Sanctis, Stern, Najjar and Chong2017), including in the retina (Meier et al. Reference Meier, Shalev, Moffitt, Kapur, Keefe and Wong2013). To our knowledge, there are no published data on optic nerve size in schizophrenia, and thus it is not clear how robust this finding is, or what might cause this effect. One possibility is inflammation. Ascaso et al. (Reference Ascaso, Rodriguez-Jimenez, Cabezon, Lopez-Anton, Santabarbara and De La Camara2015) suggested that inflammation in recently psychotic patients may have masked retinal layer degeneration, leading to relatively normal OCT values, in contrast to patients who did not have a recent psychotic episode. In this view, both the relatively normal thickness values we observed and the enlarged optic cup volume and cup-to-disc ratio values, could be due to inflammation. However, several points argue against this. One is that very few of the patients in this study would have met criteria for Ascaso et al.’s recent illness episode group, in that their most recent hospitalization was longer than 6 months prior to study participation. Second, evidence of optic nerve edema was not observed upon ophthalmologic examination, which every subject received. Additional studies are needed, therefore, to determine the pathophysiology of cup-to-disc ratio and cup changes in schizophrenia. An enlarged cup-to-disc ratio has previously been observed in MS (see above) and in AD (see above). Therefore, if replicated, this finding in schizophrenia would suggest a shared aspect of pathophysiology with these other neuropsychiatric disorders, and one that may be independent of RNFL and macula thinning (Saidha et al. Reference Saidha, Syc, Ibrahim, Eckstein, Warner and Farrell2011). And, even though the finding is not diagnostically specific, it, and perhaps the variable of cup volume could be useful in tracking disease progression, especially (given the correlation with PANSS Cognitive factor score) regarding cognitive symptoms. An important caveat here is that cup volume, but not a cup-to-disc ratio, was positively correlated with CPZ equivalent medication dose. Whether this reflects a true medication effect, or an illness severity effect, or some other effect is currently unknown. It is possible, however, that the dual correlations of cup volume with PANSS cognitive symptoms and medication dose reflect all three features representing aspects of poor outcome patients. For example, several studies indicate that disorganization (one of the symptoms on the PANSS Cognitive factor) is highly heritable and linked to features such as impaired attention, poor premorbid social adjustment, and poor long-term functional outcome. Moreover, these features typically correlate with each other and have been hypothesized to represent a ‘poor outcome’ or ‘process’ subtype of schizophrenia with a strong genetic influence (Farmer et al. Reference Farmer, Mcguffin and Spitznagel1983; Sham et al. Reference Sham, Castle, Wessely, Farmer and Murray1996; Wickham et al. Reference Wickham, Walsh, Asherson, Taylor, Sigmundson and Gill2001; Wickham et al. Reference Wickham, Walsh, Asherson, Gill, Owen and Mcguffin2002). It may be, therefore, that patients judged to be more severely ill are prescribed higher doses of medication, and that this accounts for our findings. Related to this, some types of antipsychotic and antidepressant medications commonly given to people with schizophrenia act as serotonin agonists (e.g. ziprasidone, selective serotonin reuptake inhibitors) and this can raise intra-ocular pressure and lead to glaucoma, which could contribute to changes in optic nerve parameters (Souza et al. Reference Souza, Moura Filho, Souza, Pereira Filho, Coelho and Furtado2008) even prior to criteria for glaucoma being met.
This study had several limitations. One is that the sample sizes (32 per group) were relatively small, and the sizes of the subgroups (21 and 11 within each group of 32) were such that some of the tests were likely underpowered. On the other hand, our sample sizes for the two primary groups were similar to, and in some cases larger than, those of several other studies in which between-group differences were reported, and so, at least in most cases, adequate power should have existed to detect effects. Another limitation is that the subgroup with both schizophrenia and diabetes/hypertension was older than the other three subgroups. While this group differed from other groups primarily on macula indices, and these findings could be due to age effects, the inequality in ages precluded our ruling out age as a factor. Because of this, we cannot make any statement about a possible interaction between schizophrenia and medical comorbidity. On the other hand, the lack of a difference between the two primary groups indicated clearly that schizophrenia alone did not lead to retinal thinning. A third limitation is that we did not quantify recent or general nicotine intake. The thickness of retinal layers is inversely associated with smoking (Patel et al. Reference Patel, Foster, Grossi, Keane, Ko and Lotery2016), although in medically healthy individuals who smoke thinning is not observed (Duman et al. Reference Duman, Duman, Sabaner and Cetinkaya2017), suggesting there may not be a direct or causal relationship. Still, the contribution of smoking, even if indirect, cannot be ruled out in our findings, which is relevant given that people with schizophrenia smoke at a higher rate than the general population. On the other hand, the fact that we did not observe between-group differences on most variables should inspire confidence that at least most of our findings are not secondary to schizophrenia-related smoking rates. However, it is possible that the differences in findings between our study and most other studies are due to differences in smoking rates among schizophrenia patients and other people in other countries. An additional limitation of this and prior OCT studies in schizophrenia is that only a few retinal layers were imaged. While the RNFL and macula have been the most common foci of OCT studies, advances in OCT technology are now making it possible to determine the thickness of individual layers anterior to the GCL-IPL, including the photoreceptor layer. Therefore, much remains to be explored regarding retinal structural impairment in schizophrenia.
Finally, an unanswered question in OCT research, including in schizophrenia, is the origin of the retinal pathology. In one view, retinal thinning parallels cortical thinning, with both being aspects of CNS neuronal degeneration. A second view noted above is that antipsychotic medication can directly cause retinal thinning. An alternative hypothesis, however, is that retinal thinning is secondary to progressive tissue loss in the visual cortex, with this leading to retrograde trans-synaptic degeneration (RTSD). RTSD has been observed experimentally in animal TBI studies, and clinically and histologically in humans [reviewed in (Dinkin, Reference Dinkin2017)]. In these cases, occipital lobe injury appeared to lead to the death of cells providing input to the injured cortical regions [i.e. cells in the lateral geniculate nucleus (LGN) of the thalamus], and this, in turn, led to a reduction in retinal ganglion cells, which synapse at the LGN. It is not known at this point whether retinal atrophy via RTSD occurs secondary to progressive occipital tissue loss, as has been observed in schizophrenia, and attributed to increased medication use (Ho et al. Reference Ho, Andreasen, Ziebell, Pierson and Magnotta2011; Fusar-Poli et al. Reference Fusar-Poli, Smieskova, Kempton, Ho, Andreasen and Borgwardt2013) and other developmental or illness effects (Dorph-Petersen et al. Reference Dorph-Petersen, Pierri, Wu, Sampson and Lewis2007; Mitelman & Buchsbaum, Reference Mitelman and Buchsbaum2007; Onitsuka et al. Reference Onitsuka, Mccarley, Kuroki, Dickey, Kubicki and Demeo2007; Tohid et al. Reference Tohid, Faizan and Faizan2015). However, determining the relationships between occipital atrophy and retinal thinning cross-sectionally and longitudinally in schizophrenia would be informative. If such a relationship is observed, and if occipital atrophy preceded evidence of retinal thinning, this would suggest an alternative hypothesis for why our data, and the data of (Chu et al. Reference Chu, Kolappan, Barnes, Joyce and Ron2012) differed from all other published studies. While preliminary evidence against this hypothesis comes from post-mortem studies indicating normal LGN volumes in schizophrenia (Selemon & Begovic, Reference Selemon and Begovic2007; Dorph-Petersen et al. Reference Dorph-Petersen, Caric, Saghafi, Zhang, Sampson and Lewis2009), both of these studies were small (patient sample sizes of 9 and 15, respectively). Relatedly, occipital lobe atrophy (and subsequent retinal atrophy), would only be expected in the subgroup of patients with the most severe illness course (Mitelman & Buchsbaum, Reference Mitelman and Buchsbaum2007; Onitsuka et al. Reference Onitsuka, Mccarley, Kuroki, Dickey, Kubicki and Demeo2007; Tohid et al. Reference Tohid, Faizan and Faizan2015), and so the two prior studies of LGN volumes may not have had enough power to detect subgroup effects, or between-group differences. On the other hand, RTSD is thought to occur in MS and to be responsible for a proportion of retinal cell loss in this condition (Petzold, Reference Petzold, Calabrese, Balcer and Frohman2015; Petracca et al. Reference Petracca, Cordano, Cellerino, Button, Krieger and Vancea2017). Since MS often has progressive features, and shares many of the same cognitive impairments found in schizophrenia (Guimaraes & Sa, Reference Guimaraes and Sa2012), we believe that RTSD as one of the causes of retinal changes in at least some schizophrenia patients should be investigated further.
In summary, in a sample of schizophrenia patients that were carefully screened for retinal pathology, and for medical comorbidity that can affect the retina, we did not observe RNFL or macula thinning, which had been reported in several prior studies. In contrast, RNFL, macula, and GCL-IPL thinning were related to the presence of diabetes or hypertension. However, we observed an enlarged cup-to-disk ratio, along with enlarged cup volume, in schizophrenia, and this was observed in both eyes, associated with cognitive symptoms, and unrelated to medical comorbidity.
Acknowledgements
This study was funded solely via internal sources at Rutgers University.
We thank Robyn Green, Toby Horowitz, the staff at NJ Retina, and the staff at Rutgers University Behavioral Health Care for their assistance with this project. We also thank Richard Rosen for his helpful input on data interpretation. Finally, we thank all of the people who participated in this study for their time and cooperation. The authors report no conflicts of interest related to this study.