I. INTRODUCTION
Petroleum coke (PC) is a waste by-product of delayed-coking process. Recently, with the development of crude oil refining technology, the output of petroleum coke increases steadily in China, India, the Middle East, and the North American. Reference Al-Haj-Ibrahim and Morsi1 The value-added exploitation of petroleum coke has become a tough problem. It is demonstrated that petroleum coke is a good precursor of porous carbon due to its high carbon content, low ash content and volatile, and low economic cost (about $100 per ton). Preparing porous carbon from petroleum coke is one of efficient strategies to make petroleum coke value-added. Reference Rambabu, Azargohar, Dalai and Adjaye2 However, petroleum coke is rich of benzene rings or aromatic domains and has dense structure, resulting in difficulties in activation.
Up to date, chemical activation with KOH is still a primary means Reference Al-Haj-Ibrahim and Morsi1–Reference Zhang, Liu, Li and Lu12 to activate petroleum coke. For example, Kawano et al. Reference Kawano, Kubota, Onyango, Watanabe and Matsuda3 prepared activated carbon from petroleum coke with KOH. With the increase of activation temperature and KOH/coke weight ratio, the porosity of the resulted carbon increased. The surface area of the activated carbons can reach up to 1798 m2/g at the KOH/coke weight ratio of 5:1. Qiao et al. Reference Qiao, Yoon and Mochida13 prepared activated carbon from anisotropic petroleum-based needle coke by KOH activation. The dosage of KOH was four times that of petroleum coke. The activated carbon possessed a large surface area of 2450 m2/g and abundant micropores (smaller than 2 nm). To further accelerate the chemical activation, petroleum coke was preoxidized by such oxidants as air, Reference Wei and Feng14 H2O2 Reference Lu, Xu, Gan, Liu and Liu15 and HClO4 Reference Jiang, Zhang, Zhou, Zhang and Chen16 in some recent works. For example, petroleum coke was oxidized by 20 wt% H2O2 aqueous solution and then activated by KOH activation. The BET surface area and average pore size of the activated carbon were 2744 m2/g and 1.2 nm, respectively. Reference Lu, Xu, Gan, Liu and Liu15 Jiang et al. Reference Jiang, Zhang, Zhou, Zhang and Chen16 prepared activated carbon from petroleum coke by a combination of preoxidation and KOH activation. The results suggested that the pre-oxidation of petroleum coke using HClO4 or H2O2 can increase the specific surface area of the resulting microporous carbon. All the previous works show that direct KOH activation of petroleum coke can result in carbons with a very large surface area and high microporosity.
Other researchers turned to another strategy to prepare porous carbons from petroleum coke. They fully oxidized petroleum coke into amphiphilic carbonaceous material (ACM) with concentrated nitric acid and sulfuric acid firstly. This soluble ACM Reference Tateishi, Esumi and Honda17,Reference Tateishi, Esumi, Honda and Oda18 is much easier to be further processed into porous carbons with various morphologies. Reference Esumi, Eshima, Murakami, Honda and Oda19–Reference Yuan, Zhang, Wang and Chen24 For instance, Esumi et al. Reference Esumi, Eshima, Murakami, Honda and Oda19 prepared hollow carbon microbeads from ACM using water-in-oil emulsion method. The BET specific surface area of the carbon microbeads was only 11 m2/g. Li et al. Reference Li, Yan and Dai20 synthesized a vesicular carbon by soft template method using ACM as a carbon precursor and hexadecyl trimethyl ammonium bromide (HTAB) as a surfactant. The vesicular carbon displayed thin shells of 5–30 nm with mesopores (2–4 nm) in the shell. However, the specific surface area of the vesicular carbon is quite small. Wang et al. Reference Wang, Chen, Wang, Wang and Zheng22 prepared activated carbon from ACM by KOH activation. This ACM-based activated carbon was a microporous carbon with a large surface area over 3000 m2/g. Yuan et al. Reference Yuan, Zhang, Wang and Chen24 synthesized carbon aerogels from ACM by a solvent exchange induced self-assembly method. The BET specific surface area and average pore size of the ACM-based carbon aerogels were 366 m2/g and 0.5–1 nm, respectively. After KOH activation, the resulting products possessed a large amount of micropores, and the BET specific surface area was up to 2435 m2/g. In our knowledge, mesoporous carbons with a high surface area derived from petroleum coke has not yet been prepared.
Herein, we synthesized mesoporous carbon with high surface area from petroleum coke by hard-templating method for the first time. The as-prepared carbon possessed a large surface area of up to 864 m2/g and average pore size of 6 nm. To utilize the high surface area and abundant mesoporosity of the carbon, anthraquinone (AQ)-modified carbon was explored as a supercapacitor electrode material. Electrochemical measurements demonstrated that the specific capacitance of AQ-modified carbon can reach up to 366 F/g at the current density of 1 A/g, indicating a promising prospect of the as-prepared carbon in energy-storage applications.
II. EXPERIMENTAL PROCEDURE
A. Materials
Petroleum coke was provided by Shengli refinery. Alkaline silica sol was purchased from Qingdao Marine Chemical Co., Ltd. (Qingdao, China). Cetyl trimethyl ammonium bromide (CTAB), concentrated sulfuric acid (H2SO4), concentrated nitric acid (HNO3), sodium hydroxide (NaOH), hydrofluoric acid (HF), and ethyl alcohol (CH3CH2OH) were purchased from Sinopharm Chemical Reagent Co., Ltd. (Beijing, China) and used without further purification. Anthraquinone (AQ) was purchased from Aladdin Chemical Reagents Company (Shanghai, China). Deionized water (DI) was prepared by a Millipore pure water system.
B. Synthesis of mesoporous carbon from petroleum coke
The carbon samples were synthesized using CTAB-modified colloidal silica as a hard template. Reference Han and Hyeon25 In a typical synthesis, 1.2 g CTAB was added to 30 mL of colloidal silica solution (30 wt%), and the mixture was stirred for 20 min at 50 °C, leading to a muddy slurry. The CTAB-modified silica particles were washed by distilled water to remove un-adsorbed CTAB from the muddy slurry. On the other hands, 5 g of petroleum coke was added to the mixture of concentrated H2SO4 and HNO3 (V/V = 7/3). After reaction at 80 °C for 3 h, the ACM Reference Tateishi, Esumi and Honda17 was synthesized for further use. 1.2 g ACM was dissolved in 20 mL of NaOH solution (0.01 M). The CTAB-modified silica particles were added into the above solution under vigorous stirring for 2 h, and then transferred into a sealed autoclave and kept at 100 °C for 24 h. Thereafter, the product was filtrated and washed with water for 2 times, then dried at 80 °C. The carbonization process was performed at 800 °C for 2 h with a ramping rate of 1 °C/min under Ar atmosphere. After the mixture cooled down to room temperature, the silica template was removed by washing the mixture with 48 wt% HF acid and then with water until the pH value of filtrate became neutral. Finally the sample was dried at 80 °C and referred to as C30, where 30 denoted the volume of colloid silica added (30 mL). For comparison, the samples prepared using different volumes of colloid silica (50 and 80 mL) are designated as C50 and C80, respectively.
C. Synthesis of AQ modified mesoporous carbon
0.01 g AQ was dissolved in 40 mL of ethanol at 65 °C, and then 0.05 g C50 were added under magnetic stirring. The mixture was kept at 65 °C for 2 h under impermeable condition. The resultant was obtained by evaporating the ethanol and referred to as C50-AQ20, where 20 denoted how many weight percentages of AQ were loaded on the carbon. For comparison, C50-AQ30 and C50-AQ40 were also prepared.
D. Materials characterization
The surface morphologies and microstructure of all samples were observed by field emission scanning electron microscopy (SEM; Hitachi-S-4800, Hitachi Corp., Tokyo, Japan) and transmission electron microscopy (TEM; JEOL-2100UHR, JEOL Ltd., Tokyo, Japan). Nitrogen adsorption–desorption isotherms were measured at 77 K on an ASAP 2020 analyzer (Micromeritics, Norcross, Georgia). The specific surface area of the samples was calculated by the Brunauer–Emmett–Teller (BET) method in the relative pressure (P/P 0) between 0.06 and 0.3, and the total pore volume was determined from the amount of nitrogen uptake at a relative pressure (P/P 0) of 0.99. The pore size distribution (PSD) was calculated by Barrett–Joyner–Halenda (BJH) method using nitrogen desorption branch data. Graphitic structure was investigated by powder X-ray diffraction (XRD; PANanalytical B.V., Almelo, Netherlands) with a Cu anode and by Raman spectroscopy (RM2000, Renishaw, Gloucestershire, UK). The surface properties of the samples were characterized by FT-IR (Nicolet 6700, Thermo Scientific, Waltham, Massachusetts). UV–vis detection was performed on a UV–vis spectrophotometer (SPECORD 210 PLUS UV, Analytik Jena AG, Jena, Germany).
E. Electrochemical measurements
The carbon materials were mixed with polytetrafluoroethylene (PTFE) at a mass ratio of 95:5. After drying at 60 °C for 12 h, the mixture was pressed onto a titanium mesh which was treated with 1 mol/L HCl solution in advance, and used as a working electrodes (the carbon mass was 2 mg and the area was 1 cm2). All electrochemical tests, such as cyclic Voltammetry (CV) and galvanostatic charge/discharge (GCD) were performed on a CHI660E testing station in a three-electrode system using platinum film as a counter electrode and a calomel electrode (SCE) as a reference electrode. All of the carbon materials were evaluated in 1 M H2SO4 solution. CV test was recorded in the potential window of −0.4–0.4 V. GCD test was recorded in the potential window of −0.25–0.4 V. The specific gravimetric capacitance in three electrode system was calculated from the galvanostatic discharge curves according to the following equation:
 $${C_{\rm{g}}} = {{I\Delta t} \over {m\Delta v}}\quad ,$$
where I (A) is the discharge current, Δt (s) is the discharge time, m (g) is the mass of the active material contained in the working electrode, and Δv (V) is the potential drop during discharge process.
III. RESULTS AND DISCUSSION
A. Synthetic mechanism
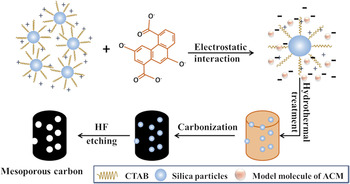
Scheme 1 shows synthetic process of mesoporous carbon from ACM. Alkaline colloidal silica particle is slightly negative charged in the solution, and CTAB is a cationic surfactant with strong positive charge in the solution. In the mixture of silica sol and CTAB, the CTAB-modified silica particle is positively charged overall. On the other hand, ACM molecule is negative charged at high pH value. Because of electrostatic interaction between CTAB-modified silica particles and ACM molecules, their uniform combination is realized under hydrothermal condition. Finally, the mesoporous carbon is obtained by carbonization, followed by dissolving silica nanoparticles by HF etching.
Scheme illustration of the formation of mesoporous carbon from ACM.

B. Morphology and structure of mesoporous carbon
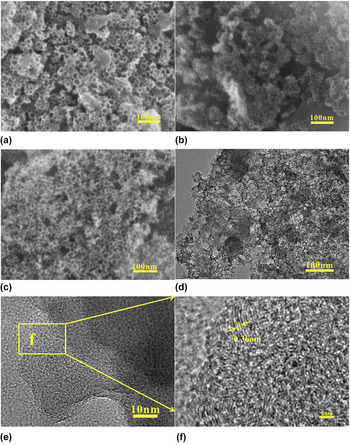
The surface morphologies and microstructure of carbon samples were observed by SEM and TEM, as are shown in Fig. 1. After the removal of silica nanoparticles by HF etching, spherical mesopores were formed in the carbon samples [Figs. 1(a)–1(c)]. These SEM images revealed a network of well-developed mesopores. Similar mesoporous structure of C50 was observed by TEM [Fig. 1(d)]. Moreover, the carbon sample of C50 contained a lot of graphitic crystallites, and the lattice distance was measured to be 0.36 nm [Fig. 1(f)], suggesting relatively high degree of graphitization. This high graphitic degree is beneficial for conductivity of carbon materials. Reference Li, Chungui, Yu, Ying, Jie, Lei and Honggang26
SEM images of C30 (a), C50 (b) and C80 (c); TEM image (d) and high resolution TEM images (e, f) of C50. (f) is the selected area of (e).

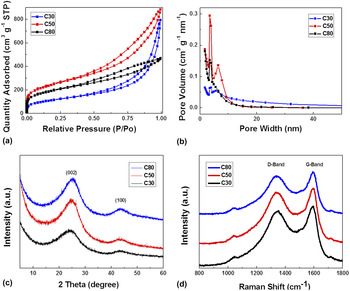
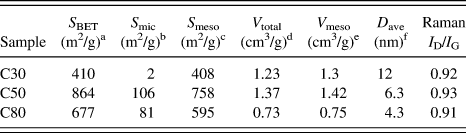
The surface area and pore structures of carbon samples were determined by nitrogen adsorption–desorption at 77 K. N2 adsorption–desorption isotherms [Fig. 2(a)] show that all the carbon samples present type IV isotherm with a significant hysteresis loop at the relative pressure ranging from 0.4 to 1.0, which suggests the formation of mesopores. This is consistent with SEM and TEM observations. The pore size distribution curves [Fig. 2(b)] also confirm the existence of the mesopores. As listed in Table I, the BET specific surface area and pore volume of C50 are 864 m2/g and 1.37 cm3/g, respectively, larger than those of C30 and C80. These results are connected with the amount of colloidal silica solution used. Reference Olejniczak, Lezanska, Wloch, Kucinska and Lukaszewicz27 For C30 sample, due to the low dosage of colloidal silica solution, the porosity of C30 sample was insufficiently developed. However, the C80 sample was overloaded with silica so that the thin mesopore walls of the carbon may collapse during silica removal. All of the textural data are summarized in Table I.
Nitrogen adsorption–desorption isotherms (a); BJH pore size distribution curves (b); XRD patterns (c) and Raman spectra (d) of C30, C50, and C80.

Surface area and pore structure parameters and I D/I G obtained from Raman spectra of C30, C50, and C80.

a BET surface area determined by N2 adsorption.
b Micropore surface area calculated by the t-plot method.
c Mesopore surface area S meso = S BET − S mic.
d Total pore volume measured at a relative pressure (P/P 0) of 0.99.
e Mesopore volume calculated by BJH method.
f Average pore size calculated by 4V total/S BET.
The crystal phase of the carbon samples was characterized by X-ray diffraction (XRD). As shown in Fig. 2(c), two broad diffraction peaks at 25.2° and 43.8° were assigned to the (002) and (100) planes of graphite, respectively. This indicates a certain graphitic degree, Reference Wang, Yi, Zhu, Wang and Fan28 which is in good agreement with TEM observations. Compared with the carbons from phenolic resin (23°) Reference Wang, Shi, Jin, Chong and Wang29 and coconut shell (22.5°), Reference Le, Le, Chin and Jurng30 the (002) diffraction peak of the carbon from petroleum coke shifts to a higher angle, also suggesting a higher graphitization degree.
To further analyze the skeleton structure of C30, C50, and C80, Raman spectroscopy was carried out [Fig. 2(d)]. Two broad peaks at 1352 cm−1 and 1595 cm−1 are displayed, representing the D and G peaks, respectively. The D peak is a characteristic feature of disordered carbon or defective graphitic structures, while the G peak originates from in-plane vibration of sp2 carbon atoms, suggesting the existence of graphitic layers. Reference Jin, Wei, Jin, Qiang, Ping, Feng, Zhong and Zhang31 Meanwhile, the relative intensity between the D and G peaks (I D/I G) is usually used to evaluate the quality of the graphitic structures. The I D/I G ratio of C30, C50, and C80 (Table I) was 0.92, 0.93, and 0.91, respectively. Compared with the I D/I G ratio of carbons from sucrose (1.09), Reference Kumar, More, Mohanty, Nemala, Mallick and Bhargava32 potato starch (1.03), Reference Qiang, Hu, Yang, Li, An, Ren, Hu and Wu33 and biomass (1.02), Reference Li, Lv, Zhang, Li, Kang and Yang34 the I D/I G ratio of the carbons from petroleum coke is relatively smaller. The results indicate that the carbons prepared in this work contain more graphitic carbon atoms, Reference Huanlei, Zhanwei, Alireza, Zhi, Kai, Xuehai, Tyler James, King’Ondu, Holt and Olsen35 which is consistent with the XRD and TEM observations.
C. Evidence of AQ loading on mesoporous carbon
Porous carbons Reference Huang, Wang, Wang, Zhang, Lu and Wang36 are used as electrode materials of supercapacitor because of its high specific surface, outstanding electrical conductivity, and mechanical stability. The specific capacitance Reference Li and Wei37 of porous carbons is usually less than 300 F/g, which is limited by the value of electric double-layer capacitance that can be formed on per unit carbon surface, 15–20 μF/cm2. Reference Béguin, Presser, Balducci and Frackowiak38,Reference Xiong, Meng, Reifenberger, Irazoqui and Fisher39 Also, as electrode materials of supercapacitor, metallic oxide and conducting polymer can bring about large pseudocapacitance by surface faradaic reactions. Reference Vangari, Pryor and Li40 Then, to improve the specific capacitances of carbons, people used metallic oxide Reference He and Chen41–Reference Sawangphruk, Srimuk, Chiochan, Krittayavathananon, Luanwuthi and Limtrakul43 or conducting polymers Reference Niu, Luan, Shao, Dong, Li, Chen, Zhao, Cai, Zhou, Chen and Xie44,Reference Song, Xu and Liu45 to modify carbon materials. In recent years, a new way to improve the capacitive performance of carbons is to modify with active quinones. Reference Xu, Lin, Huang, Yang, Yu and Duan46,Reference An, Zhang, Hu, Li, Li, Yang, Guo and Lei47 Herein, to utilize the high surface area and abundant mesopores and improve the capacitive performance of the carbon prepared in this work, anthraquinone (AQ)-modified carbon was explored as a supercapacitor electrode.
To prove the successful loading of AQ on the mesoporous carbon, FT-IR reflectance, nitrogen sorption, and UV–vis absorption spectra were tested.
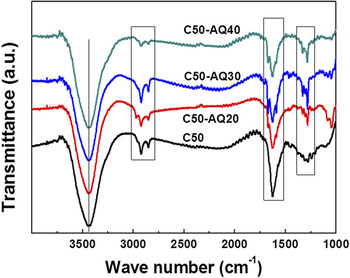
FT-IR reflectance spectroscopy was conducted to prove the existence of AQ on the mesoporous carbon. It is shown in Fig. 3 that the peaks at 1283 cm−1 and 1676 cm−1 of C50-AQs samples are consistent with the absorption of pure AQ, Reference Chen, Wang, Yi, Wang, Yan and Guo48 which originated from the aromatic skeleton stretching vibration and the C = O stretching vibrations, respectively. This strongly confirms that the AQ was adsorbed on the surface of C50.
FT-IR spectra of C50 and C50-AQs.

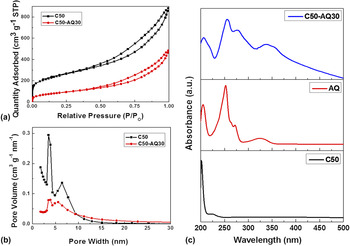
After AQ loading, C50-AQ30 also displays type IV adsorption isotherm, as is shown in Fig. 4(a). However, the BET surface area and total pore volume of the sample decline to 317 m2/g and 0.75 cm3/g (Table S1), respectively, implying that AQ was loaded onto the pore surface of C50. Furthermore, compared with C50, the volume of small mesopores (<8 nm) drops dramatically [Fig. 4(b)], suggesting AQ molecules were most probably loaded into small mesopores.
Nitrogen adsorption–desorption isotherms of C50 and C50-AQ30 (a); BJH pore size distribution of C50 and C50-AQ30 (b) and UV–vis absorption spectra of C50, AQ and C50-AQ30 (c).
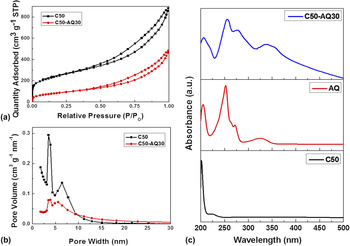
The UV–vis absorption spectroscopy was also carried out to prove the successful loading of AQ on the mesoporous carbon. As shown in Fig. 4(c), the C50 displays a weak absorption band at 271 nm which was assigned to π–π* transition of aromatic C–C bonds. For AQ, a short-wavelength absorption bands at 251 nm is an indication of the π–π* transitions, and the weak absorption band at 325 nm is attributed to the n–π* transitions. Nevertheless, the characteristic absorption bands of both C50 and AQ are observed at the UV–vis absorption spectrum of C50-AQ30, again suggesting the successful loading of AQ on the mesoporous carbon. Reference Xu, Lin, Huang, Yang, Yu and Duan46,Reference An, Zhang, Hu, Li, Li, Yang, Guo and Lei47
D. Electrochemical tests
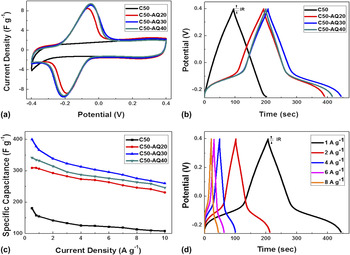
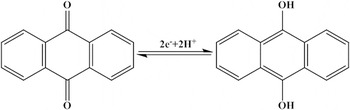
To evaluate capacitive performance of C50 and C50-AQ30, these samples as electrodes material were tested in 1 M H2SO4 solution by CV and GCD methods. The CV curves of C50 at a scan rate of 10 mV/s [Fig. 5(a)] displayed a rectangular shape in the potential window of −0.4–0.4 V (versus SCE), suggesting a perfect double-layer capacitive behavior. By contrast, the CV curves of C50-AQs present obvious redox peaks with an anodic peak at −0.05 V and a cathodic peak at −0.21 V, due to the redox reaction of AQ. The corresponding redox reaction is shown below (Scheme 2). Reference May, Daniel, Wasylkiw and Smith49 The specific capacitance of C50-AQs was a superposition of the double layer capacitance of mesoporous carbon and Faradaic pseudocapacitance of AQ molecules. Reference An, Zhang, Hu, Li, Li, Yang, Guo and Lei47 In addition, as shown in Fig. 5(a), the C50-AQ30 and C50-AQ40 electrodes have similar peak separation of 160 and 162 mV. And the C50-AQ20 electrode has much smaller peak separation of 120 mV. These phenomena are closely related to the AQ loading. Reference Chen, Wang, Yi, Wang, Yan and Guo48 In the case of low AQ loading, e.g., C50-AQ20, there is very thin layer of AQ molecules adsorbed on the mesopore surface by the π–π stacking interactions between AQ and carbon surface, resulting in low charge transfer resistance. With the rise of AQ loading, thicker layer of AQ molecules are adsorbed on the mesopore surface, which leads to the decrease of mesopores size. At this case, the charger transfer resistance and the ion diffusion resistance will be increased, resulting in stronger electrode polarization for C50-AQ30 and C50-AQ40 electrodes.
CV curves of C50 and C50-AQs at a scan rate of 10 mV/s (a); GCD curves of C50 and C50-AQs at a current density of 1 A/g (b); specific capacitance at various current densities from 1 to 10 A/g (c) and GCD curves of C50-AQ30 at various current densities of 1, 2, 4, 6, and 8 A/g (d).

The redox reaction of AQ.

In addition, we found that the response current density of C50-AQs in the potential window of −0.4–0.3 V and 0.1–0.4 V was in agreement with that of C50, suggesting the double layer capacitance of C50-AQs did not reduce obviously after AQ loading, although the BET specific surface area and pore volume of C50-AQs were apparently smaller than those of C50. This is possibly because the pore surface, which is blocked by AQ molecules and can not be detected by the adsorbate of N2, is accessible for smaller electrolyte ions (or desolvated ions) under electric field force. Reference Wu, Xing, Florek, Zhou, Wang, Zhuo, Xue, Yan and Kleitz50,Reference Wu, Zhou, Xing, Zhang, Bai, Xu, Zhuo, Xue and Yan51
The GCD curves of C50 and C50-AQs at a current density of 1 A/g in the voltage window of −0.25–0.4 V (versus SCE) are shown in Fig. 5(b). The GCD curves of C50 displays an isosceles triangle, indicating the double-layer capacitance characteristic. The GCD curves of C50-AQs consist of two obvious potential plateaus which are derived from the quick Faradaic reactions of AQ. This is consistent with the CV curves. C50-AQ30 shows the longest discharge time, and possesses the highest specific capacitance of 366 F/g at the current density of 1 A/g and 260 F/g at the current density of 10 A/g with a capacitance retention ratio of 71% [Fig. 5(c)]. Meanwhile, Fig. 5(d) shows the GCD curves of C50-AQ30 at different current densities. We noticed that the GCD curve at the current density of 8 A/g still possessed the potential plateau. In addition, the IR drop of C50-AQ30 was not obvious, which means that its internal resistance was small due to the strong π–π stacking interaction between AQ and C50 that reduces charge transfer resistance.
IV. CONCLUSION
In our work, mesoporous carbons with high surface area were synthesized from petroleum coke by hard-templating method for the first time. The carbon sample of C50 that possesses high specific surface area and large pore volume is an ideal carbon (supporter) for electrochemical energy storage. As demonstrated by electrochemical measurements, AQ-loaded mesoporous carbons exhibit excellent capacitive performances, highlighting the prosperous application of petroleum coke-derived carbon in this field. Besides, the synthetic strategy developed in this work can also be adapted to prepare other nanostructured carbons from petroleum coke.
Supplementary Material
To view supplementary material for this article, please visit https://doi.org/10.1557/jmr.2017.36.
ACKNOWLEDGMENTS
This work was financially supported by National Natural Science Foundation of China (21476264), Distinguished Young Scientist Foundation of Shandong Province (JQ201215), Taishan Scholar Foundation (ts20130929) and Fundamental Research Funds for the Central Universities (15CX05029A, 15CX08009A), Graduate Student Innovation Project of China University of Petroleum (East China) (YCXJ2016082).