Most of the poor in the developing world work in the informal sector, that is, beyond the regulatory reach of the state. This article examines how informal work impacts the policy and electoral preferences of the poor. We emphasize the importance of the risks inherent in informal employment in shaping the responsiveness of citizens to clientelism and their policy and voting preferences. Since most informal workers are not covered by state-provided social insurance, they seek material goods and candidates that produce targeted, clientelistic benefits rather than programmatically delivered insurance that is unlikely to reach them.
A fast-growing body of empirical work builds on a conceptualization of clientelistic relationships as long-standing relations between local voters and well-connected local leaders qua vote brokers, rather than one-off, vote-buying exchanges (for example, Auerbach Reference Auerbach2019; Nichter Reference Nichter2018; Stokes et al. Reference Stokes2013). These relationships with brokers serve as an insurance mechanism for voters exposed to substantial work-based risk because they provide access to material transfers, financial networks, health (and other social) services, and employment. Where informal workers are embedded in clientelistic networks, their relationships with brokers can serve as an imperfect substitute to public policies that might otherwise be provided via programmatic policies and the state. Given that social insurance and many redistributive policies in the developing world are targeted at formal workers, the implication is that informal workers are more likely to engage in clientelistic exchanges and are less likely to support programmatically delivered social supports and programmatically oriented candidates than their incomes (and standard models) suggest. In developing the argument, we draw on theoretical work on both clientelism and social insurance, two areas that have often been treated separately.
Empirical work on the informal sector is difficult because standard employment surveys fail to distinguish between contingent, unregulated work and formal sector work (Henley, Arabsheibani, and Carneiro Reference Henley, Arabsheibani and Carneiro2009). Likewise, public opinion surveys typically fail to distinguish formal and informal employment, and tend to undersample informal workers, who often have incentives to avoid detection and/or live in “slums,”Footnote 1 neighborhoods that are difficult to find and poorly registered by most city and national governments in the developing world. To overcome these difficulties and test the argument, we rely on original surveys of approximately 9,400 individuals in more than 220 slums in three Indian cities. The surveys provide a means of providing important descriptive data on work-based risk and political attitudes for citizens employed across a wide range of work that varies in its level of informality. We also report results on three original survey experiments—two list experiments and a conjoint experiment—bearing on preferred forms of insurance, the incidence of clientelism, and voting across occupations that range in their level of informality. Our setting represents a hard test of our argument because nearly all of the respondents in our sample are poor; to the extent standard findings link poverty to clientelistic incidence, all workers in our sample are likely to be targets of clientelism.
Our analysis shows that employment in more informal occupations—that is, those that involve higher risk—is associated with a greater likelihood of engaging in some forms of clientelism, a greater preference for policy tools that can be politically targeted over programmatically delivered transfers to alleviate inequality, and greater support for politicians who promise targeted benefits. The article provides several contributions. First, despite a long-standing interest in the role of labor and firm informality on development (La Porta and Shleifer Reference La Porta and Shleifer2014), there is still relatively little research on the political implications of informal employment. Moreover, when labor informality is measured at all, it is often done dichotomously, based on whether or not a job provides access to particular social insurance benefits. However, there is enormous variation in the degree of risks, or informality, across jobs (Breman Reference Breman2013; Chen Reference Chen2007). In this article, we examine how informality affects political behaviors, providing evidence on a large number of informal workers across a wide range of livelihoods with varying degrees of risk and informality. In doing so, this research contributes to a clearer picture of how workplace attributes and politics shape each other for the urban poor.
Secondly, the article pushes research on clientelism beyond income and integrates the nature of work and work-based risk in providing incentives for clientelism. The argument and corresponding evidence contribute to work linking vulnerability and the iterated, networked nature of most clientelistic relationships (Calvo and Murillo Reference Calvo and Murillo2013; Cruz Reference Cruz2019; Nichter Reference Nichter2018; Schaffer and Baker Reference Schaffer and Baker2015). Thirdly, the argument extends the now-large body of work on risk and social insurance (mostly on Organization for Economic Cooperation and Development [OECD] countries) to accommodate workers in settings with less robust welfare states. Extant work provides both formal theoretic and extensive evidence that employment risk increases support for social insurance. By focusing on the huge number of informal workers in the developing world, our argument shows that workplace risk can weaken support for state-led social programmatic policies that are unlikely to reach them relative to support for nonstate, clientelistic politicians and policy tools. More broadly, the differences between the strategies that the urban poor draw on to insure against varying degrees of risk likely represent an important constraint on building broad, pro-poor political coalitions.
The article proceeds in eight sections. In the second section, we draw on existing literature on clientelism, social insurance, and informality to develop our main argument—that informal workers insure against risk through politically mediated rather than programmatically delivered policy tools, which has implications for how labor formality shapes preferences for: (1) how social policies are delivered; (2) the nature of political exchange; and (3) candidate preferences. The third section describes the empirical setting and data, presents the measures of labor formality, and describes the analyses that we conduct to test the hypotheses presented in the preceding section. Thereafter, we present our results: the fourth section provides basic descriptive information on the survey respondents' labor characteristics, while the fifth through seventh sections test each of the three hypotheses. The eighth section concludes.
Informal Work, Clientelism, and Political Preferences
Informal employment is work that takes place outside of the legal system of taxing, spending, and regulating. Working outside of state regulation, informal firms have weak legal means of protecting their property, and workers do not benefit from laws bearing on workplace safety, minimum wages, and the like. Such work includes everything from construction, to domestic help, to machine working, to market stalls. While a wide range of work can be considered informal, in general:
ample empirical research has shown that workers in the informal economy face a higher risk of poverty than those in the formal economy, while informal economic units face lower productivity and income. Indeed, most people enter the informal economy not by choice but as a consequence of a lack of opportunities in the formal economy and in the absence of any other means of earning a living. (ILO 2018, 1)
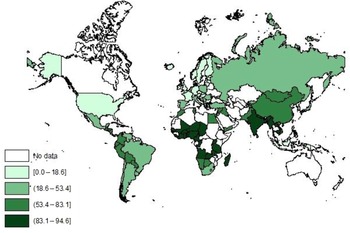
Across much of the developing world, the informal sector is large, comprising upwards of 80 per cent of the workforce, and growing. In India, the most recent government survey puts it at 92 per cent of the workforce (ILO 2020). Figure 1 shows that informal workers represent a very large share of most labor markets in the developing world. A huge body of work in economics has emerged in response to the size and growth of the informal sector (for example, Centeno and Portes Reference Centeno, Portes, Fernández-Kelly and Shefner2006; de Soto Reference De Soto1989; Maloney Reference Maloney1999; Turnham, Salomé, and Schwartz Reference Turnham, Salomé and Schwartz1990). Indeed, the birth of development economics in the 1950s was coterminous with an attempt to explain why many developing countries had “dual” economies and labor markets: one industrial, formal, and productive; the other “traditional,” informal, and unproductive (Nurkse Reference Nurkse1953; Rosenstein-Rodan Reference Rosenstein-Rodan1943).
The size of the informal sector around the world, 2018: informal employment as percentage of total employment.
Source: ILO (2018).

Alas, our standard visions of democracy do not account for the billions of citizens who have no formal position in the labor market. Since time immemorial, sociologists and political scientists have argued that political preferences derive from economic interests (Lipset and Rokkan Reference Lipset and Rokkan1967). In these accounts, the traditional left–right/redistributive dimension of political conflict is rooted in conflicts inherent to formalized, industrial economies. The cleavage between unionized factory workers and their employers provides the fundamental ingredients of political conflict and thereby for party competition. Parties rely on this conflict as a means to structure politics because constituency interests are defined by their occupation (Bartolini and Mair Reference Bartolini and Mair1984). These basic ingredients of democratic electoral competition are reflected in foundational formal models of redistribution, where preferences are defined by a voter's position in the income distribution (Meltzer and Richard Reference Meltzer and Richard1978). As decades of work on economic sociology makes clear, one's position in the income distribution is largely defined by one's work, and there is a consistent finding across a great many voting studies across many societies that citizen income is correlated with their preferences on a left–right dimension of political conflict.
However, the inverse relationship between income and left–right preferences is far from perfect, and a small cottage industry explores when, where, and why the relationship breaks down and even inverts in some cases (Beramendi and Rehm Reference Beramendi and Rehm2016; Blofield and Luna Reference Blofield, Luna and Blofield2011; Dimick, Rueda, and Stegmueller Reference Dimick, Rueda and Stegmueller2017; Holland Reference Holland2016). The prevalence of informal work in some countries almost certainly accounts for some of this. As informal employment occurs outside the purview of the state, it is not formally taxed. In many countries, public sector benefits are tied to employment, and the failure to pay workplace-based taxes implies that such workers do not have access to the largest welfare benefits, including social security, unemployment insurance, and health insurance. Nearly all of the work in the huge literature on such preferences assumes that low income and high risks translate into stronger preferences for welfare benefits, but if citizens have no prospects of receiving policy benefits as a result of working in the informal sector, then they will seek welfare benefits through alternate channels. As a result, formal and informal sector workers of the same income should have quite different preferences over labor market regulations and other features of social insurance (Altamirano Reference Altamirano2015).
There is no doubt that informal work is risky. That risk typically reflects a combination of low incomes, uncertain spells of work and unemployment, and contingent pay schedules. As discussed later, all of these characteristics are prevalent among our respondents; they have lower pay, work fewer days, are paid on short-term provision agreements, are more worried about finding sufficient work, and have fewer assets to financially leverage in the event of a crisis.
Standard social insurance models provide important insights into how these risks should translate into demand for insurance (Iversen and Soskice Reference Iversen and Soskice2001; Moene and Wallerstein Reference Moene and Wallerstein2001). At their foundation, they posit that above and beyond the purely redistributive concerns that motivate Meltzer–Richard and related models, voters/citizens seek insurance against job (and other forms of) loss. All else equal, as the exposure to economic risks grows, preferred social insurance spending increases. Although initially aimed at explaining why (mostly rich) countries vary in the level and mix of both redistribution and insurance policies they deploy, there is now considerable microlevel evidence supporting the notion that economic risks play an important role in social policy preferences (Rehm Reference Rehm2016).
These models are constructed with specific reference to state-provided insurance, meaning that they work through individual preferences over taxes and corresponding social transfers. But if those formal tools of social insurance are not available to workers in the informal sector, how do they insure against the risks inherent in noncontract, contingent work? We argue that in the absence of access to formal insurance, the primary means of insuring against risk is to rely on local social networks and clientelistic brokers.
A growing body of work on the micropolitics of clientelism suggests that these networks have important political characteristics. Much work on clientelism emphasizes the direct exchange of material benefits for political support between voters and politicians (see, among many others, Auyero Reference Auyero1999; Brusco, Nazareno, and Stokes Reference Brusco, Nazareno and Stokes2004; Calvo and Murillo Reference Calvo and Murillo2004; Chandra Reference Chandra, Kitschelt and Wilkinson2007; Kitschelt and Wilkinson Reference Kitschelt and Wilkinson2007; Krishna Reference Kitschelt and Wilkinson2007; Nichter Reference Nichter2018; Remmer Reference Remmer2007; Stokes Reference Stokes2005), models clientelistic exchange as a single-shot exchange on a spot market, and underscores the exploitative aspect of the asymmetric relationship between voters and politicians. However, a recent body of work emphasizes the relational, iterated, and networked nature of clientelism. In doing so, it returns to earlier work that highlighted the prominent role of iterated relationships, interlocking obligations, and insurance considerations in governing economic exchange (Bardhan Reference Bardhan1980), and that iterative patron–client exchanges provide a form of social insurance to vulnerable voters (see, for example, Schmidt et al. Reference Schmidt1977; Scott Reference Scott1972). Auyero (Reference Auyero1999) again drew attention to the potentially mutually beneficial side of clientelistic networks, and much recent work has modeled clientelism as a repeated game in which voters provide political support and participation in rallies in exchange for handouts, access to subsidies, welfare programs, health assistance, employment, and so on. In this account, clientelistic relations are ongoing, durable, and “relational” (Nichter Reference Nichter2018), and the linkages are part of a problem-solving and insurance-providing network, which can be particularly appealing to vulnerable groups (Bardhan Reference Bardhan1980; Bobonis et al. Reference Bobonis2017; Murillo et al. Reference Murillo, Oliveros and Zarazaga2021).
In developing countries like India, where interactions with the state are frequently mediated by local leaders (Auerbach and Kruks-Wisner Reference Auerbach and Kruks-Wisner2020; Jha, Rao, and Woolcock Reference Jha, Rao and Woolcock2007; Krishna Reference Krishna2011), most clientelistic exchanges are mediated by brokers.Footnote 2 These brokers are often unelected community leaders who emphasize their role as problem solvers or “social workers” who help citizens gain access to government schemes that can help address immediate challenges.Footnote 3 In our surveys and interviews, we find a rich array of demands that respondents make of their local leaders. While cash and food—the quintessential private goods envisioned by much work on clientelism—are mentioned by a small minority of respondents, much more common is help getting access to social services (health or education), government programs (pensions, rations), and local infrastructure (electrical connections, water, drains, toilets).Footnote 4 While many of these government schemes are targeted by income, caste, religion, gender, or other categories,Footnote 5 and have formal requirements and cutoffs that echo “programmatic” policies, they are well known for being highly politicized. Local leaders often cite gaining access to schemes as a particularly important aspect of their work. Indeed, even when schemes are not actually politicized, gaining access to benefits often requires intermediation by local leaders, who work with local officials to attain them (Díaz Cayeros, Federico, and Magaloni, Reference Díaz Cayeros, Federico and Magaloni2016; Gupta Reference Gupta2012; Krishna Reference Krishna2011; Mathur Reference Mathur2016).
While programmatic solutions either do not reach informal workers or have not proven credible in the past, broker-acquired schemes and resources help informal workers insure against economic vulnerability in “bad times.”Footnote 6 This leads to our first hypothesis:
Hypothesis 1: As informality increases, the preference for politically mediated policy tools increases.
The local leaders liaise with patrons on behalf of citizens, drawing on social and partisan networks and municipal resources to provide benefits to citizens who provide electoral and mobilization support in exchange. As described by a local leader in Bengaluru: “[W]e are the important people here. [Politicians] get votes because of us. [Citizens] vote for them because they trust us.”Footnote 7 Local brokers provide the means for poor community members both to insure each other and to draw on the resources of formal parties and city governments in times of need.
It goes without saying that many needs are persistent and transcend the times before and after elections, when spot markets for the buying of votes are operational. For these regular, ongoing exchanges between citizens and brokers to be credible, they must be iterated over time—voters learn which local leaders can successfully solve problems (Auerbach and Thachil Reference Auerbach and Thachil2018), while leaders need time to build the networks that can help solve those problems (Auerbach and Thachil Reference Auerbach and Thachil2020). The ongoing nature of the relationship serves to both resolve crucial information problems inherent to clientelistic exchange and address the contingent needs of families subject to the vagaries of informal employment and lacking access to social insurance policies.Footnote 8 As such, most clientelistic exchanges are not one-off, Election-Day vote buying, but instead iterative, reciprocal, long-term, and responsive to the risks that workers in the informal sector constantly face. Citizens facing greater risk in the labor market will draw on these clientelistic exchanges more frequently, as summarized in our next hypothesis:
Hypothesis 2: As labor informality/risk increases, the likelihood of engaging in clientelistic exchanges increases.
Following upon our first two hypotheses, we expect that informal workers will also prefer clientelistic local candidates who promise contingent benefits accessible via these brokers. When given the option, workers in more informal occupations will be more likely to prefer clientelistic local candidates over candidates according to position on a left–right ideological scale that might correlate with programmatic policy responses:
Hypothesis 3: As informality increases, the preference for candidates who promise targeted material goods increases.
The argument also provides an additional avenue through which clientelistic benefits flow. Extant work offers insight into which voters will be targeted by clientelistic machines. Building on Dixit and Londregan (Reference Dixit and Londregan1996), most work posits voters that maximize a joint function of ideological proximity to their preferred party and private, excludable benefits from parties. Due to diminishing returns of consumption, low-income constituencies are expected to be the principal targets of clientelism because they derive higher marginal utility from handouts. There is now a substantial body of evidence supportive of this claim (Brusco, Nazareno, and Stokes Reference Brusco, Nazareno and Stokes2004; Calvo and Murillo Reference Calvo and Murillo2004; Keefer Reference Keefer2007; Remmer Reference Remmer2007). Income aside, there are important theoretical disagreements as to the role of ideology. While Dixit and Londregan (Reference Dixit and Londregan1996) and Stokes (Reference Stokes2005) suggest that ideologically indifferent voters represent the best investments in private benefits, Cox and McCubbins (Reference Cox and McCubbins1986) suggest that core supporters should receive the most benefits, and Nichter (Reference Nichter2008) echoes that argument with the suggestion that election campaigns are primarily aimed at motivating turnout among the like-minded rather than convincing the swing voter. Despite some evidence to the contrary (Dixit and Londregan Reference Dixit and Londregan1996; Lindbeck and Weibull Reference Lindbeck and Weibull1987; Stokes Reference Stokes2005), the weight of evidence is generally supportive of the core voter hypothesis, even if much of that evidence has very weak claims to having identified a causal effect (Bickers and Stein Reference Bickers and Stein2000; Calvo and Murillo Reference Calvo and Murillo2004; Hsieh et al. Reference Hsieh2011). However, if, as we argue, a key function of clientelistic relations is to manage economic risks, then those risks should also have an impact on both the demand for and the supply of clientelism. On the demand side, citizen reliance on clientelistic networks should be increasing with the degree of risk they face in the labor market, that is, the degree of informality. On the supply side, brokers should prioritize helping those employed in the most precarious occupations (Auerbach and Thachil Reference Auerbach and Thachil2020). (For an argument on why parties also have incentives to target clientelistic efforts at informal workers, see Altamirano [Reference Altamirano2015]Footnote 9).
The next section describes the setting and data that we draw on to test our hypotheses. We then empirically assess the implications of our argument for three features of political life: (1) preferences for how social policies are delivered; (2) the nature of political exchange; and (3) candidate preferences.
Empirical Setting and Data
Testing these hypotheses is difficult because doing empirical work on the informal sector is notoriously difficult. Standard employment surveys tend to ignore or undersample informal firms and the self-employed, and public opinion polls rarely include questions about the nature of labor contracts, benefits, or taxes that would allow researchers to distinguish formal and informal sector workers at all. Not surprisingly, there is considerable debate about the best way to measure labor status, and estimates of the size of the informal sector vary hugely. In India, for instance, estimates range from 50 per cent of nonfarm labor (Sanyal and Bhattacharyya Reference Sanyal and Bhattacharyya2009) to over 90 per cent of the workforce (ILO 2018).
In order to find a substantial number of informal sector workers engaged in a variety of occupations who are likely to be exposed to clientelism, we conducted more than 9,000 household surveys in 223 slums in Bengaluru, Jaipur, and Patna, India. Slums in these cities are populated by relatively poor voters, that is, those that extant models suggest are most likely to be targeted by clientelistic appeals, and most Indian slum residents are engaged in informal work (Auerbach Reference Auerbach2019). The three cities vary in population, economic dynamism, connectedness to the global economy, urban management, electoral competitiveness, and alignment with the national governing party. Despite important differences, all three cities are state capitals and regional economic hubs that draw immigrants from surrounding rural areas. In all three cases, the prospect of jobs has resulted in considerable rural-to-urban migration and an explosion in the number and size of slum settlements over the past several decades.
Slums vary substantially in age, physical characteristics, and legal standing. Despite this variation, living conditions across slums are highly precarious. Slum residents are particularly susceptible to health shocks as a result of institutional disconnections and hazardous environmental conditions (Ezeh et al. Reference Ezeh2017; Marx, Stoker, and Suri Reference Marx, Stoker and Suri2013; Seeliger and Turok Reference Seeliger and Turok2014). Adverse shocks that result in a household income earner being unable to work or result in expensive treatment or funerary costs can be financially devastating, especially when households are uncovered and unprotected (Krishna Reference Krishna2010). The combination of highly uncertain living conditions with low and fluctuating wages makes it difficult to amass savings, reducing the capacity to weather shocks or make investments in human capital (Harriss-White et al. Reference Harriss-White2013). Upward financial gains remain precarious in light of high levels of risk that leave residents vulnerable to downward mobility (Rains and Krishna Reference Rains and Krishna2020). Given their high levels of vulnerability, slum residents are likely to be targeted with clientelistic appeals (see, for example, Auerbach Reference Auerbach2016; Murillo, Oliveros, and Zarazaga Reference Krishna2021). Thus, while our respondents provide a rich range of occupational risk profiles for analyzing how they affect preferences, this empirical setting presents a hard test of our argument since it is a population broadly predisposed to clientelism independent of work status.
Given the dynamic nature of urban development, government information about slums is typically outdated, incomplete, or inaccurate, and locating slums can be a challenge. Under a fairly vague set of conditions that vary by city and state, slums might be legally recognized or not by the government; alternatively, they might be rehabilitated or relocated. Across all three cities, municipal records suffer from two major shortcomings: first, they are of little help in locating the many settlements that have not been legally recognized; and, secondly, there is no means of delisting slums that experience development, and thus the lists include settlements that might have been slums decades ago but are now multistory, concrete, middle-class (or better) housing. In short, finding slums is surprisingly difficult.
Since municipal records are of little help, we began building on an innovative approach that other scholars have recently begun to implement: analyzing satellite images to detect these settlements (for a review, see Kuffer, Pfeffer, and Sliuzas Reference Kuffer, Pfeffer and Sliuzas2016). We looked at satellite images available on Google Earth, iterating between satellite analysis and ground verifications to inductively develop an initial shortlist of criteria to identify slums from satellite images. After several iterations between satellite-image identification and detailed verification on the ground, we shortlisted a list of criteria for potential slum settlements. We initially identified 279 polygons in Bengaluru based on the following identification criteria:
• lack of space between housing units;
• what appeared to be low-quality roofs based on blue, brown, or weathered gray coloring;
• a haphazard arrangement of housing units;
• lack of proper roads; and
• lack of shadows adjoining the shelter units, signifying that they are low to the ground.
Example Google Earth images of slum boundaries are provided in the Online Supplementary Materials.
On-the-ground verifications of a total of 193 low-income settlements helped us identify a range of settlements, from notified slums on declared government land, all the way down to “blue-polygon” tent settlements that are neither officially listed nor recognized. Blue polygons are the poorest settlements, and most of them are completely lacking in even the most basic services. Homes in these newer settlements are generally covered by blue plastic sheets (referred to as “tarpaulins” but made of plastic-based material). After an initial survey of 631 residents in 18 blue-polygon settlements in 2012, we began in 2015 to look at the intermediate slums—those between the highest (notified or declared) and lowest (blue-polygon) slums. Homes in these slums are constructed from materials ranging from wood to concrete. Roofs range from plastic, to mold sheeting (akin to thin metal roofs), to concrete. All told, these households cover the full continuum between the two end points of slum settlements—from the very poorest residents who live in blue-polygon slums to the lower middle class who occupy long-recognized “slums” (Rains, Krishna, and Wibbels Reference Rains, Krishna and Wibbels2019).
We selected 40 neighborhoods in 2015, 45 in 2016, and 50 in 2017 to conduct surveys in. These neighborhoods were selected to preserve the distribution of physical characteristics visible from satellite images and the spatial distribution of slums from the full sample frame we constructed.
To the work in Bengaluru, we add data from 4,319 households from 45 settlements in Jaipur and 43 in Patna. In both cities, we followed a similar sampling strategy as in Bengaluru, that is, building initially off government or other data, analyzing Google Earth, iterating with field teams, and aiming to cover a broad range of physical settlements. In Jaipur, a colleague provided a list of 273 slums in the city.Footnote 10 As in Bengaluru, these slums were classified into types based on apparent dwelling quality from satellite images, and 40 slums were then randomly selected to preserve the distribution across slum types and spatial location. We pursued the same process in Patna, except that the slum classification and stratification were carried out according to the availability of local services (due to the availability of data on services provided by a local organizationFootnote 11 and the indistinct appearance of different slums from satellite images).
Across the three cities, the sampled neighborhoods span a wide-ranging continuum of incrementally improving physical and legal conditions. The most vulnerable neighborhoods (the blue polygons) are present in all three cities, but the distribution of slum conditions varies across the cities.
For each neighborhood, we developed a sampling interval based on the settlement size (that is, every third, fourth, or fifth home), randomly selected a starting point, and then followed a right-hand rule to sample between 30 and 60 households, depending on the survey wave. We alternated between surveying men and women in order to ensure at least 40 per cent of our sample were male.Footnote 12 Our household surveys spanned topics including demographics, migration histories, livelihoods, tenure and work insecurity, monthly expenditures, policy priorities, political preferences, and participation in neighborhood activities. We also collected full network census data from a subset of eight slums in Jaipur and Patna, enumerating every household in the neighborhood and asking a set of questions about social, political, and economic ties.
Measuring Informality
Informal work is often conceptualized, and usually measured, as a dichotomy—work is either taxed and thereby provides access to social insurance benefits, or it does not. However, there are a range of risks associated with different kinds of work, such that employment characteristics “tend to fall at some point on a continuum between pure ‘formal’ relations (that is, regulated and protected) at one pole and pure ‘informal’ relations (that is, unregulated and unprotected) at the other, with many categories in between” (Chen Reference Chen2007, 2). An employment arrangement could take many different forms that provide varying degrees of protection to the employee. A daily wage laborer who seeks employment based on an oral agreement each morning experiences greater risks and fewer protections than a domestic worker paid monthly who has a written, though not legally registered, agreement with her employer—even if both are unable to access social insurance linked to income taxes. Indeed, informal work varies along a number of crucial dimensions: the extent to which work is documented; the length of time (daily, weekly, monthly, and so on) over which work takes place; the variability of the pay over the term of work; and the frequency and regularity of pay. This suggests that above and beyond the distinction between “formal” and “informal” work, the range of risks associated with informality should inform citizens' coping strategies, including those bearing on political preferences and relations with political brokers.
As a result, we construct two measures of labor formality: a binary variable as well as a categorical variable. Consistent with existing binary classifications of labor status, we code a job as formal if it provides benefits that are legally required for all formally employed workers. The relevant survey question is: “Does your job provide ESI [Employee State Insurance], PF [Provident Fund], or gratuity benefits?” ESI refers to a social security and health insurance program; PF refers to a social insurance program for salaried workers; and gratuity refers to a retirement benefit that ostensibly applies to all employees with more than five years' service in a firm with ten or more employees.
To proxy for the degree of formality, we apply an occupational classification scheme developed to assess intergenerational occupational mobility in the Global South (Iversen, Krishna, and Sen Reference Iversen, Krishna and Sen2016). This categorization builds on the International Labour Organization classifications of occupational rank that are based on occupation skill requirements. Their categories range from 1 to 6, with higher values associated with “higher standing on the social status and plausibly on the earnings ladder” (Iversen, Krishna, and Sen Reference Iversen, Krishna and Sen2016, 8). We drop “farmers” for the urban context, resulting in categories that range from 1 to 5, with 5 corresponding to higher-prestige jobs. While prestige is a rough proxy for formality, we find that in our empirical setting, higher-status jobs are associated with less risk. Higher values on this occupational index are significantly associated with working more days per month, receiving a regular monthly salary, and being less worried about finding sufficient work in the near future.Footnote 13 In in-depth interviews as well, residents describe barriers to accessing lower-risk jobs and describe taking employment where they can find it.Footnote 14
Analyses
For each hypothesis, we test both the relationship between the outcome of interest and our binary measure of formality, and the relationship between the outcome of interest and our proxy for the degree of formality. In each model, we include a set of covariates to account for individual, neighborhood, and city characteristics. Existing theory suggests poverty is an important predictor of clientelistic exchanges. To control for poverty levels, we include an asset score. The asset score is the first component score from a principal component analysis of 15 binary variables indicating whether or not the respondent's household owns that common asset. We use assets rather than income because income data in developing countries can be particularly unreliable (Huber and Suryanarayan Reference Huber and Suryanarayan2016). We also control for education level, which has consistently been shown to influence political behavior (see, for example, Verba, Schlozman, and Brady Reference Verba, Schlozman and Brady1995), by including an indicator variable for whether respondents completed primary school or not. We include an indicator variable for whether the respondent migrated to their city of residence from elsewhere given migrants may have different priorities and face different political challenges than nonmigrants (Gaikwad and Nellis Reference Gaikwad and Nellis2021; Thachil Reference Thachil2017, Thachil Reference Thachil2020). We also include a standard set of demographic variables (age, gender, and ethnicity—in this context, we include a control variable indicating whether the respondent is Muslim or not, as well as an indicator for the respondent's caste).
The high levels of risk present in slums, including from environmental hazards and insecure tenure, make slum residents likely targets of clientelism (Murillo, Oliveros, and Zarazaga Reference Krishna2021). Therefore, we also include several neighborhood-level covariates. First, we control for the type of land the settlement is located on. Some land types are more likely to be hazardous and are less likely to result in residents successfully procuring property rights than others (Auerbach Reference Auerbach2016). We classify the self-reported land type as private land, municipal or state government land, national land, or formerly rural land. We also control for the age and size of the settlement, which may affect how many brokers are active in the neighborhood, and can also affect tenure security (Auerbach Reference Auerbach2019).
Finally, we add indicator variables to control for differences across cities. The three cities included in this study vary substantially along cultural, geographic, economic, and political dimensions. However, we cluster standard errors at the neighborhood level because existing research finds living conditions vary more across slums than across individuals or cities (Rains, Krishna, and Wibbels Reference Rains, Krishna and Wibbels2019).
Empirics I: Informal Work and Risk
Before testing our hypotheses, we first provide evidence that informal work is indeed more risky than formal sector work and that the degree of risk varies across informal jobs. Figure 2 provides descriptive data on the categories of jobs held by Indian slum residents. A large number of respondents are engaged in construction and contract “labor,” though people are employed in a broad range of work. Examples of the first category, “manual labor,” include daily wage labor, construction work, and garbage collection. “Lower-status vocational occupations” include working as a butcher, carpenter, factory worker, maid, or driver. Examples of “higher-status vocational occupations” are cooks, electrical workers, grocers, and security guards. Working as a salesperson, receptionist, or call center employee is coded as “clerical.” Category 5, “professional” occupations include teachers, engineers, doctors, and so on.
The distribution of employment in Indian slums.

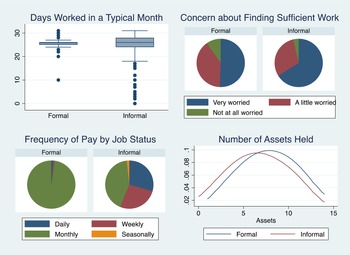
Across the three cities, about 9 per cent of respondents are formally employed (with access to state-provided insurance); the most common formal positions include work with the city government and in professional services (that is, call center, receptionist, sales, and so on). Figure 3 shows density plots for the frequency of work (that is, number of days per month), concern about ability to find sufficient work, frequency of pay, and wealth levels. The top-left panel of the figure is consistent with the notion that one of the defining features of informal work is that its source and length changes often. While most formal sector workers have a standard work week that results in twenty-two to twenty-eight days of work a month, the informal sector has a broader range and a left skew. On average, formal employees only work two extra days per month; however, the standard deviation is twice as large for informal workers. As such, informal sector workers are much more worried about whether they will be able to find sufficient work in the near future (top-right panel)—a sentiment frequently repeated in in-depth interviews.Footnote 15 Informal work is also defined by the contingency of the wage contract, and that is reflected in the fact that informal workers are much more likely to be paid on a daily or weekly basis than their formal counterparts (bottom-left panel). Formal workers are overwhelmingly paid on a monthly basis. Finally, informal work is also, on average, lower paying. As the bottom-right panel of Figure 3 shows, the asset holdings for the two groups have similar shapes, but the formal sector distribution is shifted to the right. Formal employees own eight (out of fifteen) assets on average, compared with six for informal workers, but the standard deviation is larger for informal workers. While 20 per cent of informal workers own three or fewer assets, the comparable figure for formal workers is only 4 per cent. The combination of less frequent and predictable work, contingent pay, and lower incomes is consistent with the notion that life in the informal sector is riskier than in the formal one.
Frequency and predictability of work, frequency of pay, and asset holdings in the formal and informal sectors.
Notes: Due to variation in the implementation of the surveys, the data for Figure 3 are drawn only from Bengaluru based on the responses of 3,321 residents who were employed at the time of the survey (88 per cent were employed in the formal sector and 12 per cent in the informal sector).

Informal work can vary substantially in degree and, thus, risk. To provide evidence on this spectrum, we also examine a nonbinary proxy for formality. The degree of formality increases with the occupational classification presented in Figure 2. The percentage of workers with the benefits legally required for all formally employed workers increases from 1 per cent for those in Category 1 occupations to 77 per cent for those in Category 5 occupations. The risk factors discussed earlier are roughly decreasing with the occupational classification. Figures 4 and 5 illustrate how contingency and predictability of work vary across the occupational categories.
Employment contingency by occupational category.

Employment predictability by occupational category.

Empirics II: Preferred Policy Tools
We next turn to a test of our first hypothesis. We argue that in the absence of access to formally provided social insurance, informal sector workers will seek politically mediated resources to insure against economic risks. Thus, we expect that more informal workers will be more likely to prefer contingent, politically mediated policy tools, while more formal workers will prefer more programmatic solutions. Our findings support these expectations.
To test our hypothesis, we draw on responses to the following question: “What do you think is the most effective government policy for reducing the gap between those at the bottom and top of the economic ladder?” The responses included government schemes that are well known to be mediated by political officials (that is, targeted cooking gas, student lunches, or food subsidies) and government actions that are less mediated (that is, more spending on education). We conduct two logistic regressions estimating the probability that respondents prefer mediated schemes and the probability that respondents prefer investment in education by labor status. For both models, the dependent variable equals 1 if the respondent prefers that policy and 0 otherwise; standard errors are clustered by neighborhood.
Figure 6 shows that when holding all covariates at their mean values, formal workers are about 4 percentage points more likely to prefer investments in education. The model output (provided in the Online Supplementary Materials) suggests preferences are significantly different overall, though the figure indicates that when holding other covariates at their mean values, the difference is not significant. In contrast, formal workers are about 14 percentage points less likely to prefer clientelistically delivered schemes than informal workers. Consistent with our expectations, we find some evidence that the preference for mediated schemes decreases with the occupation's degree of formality and that the preference for investments in education increases with degree of formality. However, we do not find significant evidence that these preferences vary monotonically with occupational classification. Curiously, while we find significant differences between Category 1 and Category 2, as well as between Category 2 and Category 5, employees, we do not find significant differences between Category 2 and 5 employees. However, we do find clear, significant, and substantive differences between the extremes (Category 5 and Category 1 employees). For example, the predicted probability that an employee in the riskiest position (Category 1) prefers mediated schemes to address inequality is 0.45 (±0.03); this figure drops to 0.30 (±0.06) for those in the most formal occupations (Category 5).
Inequality-reducing policy preferences by labor status.
Notes: We estimate the likelihood that the respondent's preferred policy to reduce economic inequality is via mediated schemes (left) and education (right). The models include covariates, and standard errors are clustered by neighborhood. The figure shows the difference in the predicted probability (with all covariates held at their mean values) that a formally employed respondent prefers that policy and the predicted probability that an informally employed respondent prefers that policy.

We argue that these findings provide support for our claim that informal workers are more likely to prefer clientelistically delivered schemes to programmatically delivered policies. However, one potential concern with this conclusion is that we may be capturing preferences for different types of goods rather than for different modes of exchange. It could be that more informal workers prefer material goods because they experience higher levels of poverty; furthermore, more formal workers may place a greater value on education because they know higher education levels are necessary to access more formal employment.Footnote 16 We do not ask about preferences for the same type of good delivered in different ways and cannot test this explicitly in this article. However, we do not think the results are driven by preferences for different types of goods rather than different modes of exchange for two reasons. First, we find significant differences by labor status, even after controlling for poverty levels (as proxied by asset holdings) and education levels. Secondly, we conduct two follow-up analyses that provide additional support for our takeaways. Specifically, we ask respondents what the most important public service need is in their settlement and how satisfied they are with several local public goods (primary school, electricity, and policing). We do not find a difference in reported public need in the settlement by labor status.Footnote 17 Nor do we find a difference in satisfaction with local services (including education, policing, and electricity) by labor status.Footnote 18 These findings suggest that other preferences for various types of goods do not vary meaningfully by labor status, bolstering support for our conclusion that labor status conditions preferences for different modes of exchange. Testing this claim more explicitly is an important area for future research.
Empirics III: Incidence of Clientelistic Exchanges
Our second hypothesis is that the risk factors associated with informal work translate into a greater likelihood of drawing on these clientelistic networks. Basic descriptive data suggest informal workers do engage in broker-mediated clientelism. A total of 72 per cent of respondents know a local leader/broker. Approximately one-third of the respondents received help from this leader in the past year, most commonly, with getting access to personal documents and helping resolve conflicts among neighbors. A similar percentage (29 per cent) report that this leader advises them on who to vote for.
To test whether informal sector workers are more likely to report approaching these brokers to help solve a variety of household and neighborhood-level problems than other workers, we draw on both observational and experimental evidence. First, we analyze responses to the following questions: “In the past year, have you contacted any neighborhood, city, or state officials because of personal or neighborhood problems?” For those who respond “Yes,” we ask who they contacted. We estimate a logistic regression with the dependent variable equaling 1 if the local broker was the primary “official” respondents sought help from in the past year and 0 otherwise. The variables of interest are indicator variables for the occupational categories displayed in Figure 2. We include covariates and cluster standard errors by neighborhood.
We find evidence in support of our expectation that more informal workers are more likely to approach local brokers (the output is provided in the Online Supplementary Materials). The predicted probability that a worker relies on area leaders for help with household and neighborhood problems increases with the degree of informality (see Figure 7). The probability that a worker in the most precarious forms of work (Category 1) primarily approached a broker for help in the past year is 0.05 (±0.01), while the corresponding probability for employees in the most formal occupations in our sample (Category 5) is much lower at 0.02 (±0.02).Footnote 19
Probability of seeking help from broker and knowing local politician by occupation.
Notes: The figure shows the predicted probability of respondents seeking help only from a broker in the past year (left) and having an elected official in their social network (right) by occupational formality. We run logistic regression models, including relevant covariates and clustering errors by neighborhood. The figures show the predicted probabilities for each occupation category, holding all covariates at their mean values.

We also find evidence that more informal workers, who are more likely to seek help primarily from brokers, are less likely to know elected municipal representatives who they can approach directly with problems. Drawing on our social networks data, we run a logistic regression with the dependent variable equaling 1 if the respondent knows a local elected representative (either as an acquaintance, friend, or relative) and 0 otherwise. We again include indicator variables for the occupational categories and a similar set of covariates, and we cluster standard errors by neighborhood.Footnote 20 The data show that more informal workers are less likely to have an elected representative in their social network, providing further evidence that local brokers are particularly important actors in informal clientelistic networks.Footnote 21 The probability that a worker in the most precarious forms of work (Category 1) knows an elected official is 0.59 (±0.09), while the corresponding probability for employees in Category 3 jobs is 0.69 (±0.09). For the most formal occupations in our sample (Category 5), the probability is 0.84 (±0.09).
The actual incidence of clientelistic exchange is difficult to measure since respondents might be unwilling to admit to the quid pro quos that define clientelistic relationships. Consistent with recent work in Nicaragua (Gonzalez-Ocantos et al. Reference Gonzalez-Ocantos2012) and Lebanon (Corstange Reference Corstange2012), we rely on a list experiment. As discussed elsewhere (Glynn Reference Glynn2013), when properly designed, list experiments provide a useful avenue for assessing the incidence of a sensitive behavior because they shield individual respondents by asking them to count the number of behaviors or actions they have taken part in. By randomly assigning lists with and without a sensitive behavior, the researcher is able to compare the mean counts to assess the overall incidence of the behavior of interest. Additional techniques offer further leverage in the use of list-experimental data (Blair, Imai, and Lyall Reference Blair, Imai and Lyall2014; Corstange Reference Corstange2009). In our case, we are interested in the extent to which voters sell their votes for private benefits according to traditional notions of clientelism, as well as the extent to which voters are responsive to efforts by local vote brokers to coordinate voting by slum residents (Auerbach Reference Auerbach2016).
To accomplish this, we ask the control group of citizens the following question: “People decide who to vote for based on many different considerations. I will read to you some of the reasons people have told us. Please tell me how many of these influenced your vote choice. Don't tell me which ones, just tell me how many.” The control group (one-third of the sample) was provided with an innocuous list of three alternatives designed with the threat of top-coding in mind.Footnote 22 One treatment group was assigned the first sensitive item of interest, namely: “One party promising more favors, such as clothes or food, to you or your family.” To test the notion that local vote fixers trade votes for benefits, the other one-third of the sample received a different treatment, namely: “The suggestions of your neighborhood leader because he/she has made arrangements with a political party.” A random number generator provided random assignment of respondents to treatment and control (the surveys were delivered on tablets programmed using Open Data Kit [ODK]).
The unconditioned results of the survey experiment are summarized in Figure 8, which displays the difference in the average number of factors (and corresponding confidence intervals) selected by the respondents across the control and two treatment groups. If promises of private benefits or the organizational efforts of vote brokers did not matter for voter behavior, these latter two groups would have the same mean as the control group. They do not, and the differences in means suggest that 9 per cent of respondents are responsive to promises of private transfers and that 10 per cent of respondents vote because of the partisan arrangements of vote brokers. We expect both effect sizes to be fairly conservative estimates given that the list experiment “relies on voters consciously identifying why they vote the way they do.”Footnote 23
Survey-experimental evidence on the incidence of two forms of clientelism.
Notes: For each treatment arm, we regress the number of factors selected that influence the respondent's vote choice on a binary variable that indicates whether the respondent is in that treatment arm or not (that is, in the control arm). The figure shows the coefficient on the indicator variable (that is, the difference between the number of factors selected that influence vote choice for each treatment arm and the number of factors selected for the control arm). Standard errors are clustered by neighborhood.

The former effect size is consistent with nonexperimental findings elsewhere in India, where Election-Day vote buying has been shown to be low (Chhibber and Verma Reference Chhibber and Verma2018), but smaller than has been reported in Ghana, Nicaragua, and Lebanon. We expect the latter, in particular, to be quite a conservative estimate of voting according to broker suggestions. This is because we measure voting based on whether the neighborhood leader has explicitly made arrangements with a political party, but citizens may also vote per broker recommendations as a result of their ongoing relational exchanges without being aware of “what happens behind the scenes” between brokers and partisan patrons.Footnote 24
We next turn to the findings when we condition the results on labor status (the figure is provided in the Online Supplementary Materials). We find an estimated 10 per cent of informal workers report a willingness to sell their votes for private benefits (p-value = 0.001); 10 per cent also report voting as they do because of arrangements made by a local leader (p-value = 0.001).Footnote 25 We are not, however, able to draw meaningful conclusions about whether these clientelistic behaviors differ with labor formality. Given the small proportion (9 per cent) of formal employees in our sample, we do not have sufficient statistical power to precisely measure behavior among formal sector workers, which would allow us to compare differences by labor status. Nor do we have statistical power to test this relationship by degree of formality, as fewer than one-third of employed respondents from the 2016 survey waves that included the list experiment work in the more formal occupations (Categories 3, 4, or 5).
However, taking our experimental findings of a significant incidence of clientelistic behavior among informal workers together with our nonexperimental findings earlier is suggestive. Not only do informal workers report engaging in mediated clientelistic arrangements, but the incidence of broker-mediated exchanges also may be higher for informal workers than formal workers.
Empirics IV: Preferences in Local Elections
If informal sector workers are more likely to engage with clientelistic local networks and seek clientelistically mediated policy tools, then we expect they will be more likely to vote for candidates who promise clientelistic goods. To test this hypothesis, we conducted a forced-choice conjoint experiment in which we randomized both the individual characteristics of candidates for ward leaderFootnote 26 and their electoral promises. Conjoint experiments are useful for causally estimating the relative value respondents place on various parameters in complex, multidimensional choices. In our experiment, respondents were told to imagine that they were comparing two candidates for ward leader and were asked which one they prefer. The candidate characteristics that we randomized include: member of Congress Party; member of Bharatiya Janata Party (BJP); member of your caste or religion; and “an educated person.” The electoral promises that we randomized include: promises private benefits to your family (like money or food); promises better community services (roads, drinking water, sanitation, street lights, and so on); promises religious or caste benefitsFootnote 27; promises more pro-poor schemesFootnote 28; and has the support of your neighborhood leader. As we randomize these attributes independently, we can calculate the average marginal component effect (the marginal effect of an attribute averaged over the joint distribution of the other attributes) of each trait simultaneously by estimating a linear regression model (Hainmueller, Hopkins, and Yamamoto Reference Hainmueller, Hopkins and Yamamoto2014). In this model, the unit of analysis is a hypothetical candidate. The dependent variable takes a value of 1 if the respondent prefers that hypothetical candidate and 0 if they prefer the other candidate presented to them. The independent variables are indicator variables for each of the randomized traits.Footnote 29 The average marginal component effect tells us how much a given trait affects the probability that a respondent prefers a ward leader with that trait relative to a ward leader with a specified baseline trait.
Figure 9 shows the results from this regression model. The baseline traits are that the candidate is co-ethnic and that they have the support of the area leader (broker). The coefficients for the other attributes tell us how much that attribute affects the probability that a respondent prefers that candidate relative to a candidate with the baseline attribute. For example, the coefficient on “an educated person” (0.02) suggests respondents prefer a highly educated candidate to a co-ethnic candidate by 2 percentage points. The results from the first trait also show that respondents place more weight on candidate ethnicity than partisanship. The coefficients on the second trait provide information on how respondents weight the electoral promises the candidate makes relative to whether the candidate has the support of the local leader. The results show that respondents prefer candidates who explicitly promise individual- or neighborhood-targeted goods relative to those who have broker support but have not explicitly promised these goods.
Survey-experimental evidence on local candidate preferences.
Notes: The figure shows the marginal effect of the attribute on the probability that the respondent prefers that candidate profile. The unit of analysis is a hypothetical candidate. The dependent variable takes a value of 1 if the respondent prefers that hypothetical candidate and 0 if they prefer the other candidate presented to them. The independent variables are indicator variables for each of the randomized traits. Standard errors are clustered by respondent. The coefficients on the indicator variables provide the marginal effect of that variable.

In order to examine how candidate preferences vary with labor formality, we compare the marginal effects by subgroup (Leeper, Hobolt, and Tilley Reference Leeper, Hobolt and Tilley2020). The results (see Figure 10) show that slum residents in both more and less informal positions prefer candidates that explicitly promise to deliver better neighborhood services and pro-poor schemes (both of which we expect to be mediated by the area leader) over those the area leader supports generally. Where we find significant differences by labor formality is in preferences for private handouts. Informal workers not only prefer explicit neighborhood- and pro-poor-mediated offers, but also prefer candidates who promise private gifts. The preference for private handouts is stronger for more informal workers (p-value = 0.013).
Survey-experimental evidence on local candidate preferences by labor status.
Notes: The figure shows the marginal effect of the attribute on the probability that the respondent prefers that candidate profile by labor status. Respondents employed in Category 1 or 2 occupations are coded as “Lower formality,” while respondents employed in Category 3, 4, or 5 occupations are coded as “Higher formality.”

As previously noted, our setting represents a hard test of our argument. First, nearly all of the respondents in our sample are poor, and thus existing theory suggests they may be expected targets of clientelism. Secondly, as slum residents, the respondents also experience multiple vulnerabilities beyond employment that can increase preferences for clientelistic exchanges (Auerbach Reference Auerbach2019; Murillo, Oliveros, and Zarazaga Reference Krishna2020). Thus, that we find anything at all suggests that labor informality is a strong predictor of clientelistic preferences and behaviors.
Conclusion
In her study of scrap trading, Kaveri Gill (Reference Gill2010, xi) writes:
It has been recognized in the dev lit [development literature] for quite some time that without improving the quality of life in the informal sectors of the developing countries, it is not possible to alleviate poverty and bring about real development. But very little work has been done to analyse the problems of the informal sector.
Moreover, while there is a lot of research on informal means of risk sharing among the poor, most of it is in economics and speaks little to the role of politics in mediating risk-sharing networks. We hope to have provided some distinctly political meat to the bones of the informal economy. Our argument that informal workers engage in iterated clientelistic exchanges with local brokers as an informal insurance mechanism helps explain why the behavior of billions of informal workers diverges from that predicted by standard political models. Relying on a huge, multiyear, original data-collection effort across three cities, we have found that informal workers may be more likely to engage in some types of clientelistic exchange and are more likely to prefer politically mediated policy tools than are formal sector workers. Our experimental evidence also suggests these characteristics translate into voting preferences.
There are several implications for future work. Economic risks and clientelistic politics are in many ways shared by respondents who live in the same community. Indeed, we note that the respondents in our sample, as residents of slums—or informal settlements—experience multiple vulnerabilities that likely shape political beliefs and behaviors. We account for the hierarchical nature of our data in our analyses, but future work should more closely examine how these multiple vulnerabilities interact to produce different outcomes, as well as how preferences and behaviors vary across communities. We also note that because our sample is comprised of slum residents who face additional vulnerabilities and who are predominantly employed informally, we present a very strict test of our theoretical expectations. As a result of the small proportion of our sample employed in the formal sector, we do not have sufficient statistical power to meaningfully compare the results of our list experiment by labor status. For this article, we purposely sampled a large number of slum residents that we expected to work informally in order to fill gaps in existing data on informal workers. This article would benefit from a follow-up study that seeks to replicate these experiments in samples that are more evenly split by labor status.
Future work should also examine broker behavior. We argue vulnerable citizens engage in iterated clientelistic exchanges to mitigate risk and will thus be more likely to engage in clientelism than will other citizens. This understanding of clientelism differs from approaches that examine whether core or swing voters are more likely to be targeted with clientelistic offers. While we focus primarily on citizen preferences and behavior, further theory and evidence is needed to elucidate broker incentives under this framework. How do brokers decide who to target? How does this vary with broker characteristics? How does electoral competition alter their targeting decisions? Recent work focuses on some of these questions, but much more research is needed to understand citizen–broker exchanges (Auerbach and Thachil Reference Auerbach and Thachil2020).
Parallel work should also examine the extent to which informal workers engage in unmediated citizen–patron exchanges. Our data show more informal workers are less likely to have elected representatives in their social networks and are more likely to turn primarily to brokers for support. After all, although parties and brokers have incentives to target clientelistic offers to informal sector workers, characteristics of informal sector work can make it difficult for patrons to locate and target informal workers (Prillaman and Phillips Reference Prillaman, Phillips and López-Cariboni2019). Under what circumstances do informal sector workers engage in direct clientelistic exchanges and/or exit clientelistic networks? How does this vary by the type or degree of informal work?
This article makes a start in connecting and advancing the literatures on clientelism and social policy. In doing so, we propose an understanding of clientelism that theoretically accounts for the vast global population employed outside of the formal economy, and we collect original data to fill gaps in empirical evidence on this population. Our survey data, which allows us to conduct a strict test of our theoretical expectations, provide both significant and suggestive evidence that the risks associated with informality have important political effects. Our findings, especially in light of the substantial and growing size of the population employed informally, suggest the politics of informal risk sharing is a fruitful area for further inquiry.
Supplementary Material
Online appendices are available at: https://doi.org/10.1017/S0007123422000011
Data Availability Statement
Replication data for this article can be found at: https://doi.org/10.7910/DVN/ADZECE
Acknowledgments
The authors would like to thank Jessica Gottlieb, Herbert Kitschelt, Elaine Denny, and the other participants of the 2020 Clientelism as Electoral Linkage Mechanism Workshop at Duke University for valuable feedback on earlier drafts of the article. We would also like to thank the editor and three anonymous reviewers, whose comments and suggestions greatly improved the manuscript.
Financial Support
This work was supported by the Omidyar Network, International Growth Centre, and Jana Urban Foundation.
Competing Interests
None.
Ethical Standards
The research was conducted in accordance with the protocols approved by Duke University.