




No CrossRef data available.
MONITORING CONSTANCY OF VARIANCE IN CONDITIONALLY HETEROSKEDASTIC TIME SERIES
Published online by Cambridge University Press: 15 March 2006
Abstract
We propose several methods of on-line detection of a change in unconditional variance in a conditionally heteroskedastic time series. We follow the paradigm of Chu, Stinchcombe, and White (1996, Econometrica 64, 1045–1065) in which the first m observations are assumed to follow a stationary process and the monitoring scheme has asymptotically controlled probability of falsely rejecting the null hypothesis of no change. Our theory is applicable to broad classes of GARCH-type time series and relies on a strong invariance principle that holds for the squares of observations generated by such models. Practical implementation of the procedures, which uses a bandwidth selection procedure of Andrews (1991, Econometrica 59, 817–858), is proposed, and the performance of the methods is investigated by a simulation study.This research was partially supported by NSF grants INT-0223262 and DMS-0413653 and NATO grant PST.EAP.CLG 980599.
Information
- Type
- Research Article
- Information
- Copyright
- © 2006 Cambridge University Press
1. INTRODUCTION
This paper is concerned with on-line detection of a change in unconditional variance in a conditionally heteroskedastic time series. Our sequential testing procedures are similar in spirit to the procedures developed by Chu, Stinchcombe, and White (1996) and Horváth, Hušková, Kokoszka, and Steinebach (2004), who considered monitoring for changes in linear regression models. To explain the idea, suppose rt, t = 1,2,… are returns on a speculative asset. We assume that the first m observations r1,…,rm are a realization of a stationary process and, in particular, the unconditional variance does not change up to time m. We then monitor the observations rm+1,rm+2,… as they arrive, and at each time n > m we have to make a decision whether r1,…,rn are a realization of the same process as r1,…,rm. The detection algorithms are designed in such a way that they will detect changes that lead to a change in the unconditional variance.
The problem of detecting structural changes in conditionally heteroskedastic time series has received increased attention in recent years. Most work has, however, focused on the so-called a posteriori change-point problem in which a historical sample of fixed size is given and a decision has to be made whether one model is suitable for the whole sample. There are many variants of this problem depending on whether one is interested in the constancy of the parameters of a parametric model or merely in the constancy of specified moments. Contributions in this direction have been made by Inclán and Tiao (1994), Chu (1995), Kokoszka and Leipus (1998, 1999, 2000, 2002), Kim, Cho, and Lee (2000), Inoue (2001), Andreou and Ghysels (2002, 2003), and Kulperger and Yu (2005), among others. By contrast, very few contributions have been made to the problem of sequential testing for a structural change in conditionally heteroskedastic time series. Mikosch and Stărică (1999, 2002) suggested a sequential change-point detection method based on the periodogram, whereas Berkes, Gombay, Horváth, and Kokoszka (2004) developed a method based on likelihood scores that applies to the same testing setting as in Chu et al. (1996) but focuses on GARCH(p,q) models rather than linear regression models.
The methods proposed in this paper are essentially nonparametric, even though their specific implementations may require estimating an approximate parametric model for the data. This is because the detectors have a general form

, where

is an estimator of the variance of the sample mean of dependent stationary observations. Whereas the function D(·) is fully specified and depends only on the observations, some estimators

may rely on model assumptions. In our simulation study, we use a kernel estimator and the data-driven bandwidth selection procedure of Andrews (1991) that relies on postulating and estimating an approximate parametric model for the observations.
Theoretical justification for the procedures proposed here applies to broad classes of conditionally heteroskedastic time series. The main assumption is that the squared returns obey a strong invariance principle; see equation (2.4). Such a very general assumption is possible because recent research has established that practically all heteroskedastic models of importance in econometrics obey the strong invariance principle (2.4); see Carasco and Chen (2002) and further references in Section 2. Using a strong approximation leads to straightforward proofs that avoid the often very intricate arguments used in the work of Chu et al. (1996), who based their theory on the weak convergence of measures in the Skorokhod space.
The paper is organized as follows. After formulating the monitoring problem and presenting some further background in Section 2, we describe the detection schemes and establish their asymptotic properties in Section 3. Section 4 describes the variance estimator used in simulations presented in Section 5. Appendixes A and B contain the proofs of theorems stated in Section 3.
2. PROBLEM FORMULATION AND ASSUMPTIONS
Assume that the returns rt have mean zero and denote Xt = rt2, t = 1,2,…, so that ωt = EXt is the variance of the tth return.
We assume that

We wish to test

against

We assume that under H0 the Xi satisfy the following strong invariance principle:

with some 0 < α < ½, where W(·) is a Wiener process.
The following theorem gives sufficient conditions for (2.4) to hold.
THEOREM 2.1. Let {Xk} be a weakly stationary sequence of random variables with mean zero and uniformly bounded (2 + δ)th moments for some 0 < δ ≤ 2. Assume that {Xk} satisfies the strong mixing condition

with γ ≥ 300(1 + 2/δ), where

denotes the σ-field generated by Xk,Xk+1,…,X[ell ]. Then letting Sn = X1 + ··· + Xn, the limit

exists, and if σ > 0, then there exists a Wiener process {W(t),0 ≤ t < ∞} such that

where

.
There are several theorems of this type. Theorem 2.1 is due to Phillip and Stout (1975); see their Theorem 8.1 on p. 96. The constants in the theorem are far from optimal; however, the theorem of Phillip and Stout (1975) covers most applications.
Recently, Carasco and Chen (2002) established easily verifiable sufficient conditions for exponential β-mixing (absolute regularity) and the existence of finite moments in several important models extending the standard GARCH(1,1). Because exponential β-mixing implies exponential strong mixing (see, e.g., Bradley, 1986, eqn. (1.7)), these conditions imply (2.5) whenever Xk = f (rk) and the rk follow one of the GARCH(1,1)-type models considered by Carasco and Chen (2002), f (·) being any measurable function. Necessary and sufficient conditions for the existence of higher order moments in these models were established by He and Teräsvirta (1999). The results of Carasco and Chen (2002) also imply that condition (2.5) holds if Xk = f (rk), the rk follow a GARCH(p,q) process that satisfies [sum ]i αi + [sum ]j βj < 1, and the innovations have a density that is continuous and positive on the whole line; see their Proposition 12.
As a corollary of the preceding discussion, we conclude that the theorems in Section 3 hold, in particular, if Xt = rt2 and the rt follow a strictly stationary process that is strongly mixing with exponential rate and has finite (4 + δ)th moment.
3. DETECTION ALGORITHMS
We now introduce four sequential monitoring methods considered in this paper. These methods are formulated in terms of the observations Xt, which can be interpreted as the squares of mean zero returns. With such an interpretation, the methods are designed to detect a change in unconditional variance of returns. Even though this has been our primary motivation, the proposed algorithms have a much wider applicability. In fact, the Xt can be viewed as a sequence of observations satisfying a week dependence condition (invariance principle (2.4)), and the monitoring is then intended to detect a change in the mean of the Xt.
The monitoring schemes considered in Section 3.1 are motivated by the methods proposed by Chu et al. (1996) in the context of detecting parameter changes in linear regression models. The two methods described in Section 3.2 are based on procedures proposed in Horváth et al. (2004), also in the context of linear regression models.
In the following discussion, we denote by

an estimator of the parameter σ appearing in Theorem 2.1 that is consistent under the null. We use

, i.e., an estimator computed from the noncontaminated initial m observations, or

, i.e., an estimator that is sequentially updated as new observations arrive. Specific estimators and their asymptotic properties are discussed in Section 4. The use of the estimator

is justified asymptotically, but no corresponding theory is yet available for the estimator

, which is however recommended, as it gives much better empirical results; see Section 5.
3.1. CUSUM and Fluctuation Monitoring Schemes
Cumulative sum (CUSUM) monitoring is based on the detector

where

and

(The weights νi are chosen so that Var[Sn] = (n − 1)Var[X1].)
The conditions imposed on the boundary function g(·) appearing in Theorems 3.1 and 3.2, which follow, are collected in the following assumption.
Assumption 3.1. The function g : [1,∞) → R satisfies


and

Sufficient conditions for (3.6) to hold can be obtained from the results formulated in Section 4.1 of Csörgő and Horváth (1993). For convenience, we state them in the following proposition.
PROPOSITION 3.1. Suppose g : [0,∞) → R satisfies the following conditions:


Then

and (3.6) are equivalent.
The assumptions we impose on the function g(·) are different from those used by Chu et al. (1996), who required that g(·) be regular (in the sense defined in Chu et al., 1996, p. 1050), and t−1/2g(t) be eventually nondecreasing. Assumption (3.4) implies regularity whereas, in the class of eventually positive functions, if t−1/2g(t) is eventually nondecreasing, then assumption (3.5) holds. We point out that (3.6) (and hence (3.9)) is equivalent with the existence of sup1≤t<∞|W(t)|/g(t), which appears as the limit in Theorems 3.1 and 3.2. Also, the discussion in Csörgő and Horváth (1993, pp. 190–195) shows that (3.8) is weaker than assuming that t−1/2g(t) is eventually nondecreasing.
Proposition 3.1 is an integral test that provides an analytic expression for functions satisfying (3.6). If a function g(·) satisfies (3.6), it is called an upper class function. For discussion of upper class functions of the Wiener process we refer to Itô and McKean (1965, pp. 33–36) and Csörgő and Horváth (1993).
In the empirical applications, we will work with the function

which meets Assumption 3.1. In (3.10) and throughout the paper, ln denotes the natural logarithm.
Conditions (3.4), (3.5), (3.7), and (3.8) are obviously satisfied by the function ga(t). Because

assumption (3.9) is also met.
It is known that (see Chu et al., 1996, p. 1052)

where Φ and φ are, respectively, the cumulative distribution function (c.d.f.) and probability density function (p.d.f.) of a standard normal random variable. For boundary crossing probabilities (3.11) of 5% and 10%, a2 equals 7.78 and 6.25, respectively.
Theorem 3.1, which is proved in Appendix A, justifies a monitoring scheme based on the detector (3.1).
THEOREM 3.1. Suppose assumption (2.4) holds and the function g(·) satisfies Assumption 3.1. Then, under H0,

Using the function ga(·) in Theorem 3.1, we obtain the following rejection rule: reject H0 if

By (3.12) and (3.11), as m → ∞, the probability of falsely rejecting H0 thus tends to a prescribed significance level α that is controlled by the constant a.
We now turn to the fluctuation detector defined as

with Xn as defined in (3.3).
The following theorem provides a justification for the monitoring scheme based on the fluctuation detector (3.14).
THEOREM 3.2. Suppose assumption (2.4) holds and the function g(·) satisfies Assumption 3.1. Then, under H0,

Theorem 3.2 is proved in Appendix A.
Similarly as in CUSUM monitoring, Theorem 3.2 leads to the following rejection rule: reject H0 if for some n > m

3.2. Monitoring Schemes Based on Partial Sums of Residuals and Recursive Residuals
The following two kinds of residuals are used to construct detectors:

and

First, define the detector

and consider the boundary function

Define the critical value cα(γ) by

The critical values cα(γ) are tabulated in Table 1 of Horváth et al. (2004).
THEOREM 3.3. If (2.4) holds, then under H0

Theorem 3.3, which is proved in Appendix B, leads to the following rejection rule: reject H0 if

or, by letting n = m + k, reject if

Finally, define the detector

We now denote the boundary function by h(t), t ≥ 0, and assume that h(t) = g(t + 1) for a function g(u), u ≥ 1 that satisfies Assumption 3.1. Thus h(·) satisfies the following assumption.
Assumption 3.2. The function h(·) satisfies the following conditions:


and

Similarly to Proposition 3.1, if (3.23) and (3.24) are satisfied, then (3.25) holds if and only if

THEOREM 3.4. Suppose assumption (2.4) holds and the function h(·) satisfies Assumption 3.2. Then, under H0,

Theorem 3.4 is proved in Appendix B.
The discussion in Section 3.1 shows that the boundary function

satisfies Assumption 3.2. It is known that (see Chu et al., 1996, eqn. (8))

For the asymptotic false alarm rate (3.27) of 5% and 10%, a2 equals 6.0 and 4.6, respectively.
Theorem 3.4 and (3.27) lead to the rejection rule: reject H0 if for some k ≥ 1

or, by letting n = m + k, reject if

4. ESTIMATION OF THE ASYMPTOTIC VARIANCE
The on-line change-point detection procedures discussed in this paper rely on the consistent estimation of the asymptotic variance σ2 given by

This estimation problem has been extensively studied; see Bartlett (1950), Grenander and Rosenblatt (1957), Parzen (1957), Anderson (1971), Andrews (1991), Andrews and Monahan (1992), and Haan and Levin (1997).
Because σ2 is the value of the spectral density at 0, we focus on estimators of the form

where k(·) is a real-valued kernel, Wm is the bandwidth parameter, and

is the σth sample autocovariance of {Xt}1n.
We also discuss the results obtained by using the estimator

We emphasize that the optimal bandwidth is obtained using the fixed initial m data points, and so it does not change as we proceed to monitor the data, whereas the sample autocovariance function

is either sequentially updated in

or computed only once in

.
We restrict ourselves to the following two kernel functions:

According to Andrews (1991), the optimal bandwidths Wm* for the two kernels are


where a(i), i = 1 or 2, is a function of the unknown spectral density function f (λ) of the process {Xt}. In the applications and simulations discussed in the following material, we assume that the returns follow a GARCH(1,1) model before a change has occurred. We now explain how the constants a(i) can be found under this assumption.
Assume then that Xt = rt2 and

where {Zt} is an i.i.d. sequence with zero mean and unit variance and ht evolves according to

Following Hamilton (1994, pp. 665–666), we obtain

where νt ≡ Xt2 − ht2 is a white noise, i.e., a second-order stationary sequence of uncorrelated random variables. Expression (4.7) will then be recognized as an ARMA(1,1) process for Xt, in which the autoregressive coefficient is α + β and the moving average coefficient is −β.
For ARMA(1,1) models with autoregressive parameter ρ and moving average parameter ψ, estimates of a(1) and a(2) in (4.3) and (4.4) are given, respectively, in equations (6.6) and (6.5) in Andrews (1991). These equations involve an integer parameter p, which we set equal to 1. We thus obtain

and

where

are appropriate estimates. In this paper, using the m historical observations, we compute the quasi-maximum likelihood estimates (QMLE)

of the GARCH(1,1) model and set

.
We conclude this section by discussing the asymptotic properties of the estimators

introduced previously.
The theory underlying the use of the estimator

is fully developed. Theorem 3.1(i) of Giraitis, Kokoszka, Leipus, and Teyssière (2003) implies that if Wm is a deterministic function such that Wm → ∞ and Wm /m → 0, then

under both the null and the alternative. Relation (4.10) also holds for random bandwidths (4.3) and (4.4); see Theorem 3(a) of Andrews (1991).
The theory underlying the use of the estimator

is not fully developed yet. Berkes, Horváth, Kokoszka, and Shao (2005, 2006) considered the estimator

with a deterministic bandwidth Wn rather than Wm as in (4.1). Under the null hypothesis of no change in the parameters,

, as n → ∞, by Theorem 1.1(i) of Berkes et al. (2005). This almost sure convergence implies that

It can be expected that for deterministic bandwidth Wm relation (4.12) continues to hold with

replaced by

, but this has not been verified yet. A much more difficult problem is to show that

for random Wm as in (4.3) and (4.4).
Relation (4.13) is needed to asymptotically justify the use of the estimator

. However, even though the proof of (4.13) is not available yet, we recommend using

as it gives much better empirical results than

.
5. SIMULATION STUDY
The objective of this section is to compare the finite-sample performance of the four monitoring schemes introduced in Section 3. We highlight only the most important findings; detailed simulation results are presented in Zhang (2005).
For ease of reference, the following table lists the schemes and the abbreviations that will be used in the discussion that follows.

Recall that the boundary function ga(t) = [t(a2 + ln t)]1/2, t ≥ 1 is used for both CS and FL monitoring and, for asymptotic controlled sizes of 5% and 10%, a2 equals 7.78 and 6.25, respectively. The rejection condition for the method PS involves cα(γ); see (3.21). If γ = 0.25, the value used in our simulations, critical value of cα(γ) = 2.386 (2.106) gives 5% (10%) asymptotic false alarm rate. The boundary function is ha(t) = (t + 1)1/2[a2 + ln(t + 1)]1/2 in the RR method, setting a2 equal to 6.0 (4.6) gives α of 5% (10%) asymptotically.
We consider the two kernels, Bartlett and QS, for each of the four schemes. We use autocovariances computed either from all observations available up to the current time n or from the initial m observations. We focus mainly on the former way of computing the autocovariances because it will be seen to give better results.
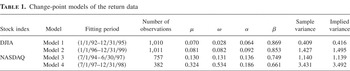
We evaluate the four methods and their several variants on time series of squares of simulated GARCH(1,1) processes with mean zero. In the following discussion, the observations Xt are said to follow Model i, i = 1,2,3,4, if Xt = rt2 and the rt follow (4.5) and (4.6) with standard normal Zt and the parameters displayed in Table 1 (with μ = 0). The pair of Models 1 and 2 reflects a possible change point in the Dow Jones index, and the pair of Models 3 and 4 reflects a possible change point in the NASDAQ index. A detailed justification for the choice of these change-point models is presented in Zhang (2005). Here we simply view them as examples of potential typical change points that can be encountered in econometric practice.
Change-point models of the return data

The primary concern regarding the performance of the four sequential monitoring procedures is the false alarm rate α, namely, the probability of falsely rejecting a true null hypothesis of no change in variance. To evaluate this probability, we generate GARCH(1,1) time series according to Models 1 and 3, the two typical prechange specifications in Table 1. With historical sample sizes m = 100,200,300,400,500, we begin to monitor the squared process from the (m + 1)th observation. The monitoring horizon q is set to be one, two, and three times m. We replicate the monitoring procedures on a given series of length (q + 1)m for a large number of times, R = 1,000 in our simulations. The empirical sizes can then be computed by dividing by R the number of times a boundary is crossed. Theoretically, they should become close to the asymptotic size when m and q approach infinity.
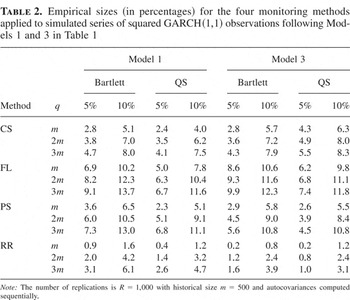
Table 2 presents the empirical sizes for the four algorithms when m = 500, with autocovariances sequentially computed. We first notice that the sizes produced by methods CS and RR are below the target levels. Almost all overrejections are in the cells of methods FL and PS, and those of FL are more severe: the worst is 9.9% (13.7%) for the controlled size of 5% (10%) and they equal or surpass the nominal levels even when the monitoring horizon is only one m long, which equals 500 in Table 2. The four methods give nearly equal performance with respect to the two different models. The empirical sizes, however, do depend on model specification to some degree. Our simulations, whose details are not reported here, show that, when the sum of α and β is smaller and not as close to 1 as in Models 1 and 3, the problem of overrejection is much less severe even for the FL scheme. This is probably due to the fact that the greater α + β is, the less accurate estimation of the variance of squared GARCH(1,1) observations we can get.
Empirical sizes (in percentages) for the four monitoring methods applied to simulated series of squared GARCH(1,1) observations following Models 1 and 3 in Table 1

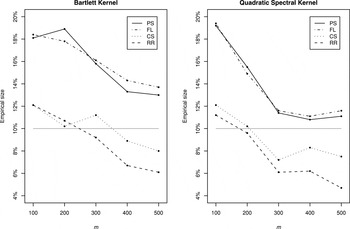
To save space, we do not present tables with the empirical sizes for the other four values of m, 100, 200, 300, and 400, considered in our study. To illustrate the overall conclusions that can be drawn from these tables, we present a representative graphical comparison in Figure 1. We focus on the results for Model 1 with controlled size 10% and q = 3. Plots of other cases support our overall conclusions. Figure 1 supports the observation made earlier that methods CS and RR are more conservative than methods PS and FL. In addition, empirical size basically decreases as we extend the historical sample size m. This is especially true for methods FL and RR with the Bartlett window, whose sizes fall monotonically as m increases from 100 to 500. When the Bartlett kernel is used, it seems that m = 200 is long enough for methods CS and RR to secure a size close to the nominal level of 10%, whereas for methods PS and FL even m = 500 can only yield sizes that are about 14%. As for the QS kernel, the sizes decrease consistently when m increases from 100 to 300 for all four algorithms, and they roughly level off for longer historical samples, meaning that extending m beyond 300 does not appreciably improve the performance. As we are more concerned about overrejections, the QS window is recommended, because it works better for methods PS or FL and brings their empirical sizes down to less than 12%, as opposed to 16% for the Bartlett window, when m = 300. Overall, however, the difference between the two windows is not large.

Comparison of empirical sizes. Results are reported for Model 1 with either Bartlett kernel or QS kernel. The monitoring horizon is q = 3. The straight line marks the target size of 10%.
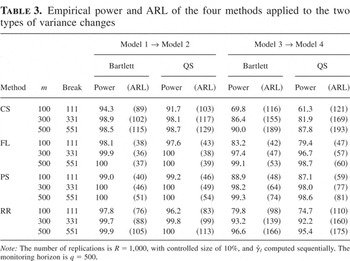
We next examine the power of the tests. We consider two typical variance changes that are represented by the passages from Model 1 to Model 2 and from Model 3 to Model 4. Focusing again on the five values of m equal to 100, 200, 300, 400, and 500, we generate the data and let the model transitions happen at t = 1.1m + 1. The monitoring starts from the (m + 1)th observation, but the monitoring horizon q is fixed at 500, instead of varying with m. The empirical power of the tests is the percentage of rejections in R replications. We used R = 1,000 in our simulations. A commonly used criterion of evaluating sequential procedures is the average run length (ARL) defined as the average of detection delays in the presence of a real break. Empirical ARL can be computed by subtracting the time of real break from the average of the alarm times in the R replications. To save space, we only report in Table 3 the results for m = 100, 300, 500 with controlled size 10%. The empirical ARL is shown in parentheses next to the power.
Empirical power and ARL of the four methods applied to the two types of variance changes

The general relation between size and power in hypothesis testing is that a test with a smaller size, i.e. a lower probability of type I error, tends to have a higher probability of type II error, i.e. lower power. With this in mind, it is not surprising to see that methods CS and RR have less power than methods FL and PS, because, as shown in Table 2 and Figure 1, their sizes are smaller and do not suffer from the problem of overrejection. This difference is most obvious when m = 100 and becomes negligible when m ≥ 300 and the transition is from Model 1 to Model 2, in which case the empirical powers are all more than 98%. The powers corresponding to the transition from Model 3 to Model 4 are generally lower, with longer ARL. This is may be because the variance increases about 3.5 times in the transition from Model 1 to Model 2 and about 3 times in the transition from Model 3 to Model 4. The difference is however practically negligible for methods FL and PS with m ≥ 300. An appealing property of the tests is that greater power comes with shorter ARL. In particular, the average detection delays of methods FL and PS, the two tests with greater power, are around 40 and less than 55 for the first type of change, but are more than double for the other two algorithms. As regards the choice of kernel function, the Bartlet kernel gives higher power and shorter ARL than the QS kernel. Overall, we may expect to get higher power by using more observations as a historical sample, but the gains, in terms of both power and ARL, of extending m beyond 300 are not significant.
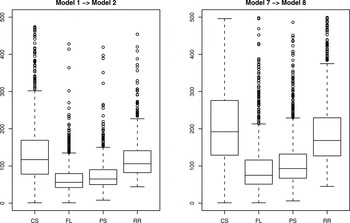
Using box plots, we present the distributions of the first hitting time in Figure 2 with m = 300. The plots for methods FL and PS are almost identical, except that the former has a slightly smaller median and interquartile range (the difference between third and first quartiles). The distributions for methods CS and RR are clearly more spread out. All distributions have elongated upper tails, i.e., are positively skewed. For the transition from Model 3 to Model 4, all summary statistics, including first quartile, median, third quartile, and interquartile range, increase, meaning that all methods are less effective in detecting this transition. Hitting time distributions for m = 100 and m = 500 have similar shapes. Perhaps somewhat counterintuitively, increasing m causes the center of the distributions to move to the right (longer delay time).

Comparison of the distributions of the first hitting time. Results are reported for m = 300 with break at n = 331, 10% controlled size, and the Bartlett kernel. The number of replications is R = 1,000. The historical sample size m = 300 is subtracted from the hitting times for ease of visual comparison.
To investigate the effect of the location of the break point on the power and the distribution of the detection time, we run simulations with the structural change occurring at 1.2m + 1, with the length of the monitoring horizon remaining equal to 500. There are barely any differences in terms of the power of the tests. The ARL, however, increases; it prolongs by around 20 for the transition from Model 1 to Model 2 and by about 30 for the other transition. The increases of the order statistics, such as median and the quartiles, are small.
We now discuss the effect of using covariances computed from the initial m observations rather than from the observations up to the current time n. The simulation results show that all four monitoring procedures suffer from the problem of overrejection; their relative performance, however, does not change. The methods CS and RR are still more conservative, producing smaller false alarm rates. Nearly all sizes are at least doubled; some are even more than ten times greater than those in Table 2. For the monitoring horizon q = 3m, with m = 500, method FL gives, as observed before, the worst results: 20.3% (23.9%) for nominal size 5% (10%). The power of the tests exceeds 97% in all cases, with much shorter ARL, basically halved, than those in Table 3. Because methods with covariances computed sequentially also have, however, satisfactory power, we recommend this way of computing the autocovariances.
In conclusion, we can say that if the primary concern is to control the false alarm rate under the nominal level, the methods CS and RR with sequentially computed covariances and the QS kernel are recommended. The choice of the algorithm is especially important for m = 100 and m = 200. The false alarm rates of methods PS and FL are much higher, but if we use the QS kernel and historical samples longer than 300, the problem becomes less severe. Generally, the QS kernel gives somewhat more conservative sizes than the Bartlett kernel. Methods PS and FL have only somewhat higher power than the other two methods, but the detection delay of methods CS and RR is basically two times larger than that of methods PS and FL.
APPENDIX A: Proofs of Theorems 3.1 and 3.2
The proof of Theorem 3.1 relies on several lemmas and Proposition A.1.
LEMMA A.1. If (2.4) holds, then

Proof. The lemma follows from assumption (2.4) and the law of the iterated logarithm for the Wiener process. █
LEMMA A.2. If (2.4) holds, then

Proof. Observe that

Because W(n) − W(n − 1) is a standard normal random variable,

so by the Borel–Cantelli lemma

This completes the proof of Lemma A.2. █
We will use the decomposition

LEMMA A.3. If (2.4) holds, (A.1) satisfies

Proof. By the mean value theorem, we have

By Lemma A.2,

By Lemma A.1,

and so

This completes the proof of Lemma A.3. █
Introduce the process

Computing the covariances shows that W*(·) is a standard Wiener process.
PROPOSITION A.1. If condition (2.4) holds, then

Proof. Using decomposition (A.1) and Lemma A.3, we observe that

Note that

where [x] is the integer part of x and

It is easy to see that

Therefore by Lemma A.1,

We can thus conclude that

It remains to note that by (2.4) and the modulus of continuity of W(·) (cf. Csörgő and Révész, 1981, Lem. 1.1.1)

and so

This completes the proof of Proposition A.1. █
Proof of Theorem 3.1. First we verify that

Relation (A.3) follows from Proposition A.1 and (3.5) because

By the scale transformation of the Wiener process

so it suffices to verify that

The remainder of the proof consists of the verification of (A.5). To lighten the notation, denote

Because U(·) is continuous with probability one, we assume in the following discussion that we consider a continuous realization for which (3.6) holds. Fix ε > 0.
By (3.6), there is a constant 0 ≤ c < ∞ such that

By (A.6), there is T* > 1 such that

Because for any T > 0,

we conclude that

By the first inequality in (A.7), there is M > T* such that

Because for any T > 1,

we have, as m → ∞,

Hence, there is m* such that for m ≥ m*,

By (A.10) and the second inequality in (A.8), for m ≥ m*,

Relation (A.5) follows by combining (A.8) and (A.11). █
Proof of Theorem 3.2. By Assumption (2.4),

By assumption (3.5)

Using the scale transformation of the Wiener process and the fact that

we conclude that

By (A.12) and (A.13), it remains to show that

Note that

Introduce the map u(t) = t/(t − 1), t > 1. Because |u′(t)| ≤ (c − 1)−2 for t ≥ c > 1, for any fixed c > 1

Because

assumption (3.6) implies that

Relation (A.14) follows from (A.15) and (A.16). This completes the proof of Theorem 3.2. █
APPENDIX B: Proofs of Theorems 3.3 and 3.4
Proof of Theorem 3.3. Observe that under H0, by (2.4),

Therefore,

Elementary verification shows that

so the assumption γ < ½ − α yields

It thus remains to verify that

Notice that if k/m → t, as m → ∞, then

Note also that (see Horváth et al., 2004, proof of Thm. 2.1)

Using the scale transformation of the Wiener process, (B.2) and the modulus of continuity of the Wiener process, and finally (B.3), we obtain

This completes the verification of (B.1) and the proof of Theorem 3.3. █
Proof of Theorem 3.4. Observe that under H0

Using (2.4) we obtain

where

, as m → ∞. Because

we see that there is a random variable

, which does not depend on k, such that

Similarly, as m → ∞

We note that

and conclude that, as m → ∞,

By (3.24),

Combining (B.4) and (B.5), we obtain

By the scale transformation and the modulus of continuity of the Wiener process,

where

As observed in Section 6 of Horváth et al. (2004), computing the covariances of the process Γ(·) shows that it is a Wiener process. Therefore, it remains to show that

This can be done by repeating the corresponding argument used in the proof of Theorem 3.1. Thus the proof of Theorem 3.4 is complete. █
References
REFERENCES
Anderson, T.W.
(1971)
The Statistical Analysis of Time Series.
Wiley.
Andreou, E. &
E. Ghysels
(2002)
Detecting multiple breaks in financial market volatility
dynamics.
Journal of Applied Econometrics
17,
579–600.CrossRefGoogle Scholar
Andreou, E. &
E. Ghysels
(2003)
Tests for breaks in the conditional co-movements of asset
returns.
Statistica Sinica
13,
1045–1073.Google Scholar
Andrews, D.W.K.
(1991)
Heteroskedasticity and autocorrelation consistent covariance matrix
estimation.
Econometrica
59,
817–858.CrossRefGoogle Scholar
Andrews, D.W.K. &
J.C. Monahan
(1992)
An improved heteroskedasticity and autocorrelation consistent
covariance matrix estimator.
Econometrica
60,
953–966.CrossRefGoogle Scholar
Bartlett, M.S.
(1950)
Periodogram analysis of continuous spectra.
Biometrika
37,
1–16.Google Scholar
Berkes, I.,
E. Gombay,
L. Horváth, &
P. S. Kokoszka
(2004)
Sequential change-point detection in GARCH(p,q)
models.
Econometric Theory
20,
1140–1167.CrossRefGoogle Scholar
Berkes, I.,
L. Horváth,
P. Kokoszka, &
Q.-M. Shao
(2005)
Almost sure convergence of the Bartlett estimator.
Periodica Mathematica Hungarica
51,
11–25.CrossRefGoogle Scholar
Berkes, I.,
L. Horváth,
P. Kokoszka, &
Q.-M. Shao
(2006)
On discriminating between long-range dependence and changes in
mean.
Annals of Statistics
34(3),
2395–2422.Google Scholar
Bradley, R.C.
(1986)
Basic properties of strong mixing conditions. In
E. Eberlein &
M.S. Taqqu (eds.),
Dependence in Probability and Statistics, pp.
165–192.
Boston:
Birkhaüser.
Carasco, M. &
X. Chen
(2002)
Mixing and moment properties of various GARCH and stochastic
volatility models.
Econometric Theory
18,
17–39.CrossRefGoogle Scholar
Chu, C.-S.J.
(1995)
Detecting parameter shift in GARCH models.
Econometric Reviews
14,
241–266.Google Scholar
Chu, C.-S.J.,
M. Stinchcombe, &
H. White
(1996)
Monitoring structural change.
Econometrica
64,
1045–1065.CrossRefGoogle Scholar
Csörgő, M. &
L. Horváth
(1993)
Weighted Approximations in Probability and Statistics.
Wiley.
Csörgő, M. &
P. Révész
(1981)
Strong Approximations in Probability and Statistics.
Academic Press.
Giraitis, L.,
P.S. Kokoszka,
R. Leipus, &
G. Teyssière
(2003)
Rescaled variance and related tests for long memory in volatility
and levels.
Journal of Econometrics
112,
265–294.CrossRefGoogle Scholar
Grenander, U. &
M. Rosenblatt
(1957)
Statistical Analysis of Stationary Time Series.
Wiley.
Haan, W.J. Den &
A. Levin
(1997)
A practitioner's guide to robust covariance matrix
estimation. In
C.R. Rao &
G.S. Maddala (eds.),
Handbook of Statistics,
vol. 15, pp.
291–341.
Hamilton, J.D.
(1994)
Time Series Analysis.
Princeton University Press.
He, C. &
T. Teräsvirta
(1999)
Properties of moments of a family of GARCH processes.
Journal of Econometrics
92,
173–192.CrossRefGoogle Scholar
Horváth, L.,
M. Hušková,
P. Kokoszka, &
J. Steinebach
(2004)
Monitoring changes in linear models.
Journal of Statistical Planning and Inference
126,
225–251.CrossRefGoogle Scholar
Inclán, C. &
G.C. Tiao
(1994)
Use of cumulative sums of squares for retrospective detection of
change of variance.
Journal of the American Statistical Association
89,
913–923.Google Scholar
Inoue, A.
(2001)
Testing for distributional change in time series.
Econometric Theory
17,
156–187.CrossRefGoogle Scholar
Itô, K. &
H.P. McKean
(1965)
Diffusion Processes and Their Sample Paths.
Springer.
Kim, S.,
S. Cho, &
S. Lee
(2000)
On the CUSUM test for parameter changes in GARCH(1,1) model.
Communications in Statistics—Theory and Methodology
29,
445–462.CrossRefGoogle Scholar
Kokoszka, P.S. &
R. Leipus
(1998)
Change-point in the mean of dependent observations.
Statistics and Probability Letters
40,
385–393.CrossRefGoogle Scholar
Kokoszka, P.S. &
R. Leipus
(1999)
Testing for parameter changes in ARCH models.
Lithuanian Mathematical Journal
39,
231–247.CrossRefGoogle Scholar
Kokoszka, P.S. &
R. Leipus
(2000)
Change-point estimation in ARCH models.
Bernoulli
6,
513–539.CrossRefGoogle Scholar
Kokoszka, P.S. &
R. Leipus
(2002)
Detection and estimation of changes in regime. In
P. Doukhan,
G. Oppenheim, &
M.S. Taqqu (eds.),
Theory and Applications of Long-Range Dependence, pp.
325–337.
Boston:
Birkhaüser.
Kulperger, R. &
H. Yu
(2005)
High moment partial sum processes of residuals in GARCH models and
their applications.
Annals of Statistics
33,
2395–2422.CrossRefGoogle Scholar
Mikosch, T. &
C. Stărică
(1999)
Change of Structure in Financial Time Series, Long Range Dependence
and the GARCH Model.
Technical report,
University of Groningen.
Mikosch, T. &
C. Stărică
(2002)
Long-range dependence effects and ARCH modeling. In
P. Doukhan,
G. Oppenheim, &
M.S. Taqqu (eds.),
Theory and Applications of Long-Range Dependence, pp.
439–459.
Boston:
Birkhäuser.
Parzen, E.
(1957)
On consistent estimates of the spectrum of a stationary time
series.
Annals of Mathematical Statistics
28,
329–348.CrossRefGoogle Scholar
Phillip, W. &
W. Stout
(1975)
Almost Sure Invariance Principles for Partial Sums of Weakly
Dependent Random Variables.
Memoirs of the American Mathematical Society 161.
Zhang, A.
(2005)
Estimation, testing and monitoring of GARCH models.
Ph.D. dissertation,
Utah State University.
Change-point models of the return data
Empirical sizes (in percentages) for the four monitoring methods applied to simulated series of squared GARCH(1,1) observations following Models 1 and 3 in Table 1
Comparison of empirical sizes. Results are reported for Model 1 with either Bartlett kernel or QS kernel. The monitoring horizon is q = 3. The straight line marks the target size of 10%.
Empirical power and ARL of the four methods applied to the two types of variance changes
Comparison of the distributions of the first hitting time. Results are reported for m = 300 with break at n = 331, 10% controlled size, and the Bartlett kernel. The number of replications is R = 1,000. The historical sample size m = 300 is subtracted from the hitting times for ease of visual comparison.
 You have
Access
- 34
- Cited by