



%20--%3e%3c!DOCTYPE%20svg%20PUBLIC%20'-//W3C//DTD%20SVG%201.0//EN'%20'http://www.w3.org/TR/2001/REC-SVG-20010904/DTD/svg10.dtd'%3e%3csvg%20version='1.0'%20id='Layer_1'%20xmlns='http://www.w3.org/2000/svg'%20xmlns:xlink='http://www.w3.org/1999/xlink'%20x='0px'%20y='0px'%20width='64px'%20height='64px'%20viewBox='5.5%20-3.5%2064%2064'%20enable-background='new%205.5%20-3.5%2064%2064'%20xml:space='preserve'%3e%3cg%3e%3ccircle%20fill='%23FFFFFF'%20fill-opacity='0'%20cx='37.785'%20cy='28.501'%20r='28.836'/%3e%3cpath%20fill='%23595959'%20d='M37.441-3.5c8.951,0,16.572,3.125,22.857,9.372c3.008,3.009,5.295,6.448,6.857,10.314%20c1.561,3.867,2.344,7.971,2.344,12.314c0,4.381-0.773,8.486-2.314,12.313c-1.543,3.828-3.82,7.21-6.828,10.143%20c-3.123,3.085-6.666,5.448-10.629,7.086c-3.961,1.638-8.057,2.457-12.285,2.457s-8.276-0.808-12.143-2.429%20c-3.866-1.618-7.333-3.961-10.4-7.027c-3.067-3.066-5.4-6.524-7-10.372S5.5,32.767,5.5,28.5c0-4.229,0.809-8.295,2.428-12.2%20c1.619-3.905,3.972-7.4,7.057-10.486C21.08-0.394,28.565-3.5,37.441-3.5z%20M37.557,2.272c-7.314,0-13.467,2.553-18.458,7.657%20c-2.515,2.553-4.448,5.419-5.8,8.6c-1.354,3.181-2.029,6.505-2.029,9.972c0,3.429,0.675,6.734,2.029,9.913%20c1.353,3.183,3.285,6.021,5.8,8.516c2.514,2.496,5.351,4.399,8.515,5.715c3.161,1.314,6.476,1.971,9.943,1.971%20c3.428,0,6.75-0.665,9.973-1.999c3.219-1.335,6.121-3.257,8.713-5.771c4.99-4.876,7.484-10.99,7.484-18.344%20c0-3.543-0.648-6.895-1.943-10.057c-1.293-3.162-3.18-5.98-5.654-8.458C50.984,4.844,44.795,2.272,37.557,2.272z%20M37.156,23.187%20l-4.287,2.229c-0.458-0.951-1.019-1.619-1.685-2c-0.667-0.38-1.286-0.571-1.858-0.571c-2.856,0-4.286,1.885-4.286,5.657%20c0,1.714,0.362,3.084,1.085,4.113c0.724,1.029,1.791,1.544,3.201,1.544c1.867,0,3.181-0.915,3.944-2.743l3.942,2%20c-0.838,1.563-2,2.791-3.486,3.686c-1.484,0.896-3.123,1.343-4.914,1.343c-2.857,0-5.163-0.875-6.915-2.629%20c-1.752-1.752-2.628-4.19-2.628-7.313c0-3.048,0.886-5.466,2.657-7.257c1.771-1.79,4.009-2.686,6.715-2.686%20C32.604,18.558,35.441,20.101,37.156,23.187z%20M55.613,23.187l-4.229,2.229c-0.457-0.951-1.02-1.619-1.686-2%20c-0.668-0.38-1.307-0.571-1.914-0.571c-2.857,0-4.287,1.885-4.287,5.657c0,1.714,0.363,3.084,1.086,4.113%20c0.723,1.029,1.789,1.544,3.201,1.544c1.865,0,3.18-0.915,3.941-2.743l4,2c-0.875,1.563-2.057,2.791-3.541,3.686%20c-1.486,0.896-3.105,1.343-4.857,1.343c-2.896,0-5.209-0.875-6.941-2.629c-1.736-1.752-2.602-4.19-2.602-7.313%20c0-3.048,0.885-5.466,2.658-7.257c1.77-1.79,4.008-2.686,6.713-2.686C51.117,18.558,53.938,20.101,55.613,23.187z'/%3e%3c/g%3e%3c/svg%3e)
%20--%3e%3c!DOCTYPE%20svg%20PUBLIC%20'-//W3C//DTD%20SVG%201.0//EN'%20'http://www.w3.org/TR/2001/REC-SVG-20010904/DTD/svg10.dtd'%3e%3csvg%20version='1.0'%20id='Layer_1'%20xmlns='http://www.w3.org/2000/svg'%20xmlns:xlink='http://www.w3.org/1999/xlink'%20x='0px'%20y='0px'%20width='64px'%20height='64px'%20viewBox='5.5%20-3.5%2064%2064'%20enable-background='new%205.5%20-3.5%2064%2064'%20xml:space='preserve'%3e%3cg%3e%3ccircle%20fill='%23FFFFFF'%20fill-opacity='0'%20cx='37.637'%20cy='28.806'%20r='28.276'/%3e%3cg%3e%3cpath%20fill='%23595959'%20d='M37.443-3.5c8.988,0,16.57,3.085,22.742,9.257C66.393,11.967,69.5,19.548,69.5,28.5c0,8.991-3.049,16.476-9.145,22.456%20C53.879,57.319,46.242,60.5,37.443,60.5c-8.649,0-16.153-3.144-22.514-9.43C8.644,44.784,5.5,37.262,5.5,28.5%20c0-8.761,3.144-16.342,9.429-22.742C21.101-0.415,28.604-3.5,37.443-3.5z%20M37.557,2.272c-7.276,0-13.428,2.553-18.457,7.657%20c-5.22,5.334-7.829,11.525-7.829,18.572c0,7.086,2.59,13.22,7.77,18.398c5.181,5.182,11.352,7.771,18.514,7.771%20c7.123,0,13.334-2.607,18.629-7.828c5.029-4.838,7.543-10.952,7.543-18.343c0-7.276-2.553-13.465-7.656-18.571%20C50.967,4.824,44.795,2.272,37.557,2.272z%20M46.129,20.557v13.085h-3.656v15.542h-9.944V33.643h-3.656V20.557%20c0-0.572,0.2-1.057,0.599-1.457c0.401-0.399,0.887-0.6,1.457-0.6h13.144c0.533,0,1.01,0.2,1.428,0.6%20C45.918,19.5,46.129,19.986,46.129,20.557z%20M33.042,12.329c0-3.008,1.485-4.514,4.458-4.514s4.457,1.504,4.457,4.514%20c0,2.971-1.486,4.457-4.457,4.457S33.042,15.3,33.042,12.329z'/%3e%3c/g%3e%3c/g%3e%3c/svg%3e)
1. The Sample
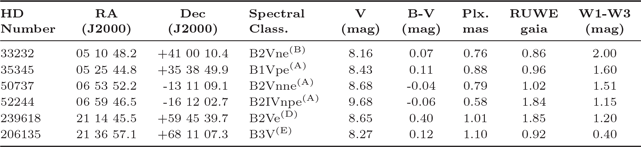
We performed high spatial resolution observations six Be stars during Cycle 29 using HST/FGS (HST proposal #16868 PI: S. Caballero-Nieves). We identified each of the six stars (Table 1) spectroscopically as Be stars via BeSS (Be Star Spectral catalog: Neiner 2018) showing emission lines in the visible or infrared. This study focuses on wide companions of Be stars that are possible triple systems where the inner binary has undergone some transfer of angular momentum in order to produce the decretion disk on the Be star.
2. Literature Search
None of the stars in our sample have been previously identified as having companions. Of note, HD 50737, HD 52244, and HD 206135 are identified as having a proper motion anomaly (Kervella et al. Reference Kervella, Arenou, Mignard and Thévenin2019). Furthermore, Cruzalèbes et al. (Reference Cruzalèbes, Petrov, Robbe-Dubois, Varga, Burtscher, Allouche, Berio, Hofmann, Hron, Jaffe, Lagarde, Lopez, Matter, Meilland, Meisenheimer, Millour and Schertl2019) observed HD 50737 and HD 206135 interferometricaly using the VLTI and detected no companion, Bodensteiner, J. et al. (2020) via literature review determined HD 35345 is presumably single, Peter, D. et al. (2012) used a luck imaging technique to observe HD 239618 and did not detect a companion.
2.1. Gaia RUWE
Castro-Ginard et al. (Reference Castro-Ginard, Penoyre, Casey, Brown, Belokurov, Cantat-Gaudin, Drimmel, Fouesneau, Khanna, Kurbatov, Price-Whelan, Rix and Smart2024) suggest a Gaia DR3 RUWE value of
 $\gt 1.4$
to indicate a positional anomaly due to a binary companion. The decretion disk around Be stars can add complications to the RUWE value due to their intrinsic variability. Fitton et al. (Reference Fitton, Tofflemire and Kraus2022) used a NEOWISE photometry criterion of W1-W3
 $\gt1$
, to identify stars with a disk and adopts a value of RUWE
 $\gt$
2.5 as the threshold for potential binarity for such stars. Five out of six stars in our sample meet the NEOWISE color criterion for having a disk and have a RUWE
 $\lt2.5$
suggesting no positional anomaly due to binarity. The star that does not meet the NEOWISE color criterion, HD 206135, has a RUWE
 $\lt1.4$
. Therefore, none of our targets have a RUWE value that suggests the presence of a companion.
3. Multiplicity Results
HST/FGS is a a white light shearing interferometer predominantly used for the guiding of HST. This style of interferometer scans and produces two orthogonal S-curves seen in the center plots of Fig. 1 (Solid Line). Of the six stars observed one showed a non-single S-curve. In order to fit the parameters of HD 52244, we used two main methods. The first is a
 $\chi^2$
fitting algorithm from the Space Telescope Science Institute (STScI) (Nelan and et al. Reference Nelan2011) where two copies of a single star “calibrator” S-curve and scales and shifts/scales them to fit the observed S-curve. The other algorithm we used employed the use of a cross-correlation function, where the “calibrator” is cross correlated with the observed S-curve. These two methods agree for the y-axis. For the x-axis the separation is small and the CCF fails to identify a companion so we used a second derivative test to check for the presence of a companion but due to the nature of this method we do not receive numerical results (separation and differential magnitude) for the companion. The results of these algorithms are presented in table 1.
Cross-correlation Function (CCF) and second derivative test for HD 52244 in x-axis (left) and y-axis (right). The top row is the mean residuals (grey) from the CCF routine and the observed S-curve with the detected component removed (black). Vertical lines show the location of a detected component. The middle row is the fit S-curve (dashed line) and the observed S-curve (solid line) from the CCF. The bottom row shows the results from the second derivative test with the black line being observed minus residuals, the grey region the standard deviation of the calibrators, and the red line being the second derivative.

Figure 1 Long description
Panel A: The left column contains three line graphs. The top graph shows the mean residuals from the cross-correlation function (CCF) routine in grey and the observed S-curve with the detected component removed in black. The vertical dashed line indicates the location of a detected component. The middle graph displays the fit S-curve as a dashed line and the observed S-curve as a solid line from the CCF. The bottom graph presents the results from the second derivative test, with the black line representing observed minus residuals, the grey region indicating the standard deviation of the calibrators, and the red line showing the second derivative. Panel B: The right column contains three line graphs similar to those in Panel A but for the y-axis. The top graph shows the mean residuals from the CCF routine in grey and the observed S-curve with the detected component removed in black. The vertical dashed line marks the location of a detected component. The middle graph displays the fit S-curve as a dashed line and the observed S-curve as a solid line from the CCF. The bottom graph presents the results from the second derivative test, with the black line representing observed minus residuals, the grey region indicating the standard deviation of the calibrators, and the red line showing the second derivative.
Plx. from Gaia Collaboration (Reference Collaboration2023) (A) Levenhagen and Leister (Reference Levenhagen and Leister2006) (B) Guetter (Reference Guetter1968) (C) Morgan et al. (Reference Morgan, Whitford and Code1953) (D) Boulon and Fehrenbach (Reference Boulon and Fehrenbach1959) (E) Racine (Reference Racine1968)

Table 1 Long description
A table listing astronomical data for various stars. The table has 6 rows and 9 columns. Column headers are: HD Number, RA (J2000), Dec (J2000), Spectral Class, V (mag), B-V (mag), Plx. mas, RUWE, W1-W3 (mag). Row 1: HD Number, 33232; RA (J2000), 05 10 48.2; Dec (J2000), +41 00 10.4; Spectral Class, B2Vne(B); V (mag), 8.16; B-V (mag), 0.07; Plx. mas, 0.76; RUWE, 0.86; W1-W3 (mag), 2.00. Row 2: HD Number, 35345; RA (J2000), 05 25 44.8; Dec (J2000), +35 38 49.9; Spectral Class, B1Vpe(A); V (mag), 8.43; B-V (mag), 0.11; Plx. mas, 0.88; RUWE, 0.96; W1-W3 (mag), 1.60. Row 3: HD Number, 50737; RA (J2000), 06 53 52.2; Dec (J2000), -13 11 09.1; Spectral Class, B2Vnne(A); V (mag), 8.68; B-V (mag), -0.04; Plx. mas, 0.79; RUWE, 1.02; W1-W3 (mag), 1.51. Row 4: HD Number, 52244; RA (J2000), 06 59 46.5; Dec (J2000), -16 12 02.7; Spectral Class, B2IV/Vnde(A); V (mag), 9.68; B-V (mag), -0.06; Plx. mas, 0.58; RUWE, 1.84; W1-W3 (mag), 1.15. Row 5: HD Number, 239618; RA (J2000), 21 14 45.5; Dec (J2000), +59 45 39.7; Spectral Class, B2Ve(C); V (mag), 8.65; B-V (mag), 0.40; Plx. mas, 1.01; RUWE, 1.85; W1-W3 (mag), 1.20. Row 6: HD Number, 206135; RA (J2000), 21 36 57.1; Dec (J2000), +68 11 07.3; Spectral Class, B3V(E); V (mag), 8.27; B-V (mag), 0.12; Plx. mas, 1.10; RUWE, 0.92; W1-W3 (mag), 0.40.
Results of the STScI and Cross-correlation algorithms to check for binary companions Notes:
 $^a$
This
 $\Delta \text{m}$
is fit in the y-axis and then held for the x-axis.
 $^b$
These results use the
 $\Delta x$
from the STScI code since it was not resolved with the CCF or second derivative test.

Table 2 Long description
The table presents a comparison of results from the STScI and Cross-correlation algorithms for checking binary companions. It has two rows and eight columns. The columns are labeled as follows: Delta x [mas], Delta y [mas], rho [mas], rho [AU], theta, Delta m_x, Delta m_y, and Delta m. The first row corresponds to the STScI algorithm and the second row to the Cross-correlation algorithm. Row 1: Delta x, -13.8 ± 0.2; Delta y, -39.8 ± 0.2; rho [mas], 42.2; rho [AU], 73.3; theta, 144.5°; Delta m_x, 1.91^a; Delta m_y, 1.91; Delta m, 1.91^a. Row 2: Delta x, -41.0 ± 0.2; Delta y, not applicable; rho [mas], 43.3; rho [AU], 75.1; theta, 143.9°^b; Delta m_x, 1.90; Delta m_y, not applicable; Delta m, not applicable.
4. Summary
Of the six Be stars we observed, HD 52244, had a detection of an unknown companion with a separation of 74 AU (42 mas) at a position angle of
 $144^\circ\pm0.3$
E of N and a differential magnitude in the Hubble F583W filter of 1.91. This observation used the F583W filter, that is much wider than the standard Johnson V filter. We assume a comparable differentiation magnitude in the V-Band and that the Be star is on the main sequence. Using
 $\Delta m_V =1.91$
and a
 $M_V=-1.5$
from Pecaut and Mamajek (Reference Pecaut and Mamajek2013), we arrive at the companion being a late B7-8 V star with
 $M_V=0.41$
. With a separation of 74 AU and a total mass of the system of 9.17
 $M_\odot$
. A circular orbit for this system would have a period of about 210 years, and follow-up observations with FGS could detect such motion.



 a
 Δm
 b
 Δx

 Open access

