




No CrossRef data available.
Article contents
T cell-dependent elimination of dividing Trypanosoma grosi from the bloodstream of Mongolian jirds
Published online by Cambridge University Press: 03 March 2004
Abstract
Mongolian jirds, Meriones unguiculatus, are susceptible to infection with Trypanosoma grosi, which naturally parasitizes Apodemus spp. The present study investigated T cell dependence of elimination of T. grosi from the bloodstream of jirds by in vivo T cell depletion using a monoclonal antibody (HUSM-M.g.15). In T cell-depleted jirds, elimination of T. grosi, particularly the dividing forms, from the bloodstream was significantly delayed, occurring at around week 3 p.i. The kinetics of serum levels of IgM and IgG specific to trypanosomes in T cell-depleted and control immunocompetent jirds were different; peak levels of IgM were noted on days 6–8 p.i. around the time of peak parasitaemia (day 6 p.i.) in immunocompetent jirds, whereas the serum levels began to increase abruptly after day 10 p.i., peaking at around day 18 p.i. in T cell-depleted jirds. Similarly, serum IgG increased after day 6 p.i. in immunocompetent jirds, in contrast to after day 12 p.i. in T cell-depleted jirds, and the level increased steadily even after disappearance of parasitaemia. Our findings indicate that T cells play a major role at least in the ‘first crisis’ during elimination of dividing T. grosi from the bloodstream.
Information
- Type
- Research Article
- Information
- Copyright
- 2004 Cambridge University Press
INTRODUCTION
Trypanosoma grosi of the subgenus Herpetosoma is a haemoflagellate naturally found in wild mice of the genus Apodemus such as A. agrarius, A. flavicollis, A. sylvaticus and A. peninsulae (Hoare, 1972; Sebek, 1978; Sebek et al. 1980; Sato et al. 2003). Recently, we succeeded in establishing in the laboratory 2 isolates of T. grosi, which originated from A. agrarius and A. peninsulae, using Mongolian jirds, Meriones unguiculatus (Sato et al. 2003). The course of infection with T. grosi in jirds resembles closely that of Trypanosoma (Herpetosoma) musculi infection in mice, rather than T. (H.) lewisi infection in rats; the parasite disappears from the bloodstream within 3 weeks of infection, but some dividing forms persist in the vasa recta of the kidney in infection by both T. musculi and T. grosi (Viens et al. 1972; Wilson et al. 1973; Targett & Viens, 1975; Sato et al. 2003). T. lewisi, however, shows no persistent infection after clearance from the bloodstream (Wilson et al. 1973; Targett & Viens, 1975).
The different courses of infection caused by T. musculi in mice and T. lewisi in rats may be due to host-specific differences in immune responses to each species (Viens, 1985; Albright & Albright, 1991). In the T. lewisi model, ablastin, reproduction-inhibiting antibody of the IgG class, combined with a IgG trypanocidal antibody, and trypanocidal antibody of the IgM class are responsible for the first (clearance of the dividing form) and second crises (clearance of all forms), respectively. On the other hand, ablastin activity is absent in the serum of T. musculi-infected mice, and dividing forms of T. musculi are eliminated from the bloodstream by trypanocidal antibody (Desbiens & Viens, 1981; Trudel et al. 1982), although Albright, Pierantoni & Albright (1990) provided an alternative explanation; reproduction of T. musculi continues in the peritoneal space and there is a dynamic balance between death of old, and the generation of new parasites during this phase. Furthermore, although humoral immune responses are crucial for clearance of both T. musculi and T. lewisi from the bloodstream, T cell-dependent clearance is seen only for the former species based on experiments in nude mice (Brooks & Reed, 1977; Rank, Roberts & Weidanz, 1977) and in artificially-induced T cell-deficient mice (Viens et al. 1974; Pouliot, Viens & Targett, 1977; Targett et al. 1981). House & Dean (1988a,b) suggested that the T cell dependence of elimination of T. musculi is predominantly due to the action of helper T cells, rather than cytotoxic T cells, and that the primary role of helper T cells is to enhance the induction of parasite-specific antibodies.
In a series of preliminary immunohistochemical studies, we noted in T. grosi-infected jirds a strong T cell expansion in the spleen and accumulation of T cells in the kidney even at week 1 p.i. The present study was designed to determine the role of T cells in elimination of T. grosi from the bloodstream of jirds by inducing an in vivo state of T cell depletion. The results demonstrated that T cell depletion prevented the first crisis with prolonged presence of dividing forms in peripheral blood, while the second crisis was associated with elimination of all forms of trypanosomes from the bloodstream presumably by T cell-independent humoral immune responses.
MATERIALS AND METHODS
Animals
Mongolian jirds were bred in the Institute for Animal Experiments, Hirosaki University School of Medicine. They were housed in plastic boxes and provided with commercial pellets (MF; Oriental Yeast Co., Tokyo, Japan) and water ad libitum. All animal experiments were performed according to the Guidelines on Animal Experimentation as set out by Hirosaki University.
Parasites
The original cultures containing trypanosomes (SESUJI and HANTO isolates of T. grosi that originated in primary cell cultures of tail tissues from A. agrarius and A. peninsulae, respectively) were kindly provided by Professor Y. Obara, Faculty of Agriculture and Life Science, Hirosaki University, as described previously (Sato et al. 2003). The parasites were cryopreserved in liquid nitrogen until use, and acclimatized for experimental use by 2–3 passages in in vitro cultures or prednisolone-treated jirds (Sato et al. 2003).
Genetic background of our isolates of T. grosi
Although both the SESUJI and HANTO isolates originated from Apodemus spp. and had identical morphology and dimensions with T. grosi in the natural host (Krampitz, 1961), these two showed different courses of parasitaemia in jirds in repeated experiments (Sato et al. 2003). Parasitaemia reached a peak level at around days 5–9 after intraperitoneal inoculation of these isolates, followed by a rapid clearance of the parasites from the bloodstream to levels below those detectable by microscopy, which was completed by day 14 p.i. in jirds infected with HANTO isolate, in contrast to day 21 p.i. in jirds infected with SESUJI isolate. Recently, Noyes et al. (2002) detected Herpetosoma trypanosomes of a novel genotype distinct from T. grosi from 2 out of 12 wood mice, A. sylvaticus, caught at Manor Wood, Wirral, Cheshire, UK. To confirm that our 2 isolates were really T. grosi, a region of the Trypanosoma 18S ribosomal RNA (rRNA) gene was amplified by polymerase chain reaction (PCR) according to Noyes et al. (2002) with primers: TRY927F 5′-GAAACAAGAAACACGGGAG-3′ and TRY927R 5′-CTACTGGGCAGCTTGGA-3′. Six parasite batches examined for this purpose included 2 different batches of the SESUJI and HANTO isolates of T. grosi and T. lewisi that originated from a wild brown rat, Rattus norvegicus, caught in Shihezi, Xinjiang, China on 13 September 2001. DNA was extracted separately from these parasites with GenomicPrep™ Cells and Tissue DNA Isolation Kit (Amersham Pharmacia Biotech, Piscataway, NJ, USA) according to the instructions provided by the manufacturer. Amplified PCR products of 940 base pairs (bp) each were semi-purified with Montage™ PCR Centrifugal Filter Devices (Millipore Co., Bedford, MA, USA), and sequenced in both directions using the aforementioned primers on ABI PRISM™ 377 (PE Applied Biosystems Inc., Foster City, CA, USA) by a commercial service (FASMAC Co., Atugi, Kanagawa, Japan). The reliable sequence of 839 bp between positions 794 and 1632 in the reported T. lewisi sequence (GenBank Accession no. AJ009156) of our T. lewisi material was completely identical with the reported sequence of T. lewisi (AJ009156), and those of T. grosi were identical with it except for a single base substitution (‘C’ instead of ‘T’ at position 1387 of the AJ009156), demonstrating that both SESUJI and HANTO isolates have an identical partial sequence of the 18S rRNA gene with T. grosi (GenBank Accession no. AY043355).
Infection and monitoring of parasitaemia
Parasite preparations for infection were collected from prednisolone-treated jirds on day 7 p.i. and resuspended in heparin-added RPMI 1640 medium (Nissui Pharmaceutical Co., Sugamo, Tokyo, Japan) supplemented with 0·3% L-glutamine, 100 U/ml penicillin, 100 μg/ml streptomycin, and 0·25 μg/ml amphotericin B. The final concentration of T. grosi in the medium was 1×10⁶ or 1×10⁷ organisms/ml. Ten-week-old female jirds were injected intraperitoneally with 0·2 ml (2×10⁵ organisms/animal) or 0·5 ml (5×10⁶ organisms/animal) of the suspension for the primary and challenge infection, respectively. The course of parasitaemia was monitored by counting the number of T. grosi in a haemocytometer using blood samples collected from the orbital venous plexus and diluted in 0·83% NH4Cl with heparin. Similarly, the number of leukocytes/mm3 was determined by counting these cells on a haemocytometer after staining of diluted blood samples with Türk's solution. A thin blood smear was prepared and stained with Giemsa's solution, and examined to determine the morphological features of parasites and differential leukocyte count. Impression smears of the spleen, kidney and peritoneal cavity were prepared and stained with Giemsa's solution to examine persistent dividing trypanosomes.
Monoclonal antibody to jird T cells
A murine mAb, HUSM-M.g.15 of IgG2b isotype, specific to a jird's T cell surface determinant was used for in vivo T cell depletion in jirds (Sato, Ihama & Kamiya, 2000). Two murine mAbs that do not cross-react with any jird cells, HUSM-19 of IgG2a isotype and HUSM-65 of IgG1 isotype, were used as control mAbs to evaluate specific T cell depletion by HUSM-M.g.15. The selection of these two mAbs was due to the unavailability of isotype-matched mAb. HUSM-19 and HUSM-65 are specific to guinea-pig major histocompatibility complex class II molecules and macrophages, respectively (Sato, Inaba & Kamiya, 1997). Hybridoma clones producing these mAbs were injected intraperitoneally into pristane-primed BALB/c mice to produce ascitic fluids. Ascitic fluid samples were centrifuged and precipitated by addition of ammonium sulphate to 50%. After dissolving and dialysis in 0·15 M Dulbecco(−) phosphate-buffered saline (PBS), pH 7·6, the preparation was applied to a stirred ultrafiltration cell (model 8200; Amicon division, W. R. Grace and Co., Beverly, MA, USA) equipped with YM100 DIAFLO® ultrafiltration membrane (cutting point 100 kDa; Amicon Division). The final concentration of semi-purified IgG was determined using a spectrophotometer at 280 nm, adjusted at 2·0 mg protein/ml in PBS. The purity of IgG was approximately 50% of total protein as determined by sodium dodecyl sulphate-polyacrylamide gel electrophoresis (SDS–PAGE).
T cell depletion and prednisolone treatment
For 3 consecutive days, 0·25 ml of semi-purified mAb or PBS alone was injected intraperitoneally and thereafter at 3-day intervals for the period of the experiment. This treatment commenced 1 week before infection. A dose of 10 mg prednisolone tertiary-butylacetate (Suspension of Codelcortone®-T.B.A., Merck & Co., Inc., Rahway, NJ, USA) was injected subcutaneously at days −7, −2 and 0 days relative to the day of infection.
Response to mitogen
To confirm the lack of functional T cells in jirds treated with mAb HUSM-M.g.15, splenocytes were exposed to a T cell mitogen, Concanavalin A (Con A; Wako Pure Chemical Industries, Osaka, Japan). Briefly, splenocytes were adjusted to 2×10⁶ cells/ml of supplemented RPMI-1640 medium containing 10% heat-inactivated foetal bovine serum (Filtron, Brooklyn, Australia) and 5 μg/ml of Con A. In the next step, the cell suspension was dispensed at 200 μl/well into a 96-well plate. Triplicate samples were obtained from each animal, and kept under sterile conditions in 5% CO2-humidified chamber at 37 °C. The reaction was checked under inverted microscopy on the second and third days of incubation.
Immunohistochemistry
Cryostat sections, 6 μm thick, were air-dried and fixed for 10 min in acetone. Other detailed procedures of immunohistochemistry were described previously (Sato et al. 2003). Anti-trypanosome sera were produced in guinea-pigs as described previously (Sato et al. 2003), and horseradish peroxidase (HRP)-conjugated goat antiserum to guinea-pig IgG (E-Y Laboratories, Inc., San Mateo, CA) was used to detect the reactivity. Bound antibody was detected using colour development by 3,3′-diaminobenzidine, followed by light counterstaining with haematoxylin. In order to assess non-specific staining, control sections were prepared as above but with naive guinea-pig serum as the primary antibody.
Selection of commercially available conjugates reactive with jird IgM and IgG
Because conjugates specific to jird immunoglobulins are not available commercially, we tested those against mouse, rat, guinea-pig, and rabbit immunoglobulins to identify highly cross-reactive conjugates with jird IgM and IgG as follows; HRP-conjugated affinity-purified, F(ab′)2 fragment to mouse IgG(Fc) (ICN Pharmaceuticals, Inc., Aurora, OH, USA); HRP-conjugated goat IgG fraction to mouse IgM(μ) (Organon Teknika Co., Cappel™ Research Products, Durham, NC, USA); HRP-conjugated goat affinity-purified, F(ab′)2 fragments to mouse IgM (H+L), absorbed with human, bovine and horse sera (American Qualex, San Clemente, CA, USA); HRP-conjugated goat affinity-purified antibody to mouse IgA(α) (Zymed Laboratories, Inc., San Francisco, CA, USA); biotin-conjugated rabbit affinity-purified antibody to rat IgG (H+L) (Chemicon International Inc., Temecula, CA, USA); biotin-conjugated goat affinity-purified antibody to rat IgA (Bethy Laboratories, Inc., Montgomery, TX, USA), HRP-conjugated goat serum to guinea-pig IgG (E-Y Laboratories); and HRP-conjugated sheep serum to rabbit IgG (whole molecule) (Organon Teknika Co.). Rabbit anti-mouse IgG1 (γ1 chain specific), anti-mouse IgG2a (γ2a), anti-mouse IgG2b (γ2b), anti-mouse IgG3 (γ3), anti-mouse IgM (μ) antibodies, and HRP-conjugated goat anti-rabbit IgG packed in Immunopure® monoclonal antibody isotyping kit (Pierce, Rockford, IL, USA) were also used for dot-blotting. To reduce cross-reactivity to jird IgM by an anti-rat IgG (H+L) conjugate, 0·3 ml of commercially-provided antibody solution was mixed with concentrated jird IgM mAb solution containing 3 mg of proteins for 3 h at room temperature, and the precipitate was removed by ultracentrifugation.
Pooled sera of naive jirds were precipitated by addition of ammonium sulphate to 33%, and the precipitate was collected by centrifugation at 6000 g for 30 min. In addition, the culture supernatant of jird mAbs mentioned below was concentrated using a Vivaspin Concentrator with 100 000 MWCO PES membranes (Vivascience AG, Hannover, Germany), and applied to a gel filtration using Sephadex®-G-200 (Pharmacia Biotec AB, Uppsala, Sweden). Immunoglobulin-rich fractions were concentrated again using a Vivaspin Concentrator mentioned above. After determination of protein concentration, pooled jird sera or jird mAbs were applied to SDS–PAGE using 12·5% gel under reducing conditions, followed by transfer onto a nitrocellulose membrane. In addition, a certain concentration of each concentrated mAb was dotted on a nitrocellulose membrane. Membrane strips or scraps were incubated with HRP- or biotin-conjugated antibodies mentioned above and, if necessary, with HRP-conjugated avidin D (Vector Laboratories, Inc., Burlingame, CA). Bound antibody was detected using colour development by 3,3′-diaminobenzidine.
Hybridoma producing jird monoclonal antibodies
Four 10-week-old female jirds were injected intraperitoneally with 2×10⁵T. grosi at approximately 3-week intervals for 2 months. Three 13-week-old female jirds were orally inoculated with approximately 3–5×10⁴ protoscoleces of Echinococcus multilocularis grown in jirds as secondary hydatidosis at 4 to 15-week intervals for 35 weeks. Three days after the last inoculation, the spleen and mesenteric lymph nodes were dissected out from jirds repeatedly inoculated with T. grosi and E. multilocularis, respectively. Jird lymphoid cells and murine myeloma cells of the X-63 cell line were fused at a ratio of 5[ratio ]1, using 50% polyethylene glycol (Mr 1300–1600; Sigma Chemical Co., St Louis, MO, USA). The cells were plated on flat-bottomed 24-well plates at 2×10⁶ cells/well. Thymocytes from naive young jirds were used as feeder cells. Hybridoma cells were selected with HAT medium (Sigma Chemical Co.) from the day of fusion. Screening for antibody production was performed using enzyme-linked immunosorbent assay (ELISA) of culture supernatants with use of variable conjugates such as anti-mouse IgA(α), anti-mouse IgM(μ), and anti-rat IgG (H+L) mentioned above. Clones with possible production of any immunoglobulin were subcloned twice by limiting dilution.
Enzyme-linked immunosorbent assay
In vitro-cultured trypanosomes (Sato et al. 2003) or E. multilocularis protoscoleces were immersed in 50 mM Tris buffer (pH 8·2) containing 1% Triton X-100, 150 mM NaCl, 10 mM EDTA and 0·5 mM phenylmethylsulphonyl fluoride. Three cycles of freezing and thawing were followed by intermittent ultrasonication for 5 min, and the supernatant was collected by centrifugation at 6000 g for 30 min. ELISA plates were sensitized with 0·4 μg T. grosi protein/well or 2·0 μg E. multilocularis protein/well, and residual binding sites were blocked with 1% bovine serum albumin (fraction V; Sigma Chemical Co.) in PBS. For measuring serum immunoglobulins, triplicate samples/test serum were examined. Bound HRP-conjugates were detected by colour development with a substrate solution containing o-phenylenediamine. Before reading at 490 nm, the reaction was terminated by the addition of 4 M sulphuric acid solution.
Statistical analysis
Data were expressed as mean±S.D. or S.E.M. as indicated. Differences between 2 groups were examined for significance using the Student's t-test. A P value less than 0·05 denoted statistical significance.
RESULTS
To evaluate the role of T cells in the elimination of T. grosi from the bloodstream of jirds, we employed a murine mAb specific to a jird's T cell surface determinant (HUSM-M.g.15) for in vivo depletion of functional T cells. Although this method has been reported to be efficient in eliminating functional T cells (Sato et al. 2000), several parameters to monitor the efficacy of this treatment were assessed regularly or at the final day of experiments, including peripheral blood leukocyte count, histology, response of splenocytes to a T cell mitogen, and serum levels of immunoglobulins. Experiments were repeated twice for the SESUJI isolate and once for the HANTO isolate of T. grosi, but the results shown here are representative of experiments using SESUJI isolate with some complementary data from other experiments.
In vivo T cell depletion by HUSM-M.g.15
Serial injections of mAb HUSM-M.g.15 resulted in marked leukopenia, particularly lymphocytopenia in peripheral blood (Fig. 1). Immunohistochemistry of lymphoid tissues such as the spleen, lymph nodes and Peyer's patches from treated jirds on the day of infection (7th day of treatment) showed disappearance of T cells and marked reduction in size of the lymphoid follicles (Fig. 2). Marked leukocytosis was seen in peripheral blood during the second and third weeks of infection in all groups (Fig. 1). In T cell-depleted jirds, the highest proportion of blood leukocytes was neutrophils (ranging from 41 to 66% of total peripheral leukocyte count of T-depleted jirds throughout the observation period, while that of the control groups ranged from 20 to 40%), while lymphocytes increased in a limited manner, but steadily, reaching a peak value at day 18 p.i. Immunohistochemistry of the spleen of infected jirds sacrificed at day 28 p.i. showed that T cell-depleted jirds had developed lymphoid follicles without either the T cell area and corona, both of which were well developed in the other groups of jirds (Fig. 2). To confirm the lack of functional T cells in HUSM-M.g.15-treated jirds, splenocytes of animals sacrificed on day 28 p.i. were exposed to Con A. In control animals, splenocytes responded very well to the mitogen with the appearance of larger cell clusters and increased cellularity. In contrast, cells from T cell-depleted jirds showed little or no response (data not shown).

Fig. 1. Serial changes in the number of peripheral blood leukocytes in jirds infected with Trypanosoma grosi. Values are expressed as mean (A) and mean±S.E.M. (B) of 4–5 animals/group. Jirds were injected intraperitoneally with PBS (□), PBS along with subcutaneous prednisolone injection (○), control mAb ([utri ]), or anti-T cell mAb ([bull ]) from 7 day prior to infection. *P<0·05, compared with PBS-injected control animals at the respective time.

Fig. 2. Immunohistochemistry of the spleen of T cell-depleted (A and B) and control mAb-injected jirds (C and D). Cryostat sections of the spleen at day 3 prior to infection (A and C) or at day 28 p.i. (B and D) were immunohistochemically stained with mAb HUSM-M.g.15. Arrowheads indicate the central arteriole, asterisks indicate positively-stained T cells, and small arrows indicate the corona region. Notice that lymphoid follicles in a T cell-depleted jird have neither T cell areas nor corona.
Effect of in vivo T cell depletion on the course of parasitaemia
Clearance of T. grosi from peripheral blood was significantly delayed in T cell-depleted jirds, compared with immunocompetent jirds (Fig. 3). Furthermore, small-sized, dividing trypanosomes were frequently seen over the duration of parasitaemia in T cell-depleted jirds, while only monomorphic, non-dividing forms were observed in immunocompetent jirds after week 1 p.i. Examination around the time of the clearance of trypanosomes from peripheral blood showed marked thrombocytosis and frequent attachment of platelets to trypanosomes. In T cell-depleted jirds, thrombocytosis was evident at day 18 p.i., in contrast to at day 12 p.i. in immunocompetent jirds. An homologous challenge infection at day 21 p.i. produced no parasitaemia (Fig. 3). All jirds were sacrificed on day 28 p.i., and smears of ascitic fluid demonstrated lack of challenge trypanosomes, which contrasted with a large number of parasites in the peritoneal cavity of the control T cell-depleted jird at day 7 after primary infection (Fig. 4). Dividing trypanosomes were found in the vasa recta of kidneys of both control and T cell-depleted jirds sacrificed on day 28 p.i., although these dividing forms were less prominent in immunocompetent jirds. In contrast to control jirds, in which T cell aggregations were frequently found around the border of the renal cortex and medulla, these were absent in T cell-depleted jirds, indicating again the successful depletion of T cells from these animals.

Fig. 3. Time-course of parasitaemia in jirds after infection with Trypanosoma grosi. Values are mean of 4–5 animals/group. Symbols and asterisks are similar to Fig. 1. Reinfection on day 21 after the primary infection failed to induce parasitaemia, which was checked on days 22, 24, 26 and 28 post-infection. Infectivity of the challenge parasites was demonstrated in other jirds (not shown).

Fig. 4. Trypanosoma grosi found in the peritoneal cavity of a T cell-depleted jird sacrificed on day 7 of the primary infection. No such parasites were found in the peritoneal cavity of T cell-depleted jirds on day 7 after the challenge infection. Giemsa's stain.
In another experiment, 7-week-old female jirds were infected with 2×10⁵ SESUJI isolate. Parasitaemia was observed until day 28 p.i. (9700±5600/ml; n=5) in T cell-depleted jirds, whereas trypanosomes disappeared by day 21 p.i. in immunocompetent, mAb-treated and untreated control jirds (n=4 each). Reinfection on day 42 after the primary infection failed to induce parasitaemia, which was checked 1 week later. In an experiment using HANTO, a higher level of parasitaemia was observed until day 13 p.i. in T cell-depleted jirds (n=2), whereas bloodstream trypanosomes were found up to days 9–11 p.i. in control animals (n=3). Reappearance of trypanosomes in the peripheral blood was noted on day 21 p.i. (the final day of this experiment) in the T cell-depleted jird.
Reactivity of jird IgM and IgG with commercially available conjugates
To monitor the serum levels of IgM and IgG specific to T. grosi in T cell-depleted and immunocompetent jirds, suitable conjugates to detect them were tested by Western blotting with ammonium sulphate-precipitated jird serum. An anti-mouse IgM (H+L) conjugate detected both heavy (H) and light (L) chains of jird IgM, and an anti-mouse IgM(μ) conjugate identified the H chain of jird IgM. An anti-rat IgG (H+L) conjugate detected both H and L chains of jird IgG and IgM. In addition, an anti-rat IgA (H+L) conjugate found the H and L chains of jird IgM as well as IgG. Other conjugates showed a variable degree of cross-reactivity with jird immunoglobulins, but their reactions were inferior to the aforementioned anti-mouse or anti-rat immunoglobulin conjugates. Fig. 5 shows a panel of jird IgM and IgG mAbs visualized by a mixture of anti-rat IgG (H+L), anti-rat IgA (H+L), and anti-mouse IgM (H+L), indicating that 2 types of the H chain with different molecular weights (50 kDa and 48 kDa) were distinguished in jird's IgG. The reactivity of each jird mAb (IgM and 2 IgG subclasses) to various conjugates was checked by Western blotting as well as dot-ELISA using nitrocellulose membranes (Fig. 6). Of particular interest was that anti-mouse IgG3 antibody detected efficiently a jird IgG subclass with smaller H chains. This IgG subclass as well as IgM was detected efficiently also by an anti-rat IgG (H+L) conjugate, and the absorption of the conjugate with jird IgM mAb reduced the reactivity with IgM, but not the IgG subclass with smaller H chains (Fig. 6). At the end, an anti-mouse IgM(μ) conjugate (American Qualex), an anti-rat IgG (H+L) conjugate (Chemicon International Inc.), and the latter conjugate absorbed with jird IgM mAb were used for monitoring jird serum IgM, IgM and IgG, and IgG, respectively, by ELISA mentioned below.

Fig. 5. Western blotting of a panel of jird monoclonal antibodies with a mixture of anti-rat IgG (H+L), anti-rat IgA (H+L) and anti-mouse IgM (H+L) conjugates. Three (lanes 4, 5 and 8) originated from the mesenteric lymph nodes of jirds orally immunized with Echinococcus multilocularis protoscoleces, and the other 7 originated from the spleen of jirds inoculated repeatedly with Trypanosoma grosi. Molecular weight standard is shown on the left side. Lanes 1 and 9 represent jird IgM antibody (80 kDa for the heavy chain), while the others are jird IgG of 2 subclasses showing different molecular weights of the heavy chain (50 and 48 kDa; the latter is indicated by arrows, i.e., lanes 3, 6 and 10). The light chain (25 kDa) of jird IgM is visualized by anti-mouse IgM and anti-rat IgA, and shown by asterisks. Many bands of unknown nature, ranging in position between 23 and 29 kDa, are visualized by an anti-rat IgG conjugate in several lanes.

Fig. 6. Dot blotting of a panel of jird monoclonal antibodies (M, IgM; G1, IgG subclass with heavy chains of 50 kDa; and G2, IgG subclass with heavy chains of 48 kDa) and intestinal IgA (A) with commercially-available conjugates to find out suitable ones for detecting jird IgM and IgG. Anti-rat IgG (H+L) detects all classes of immunoglobulins, particularly IgM and one IgG subclass with smaller heavy chains (G2). Anti-mouse IgM (μ) detects jird IgM and IgA. An anti-mouse IgG3 (γ3) detects preferentially G2. An anti-rat IgG (H+L) conjugate absorbed with jird IgM loses cross-reactivity with IgM (cf. E and F). Eight monoclonal antibodies (all G1) originated from the mesenteric lymph nodes of jirds orally immunized with Echinococcus multilocularis protoscoleces, while the other 9 (2 IgM, 4 G1 and 3 G2) originated from the spleen of jirds inoculated repeatedly with Trypanosoma grosi. Jird IgA was prepared from intestinal washes from five 3-week-old jirds.
Effect of in vivo T cell depletion on humoral immune responses
The kinetics of humoral immune responses represented by serum levels of IgM and IgG specific to T. grosi antigens are shown in Fig. 7. Immunocompetent jirds showed peak levels of specific IgM and IgG on days 6–8 p.i., when quite limited increases in these antibodies were detectable in T cell-depleted jirds. In T cell-depleted animals, however, serum levels of specific IgM and IgG began to increase abruptly from day 12 p.i., to a peak level around week 3 p.i. for IgM or a steady increase until the end of the observation for IgG.

Fig. 7. Serial changes in serum levels of IgM (A), IgM+IgG (B), and IgG (C) after infection with Trypanosoma grosi, which were detected by anti-mouse IgM (μ) conjugate, anti-rat IgG (H+L) conjugate, and anti-rat IgG (H+L) conjugate pre-absorbed with jird IgM monoclonal antibody, respectively. Symbols are similar to Fig. 1. Results are expressed as mean of 4–5 animals/group. Note the lack of detectable specific IgG antibody in T cell-depleted jirds before day 12 p.i. (closed symbols). Arrowheads on the ordinates indicate cut-off points (mean+3 S.D. of OD values on day 0 p.i.) for each test.
DISCUSSION
In T cell-depleted jirds, clearance of T. grosi from peripheral blood was significantly delayed and dividing forms were seen for a longer period, compared with immunocompetent jirds. These findings suggest that T cells play a major role in the ‘first crisis’, eliminating only dividing T. grosi, but not in the ‘second crisis’ that eliminates all forms, from the bloodstream. This finding distinguishes T. grosi infections in jirds from both T. lewisi infection in rats and T. musculi infection in mice. T cell-independent humoral immune responses play a major role in both ‘first and second crises’ against T. lewisi in rats (Hanson & Chapman, 1974), and T cell-dependent humoral immune responses are critical for clearance of both ‘first and second crises’ against T. musculi in mice (Viens et al. 1974; Brooks & Reed, 1977; Pouliot et al. 1977; Rank et al. 1977; Targett et al. 1981; Vargas, Viens & Kongshavn, 1984; House & Dean, 1988a,b). T cell-deficient or deprived mice do not recover from infection, and dividing forms of T. musculi remain in the bloodstream for the life-time of the animals.
The exact mechanism responsible for elimination of non-dividing T. musculi from the bloodstream of mice remains to be elucidated (Viens, 1985; Albright & Albright, 1991), and a direct trypanocidal effect of antibody was ruled out (Viens, Pouliet & Targett, 1973; Targett & Viens, 1975). Elimination of T. musculi from the bloodstream is unaffected in mice deficient in the complement component C5, in which the complement-mediated lytic pathway is blocked (Dusanic, 1975; Jarvinen & Dalmasso, 1977; Wechsler & Kongshavn, 1988). Complement component C3, however, is thought to be necessary for clearance of non-dividing T. musculi from the bloodstream of mice, since C3 depletion in mice during peak parasitaemia results in a reduced rate of parasite elimination (Jarvinen & Dalmasso, 1977; Wechsler & Kongshavn, 1985). Elimination of non-dividing T. musculi is suggested to be an antibody-facilitated, cell-dependent process (Ferrante, 1986; Vincendeau, Daeron & Daulouede, 1986; Vincendeau, Daulouede & Veyret, 1989; Kongshavn et al. 1990).
Characteristic serial changes in serum levels of specific IgM and IgG were seen with a close association with clearance of T. grosi from the bloodstream of jirds, suggesting that humoral immune responses play a role in the elimination of T. grosi from jirds as well. Although neither the class of antibody nor the mechanism of the action responsible for clearance of T. grosi from the bloodstream were investigated, a sustained increase in serum IgG was noted from days 8 or 12 p.i. in immunocompetent and T cell-depleted jirds, respectively, corresponding to the time of elimination of the bloodstream form of T. grosi. However, it should be noted that the present detection system for serum IgG might be biased to measuring one of at least two IgG subclasses of jirds. The complement fixing capacity of these two subclasses is unknown at present. Further characterisation of these IgG subclasses as well as production of mAbs suitable for detection of a special IgG subclass are in progress. Furthermore, T cell-dependent and independent responses play a role at different time-points during the course of infection, i.e., the ‘first and second crises’, respectively. This speculation, however, needs to be confirmed in future studies, because other researchers reported recently a lack of antibody response to T cell-independent antigens in jirds (Mohanty & Rabindran, 2002). At present, we believe that our in vivo depletion of functional T cells from jirds was satisfactory for assessment of the role of T cells in T. grosi infection as demonstrated by multiple parameters, and jirds can produce T cell-independent humoral responses.
The immune system of jirds is in several ways unique compared with mice and rats, as has been mentioned previously (Kamiya & Sato, 1990; Horii, Khan & Nawa, 1993; Khan, Horii & Nawa, 1993; Maruyama et al. 1994; Sato, Chisty & Kamiya, 2000; Sato, Ihama & Kamiya, 2001; Sato & Kamiya, 2001; Sato et al. 2001, 2003; Mohanty & Ravindran, 2002). It is unlikely, however, that the successful infection of T. grosi in jirds is ascribed to any of these immunological defects, since our recent attempt to infect jirds with T. lewisi was unsuccessful (unpublished) and Mühlpfordt (1969) reported identical results. The new and classical models of Herpetosoma, i.e., T. grosi infection in jirds, T. musculi infection in mice, and T. lewisi infection in rats, show different patterns of T cell-dependent elimination of trypanosomes from the bloodstream. The basis of such differences is unknown but interesting to pursue. These studies should clarify the species-specific biology and immunogenicity of Herpetosoma trypanosomes and simultaneously characterize parts of the unique immune system of Mongolian jirds, an important laboratory host for a variety of infectious agents from viruses to helminths of medical and veterinary importance.
We are grateful to Professor Y. Obara, Hirosaki University, and Drs W. Jiang and Q. Zheng, Xinjiang Centre of Disease Prevention and Control, China, for their kind supply of the original parasite materials. This work was supported in part by Grants-in-Aid (Nos. 13460137, 13575039, 13670240, and 15390134) from the Japan Society for the Promotion of Science. In addition, we would like to acknowledge the Japan Health Science Foundation for a scholarship to H. Sato, that enabled invaluable discussion with Professor John R. Kusel, IBLS, University of Glasgow, on this work. At last, many thanks are to an anonymous reviewer who identified inadequate areas in the original manuscript and provided invaluable suggestions to improve this work.
References
REFERENCES
ALBRIGHT, J. W. &
ALBRIGHT, J. F.
(1991).
Rodent trypanosomes: their conflict with the immune system of the host.
Parasitology Today 7, 137–140.CrossRefGoogle Scholar
ALBRIGHT, J. W.,
PIERANTONI, M. &
ALBRIGHT, J. F.
(1990).
Immune and nonimmune regulation of the population of Trypanosoma musculi in infected host mice.
Infection and Immunity 58, 1757–1762.Google Scholar
BROOKS, B. O. &
REED, N. D.
(1977).
Thymus dependency of Trypanosoma musculi elimination from mice.
Journal of the Reticuloendothelial Society 22, 605–608.Google Scholar
DESBIENS, C. &
VIENS, P.
(1981).
Trypanosoma musculi in CBA mice: trypanocidal mechanism eliminating dividing forms.
Parasitology 83, 109–113.CrossRefGoogle Scholar
DUSANIC, D. G.
(1975).
Trypanosoma musculi infections in complement-deficient mice.
Experimental Parasitology 37, 205–210.CrossRefGoogle Scholar
FERRANTE, A.
(1986).
The role of the macrophage in immunity to Trypanosoma musculi.
Parasite Immunology 8, 117–127.CrossRefGoogle Scholar
HANSON, W. L. &
CHAPMAN, W. L., Jr.
(1974).
Comparison of the effects of neonatal thymectomy on Plasmodium berghei, Trypanosoma lewisi and Trypanosoma cruzi infection in the albino rat.
Zeitschrift für Parasitenkunde 44, 227–238.CrossRefGoogle Scholar
HOARE, C. A.
(1972).
The Trypanosomes of Mammals. Blackwell Scientific Publications, Oxford.
HORII, Y.,
KHAN, A. I. &
NAWA, Y.
(1993).
Persistent infection of Strongyloides venezuelensis and normal expulsion of Nippostrongylus brasiliensis in Mongolian gerbil, Meriones unguiculatus, with reference to the cellular responses in the intestinal mucosa.
Parasite Immunology 15, 175–179.CrossRefGoogle Scholar
HOUSE, R. V. &
DEAN, J. H.
(1988 a).
Trypanosoma musculi: characterization of the T-lymphocyte dependency of immunity by selective immunomodulation of the mouse, Mus musculus.
Experimental Parasitology 67, 104–115.Google Scholar
HOUSE, R. V. &
DEAN, J. H.
(1988 b).
Adoptive cell transfer studies to examine the role of T lymphocytes in immunity to Trypanosoma musculi.
Journal of Parasitology 74, 819–827.Google Scholar
JARVINEN, J. A. &
DALMASSO, A. P.
(1977).
Trypanosoma musculi infections in normocomplementemic, C5-deficient, and C3-depleted mice.
Infection and Immunity 16, 557–563.Google Scholar
KAMIYA, M. &
SATO, H.
(1990).
Complete life cycle of the canid tapeworm, Echinococcus multilocularis, in laboratory rodents.
FASEB Journal 4, 3334–3339.CrossRefGoogle Scholar
KHAN, A. I.,
HORII, Y. &
NAWA, Y.
(1993).
Defective mucosal immunity and normal systemic immunity of Mongolian gerbils, Meriones unguiculatus, to reinfection with Strongyloides venezuelensis.
Parasite Immunology 15, 565–571.CrossRefGoogle Scholar
KONGSHAVN, P. A. L.,
SHAW, K.,
GHADIRIAN, E. &
ULCZAK, O.
(1990).
Failure to demonstrate a major role for Kupffer cells and radiosensitive leukocytes in immunoglobulin-mediated elimination of Trypanosoma musculi.
Infection and Immunity 58, 1971–1978.Google Scholar
KRAMPITZ, H. E.
(1961).
Kritisches zur Taxonomie und Systematik parasitischer Säugetier-Trypanosomen mit besonderer Beachtung einiger die in Wühlmäusen verbreiteten spezifischen Formen.
Zeitschrift für Tropenmedizin und Parasitologie 12, 117–137.Google Scholar
MARUYAMA, H.,
KOBAYASHI, T.,
TSUCHIYA, K.,
HORII, Y. &
NAWA, Y.
(1994).
Sensitive enzyme-linked immunosorbent assay (ELISA) method to measure parasite-specific antibodies of Mongolian gerbils.
Japanese Journal of Parasitology 43, 351–357.Google Scholar
MOHANTY, M. C. &
RABINDRAN, B.
(2002).
Deficiency of antibody responses to T-independent antigens in gerbils – Meriones unguiculatus.
Developmental and Comparative Immunology 26, 385–391.CrossRefGoogle Scholar
MÜHLPFORDT, H.
(1969).
Die Entwicklung von Trypanosoma lewisi in Meriones unguiculatus bei zusätzlicher Bartonella-Infection.
Zeitschrift für Tropenmedizin und Parasitologie 20, 136–144.Google Scholar
NOYES, H. A.,
AMBROSE, P.,
BARKER, F.,
BEGON, M.,
BENNET, M.,
BOWN, K. J. &
KEMP, S. J.
(2002).
Host specificity of Trypanosoma (Herpetosoma) species: evidence that bank voles (Clethrionomys glareolus) carry only one T. (H.) evotomys 18S rRNA genotype but wood mice (Apodemus sylvaticus) carry at least two polyphyletic parasites.
Parasitology 124, 185–190.Google Scholar
POULIOT, P.,
VIENS, P. &
TARGETT, G. A. T.
(1977).
T-lymphocytes and the transfer of immunity to Trypanosoma musculi in mice.
Clinical and Experimental Immunology 27, 507–511.Google Scholar
RANK, R. G.,
ROBERTS, D. W. &
WEIDANZ, W. P.
(1977).
Chronic infection with Trypanosoma musculi in congenitally athymic nude mice.
Infection and Immunity 16, 715–716.Google Scholar
SATO, H. &
KAMIYA, H.
(2001).
Defect of protective immunity to Schistosoma mansoni infection in Mongolian gerbils involves limited recruitment of dendritic cells in the vaccinated skin.
Parasite Immunology 23, 627–632.CrossRefGoogle Scholar
SATO, H.,
CHISTY, M. &
KAMIYA, H.
(2000).
Anti-Thy-1 monoclonal antibody-induced glomerulonephritis in Mongolian gerbils.
Comparative Medicine 50, 603–608.Google Scholar
SATO, H.,
IHAMA, Y. &
KAMIYA, H.
(2000).
Survival of destrobilated adults of Taenia crassiceps in T cell-depleted Mongolian gerbils.
Parasitology Research 86, 284–289.CrossRefGoogle Scholar
SATO, H.,
INABA, T. &
KAMIYA, H.
(1997).
Production of murine monoclonal antibodies to guinea pig leukocytes and immunohistochemistry of guinea pig skin exposed to Schistosoma mansoni.
Hybridoma 16, 529–536.CrossRefGoogle Scholar
SATO, H.,
CHISTY, M.,
NARGIS, M.,
INABA, T.,
YAGISAWA, M. &
KAMIYA, H.
(2001).
Monoclonal antibodies reactive with dendritic cells of Mongolian gerbils.
Comparative Medicine 51, 234–238.Google Scholar
SATO, H.,
ISHITA, K.,
MATSUO, K.,
INABA, T.,
KAMIYA, H. &
ITO, M.
(2003).
Persistent infection of Mongolian jirds with a non-pathogenic trypanosome, Trypanosoma (Herpetosoma) grosi.
Parasitology 127, 357–363.CrossRefGoogle Scholar
SEBEK, Z.
(1978).
Blood parasites of small mammals in western Hungary.
Parasitologia Hungarica 11, 17–22.Google Scholar
SEBEK, Z.,
SIXL, W.,
STUNZNER, D.,
VALOVA, M.,
HUBALEK, Z. &
TROGER, H.
(1980).
The blood parasites of wild small mammals in Steinermark and Burgenland, Austria.
Folia Parasitologica 27, 295–301 (in German with English summary).Google Scholar
TARGETT, G. A. T. &
VIENS, P.
(1975).
The immunological response of CBA mice to Trypanosoma musculi: elimination of the parasite from the blood.
International Journal for Parasitology 5, 231–234.CrossRefGoogle Scholar
TARGETT, G. A. T.,
LEUCHARS, E.,
DAVIES, A. J. S. &
VIENS, P.
(1981).
Thymus graft reconstitution of T cell-deprived mice infected with Trypanosoma musculi.
Parasite Immunology 3, 353–358.CrossRefGoogle Scholar
TRUDEL, L.,
DESBIENS, C.,
VIENS, P. &
TARGETT, G. A. T.
(1982).
Ablastin and the control of Trypanosoma musculi infections in mice.
Parasite Immunology 4, 149–156.CrossRefGoogle Scholar
VARGAS, F. D. C.,
VIENS, P. &
KONGSHAVN, P. A. L.
(1984).
Trypanosoma musculi infection in B-cell-deficient mice.
Infection and Immunity 44, 162–167.Google Scholar
VIENS, P.
(1985).
Immunology of nonpathogenic trypanosomes of rodents. In
Immunology and Pathogenesis of Trypanosomiasis (ed. Tizard, I.), pp. 201–223.
CRC Press,
Boca Raton, Florida.
VIENS, P.,
POULIET, P. &
TARGETT, G. A. T.
(1973).
Cell-mediated immunity during the infection of CBA mice with Trypanosoma musculi.
Canadian Journal of Microbiology 19, 105–106.Google Scholar
VIENS, P.,
TARGETT, G. A. T.,
LEUCHARDS, E. &
DAVIES, A. J. S.
(1974).
The immunological response of CBA mice to Trypanosoma musculi: I. Initial control of the infection and the effect of T cell deprivation.
Clinical and Experimental Immunology 16, 279–294.Google Scholar
VIENS, P.,
TARGETT, G. A. T.,
WILSON, V. C. L. C. &
EDWARDS, C. I.
(1972).
The persistence of Trypanosoma (Herpetosoma) musculi in the kidneys of immune CBA mice.
Transactions of the Royal Society of Tropical Medicine and Hygiene 66, 669–670.CrossRefGoogle Scholar
VINCENDEAU, P.,
DAERON, M. &
DAULOUEDE, S.
(1986).
Identification of antibody classes and Fc receptors responsible for phagocytosis of Trypanosoma musculi by mouse macrophages.
Infection and Immunity 53, 600–605.Google Scholar
VINCENDEAU, P.,
DAULOUEDE, S. &
VEYRET, B.
(1989).
Role of hypochlorous acid in Trypanosoma musculi killing by phagocytes.
Parasitology 98, 253–257.CrossRefGoogle Scholar
WECHSLER, D. S. &
KONGSHAVN, P. A. L.
(1985).
Characterization of antibodies mediating protection and cure of Trypanosoma musculi infection in mice.
Infection and Immunity 48, 787–794.Google Scholar
WECHSLER, D. S. &
KONGSHAVN, P. A. L.
(1988).
Further characterization of the curative antibodies in Trypanosoma musculi infection.
Infection and Immunity 56, 2379–2384.Google Scholar
WILSON, V. C. L. C.,
VIENS, P.,
TARGETT, G. A. T. &
EDWARDS, C. I.
(1973).
Comparative studies on the persistence of Trypanosoma (Herpetosoma) musculi and T. (H.) lewisi in immune hosts.
Transactions of the Royal Society of Tropical Medicine and Hygiene 67, 271–272.Google Scholar
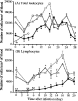
Fig. 1. Serial changes in the number of peripheral blood leukocytes in jirds infected with Trypanosoma grosi. Values are expressed as mean (A) and mean±S.E.M. (B) of 4–5 animals/group. Jirds were injected intraperitoneally with PBS (□), PBS along with subcutaneous prednisolone injection (○), control mAb ([utri ]), or anti-T cell mAb ([bull ]) from 7 day prior to infection. *P<0·05, compared with PBS-injected control animals at the respective time.

Fig. 2. Immunohistochemistry of the spleen of T cell-depleted (A and B) and control mAb-injected jirds (C and D). Cryostat sections of the spleen at day 3 prior to infection (A and C) or at day 28 p.i. (B and D) were immunohistochemically stained with mAb HUSM-M.g.15. Arrowheads indicate the central arteriole, asterisks indicate positively-stained T cells, and small arrows indicate the corona region. Notice that lymphoid follicles in a T cell-depleted jird have neither T cell areas nor corona.

Fig. 3. Time-course of parasitaemia in jirds after infection with Trypanosoma grosi. Values are mean of 4–5 animals/group. Symbols and asterisks are similar to Fig. 1. Reinfection on day 21 after the primary infection failed to induce parasitaemia, which was checked on days 22, 24, 26 and 28 post-infection. Infectivity of the challenge parasites was demonstrated in other jirds (not shown).

Fig. 4. Trypanosoma grosi found in the peritoneal cavity of a T cell-depleted jird sacrificed on day 7 of the primary infection. No such parasites were found in the peritoneal cavity of T cell-depleted jirds on day 7 after the challenge infection. Giemsa's stain.

Fig. 5. Western blotting of a panel of jird monoclonal antibodies with a mixture of anti-rat IgG (H+L), anti-rat IgA (H+L) and anti-mouse IgM (H+L) conjugates. Three (lanes 4, 5 and 8) originated from the mesenteric lymph nodes of jirds orally immunized with Echinococcus multilocularis protoscoleces, and the other 7 originated from the spleen of jirds inoculated repeatedly with Trypanosoma grosi. Molecular weight standard is shown on the left side. Lanes 1 and 9 represent jird IgM antibody (80 kDa for the heavy chain), while the others are jird IgG of 2 subclasses showing different molecular weights of the heavy chain (50 and 48 kDa; the latter is indicated by arrows, i.e., lanes 3, 6 and 10). The light chain (25 kDa) of jird IgM is visualized by anti-mouse IgM and anti-rat IgA, and shown by asterisks. Many bands of unknown nature, ranging in position between 23 and 29 kDa, are visualized by an anti-rat IgG conjugate in several lanes.

Fig. 6. Dot blotting of a panel of jird monoclonal antibodies (M, IgM; G1, IgG subclass with heavy chains of 50 kDa; and G2, IgG subclass with heavy chains of 48 kDa) and intestinal IgA (A) with commercially-available conjugates to find out suitable ones for detecting jird IgM and IgG. Anti-rat IgG (H+L) detects all classes of immunoglobulins, particularly IgM and one IgG subclass with smaller heavy chains (G2). Anti-mouse IgM (μ) detects jird IgM and IgA. An anti-mouse IgG3 (γ3) detects preferentially G2. An anti-rat IgG (H+L) conjugate absorbed with jird IgM loses cross-reactivity with IgM (cf. E and F). Eight monoclonal antibodies (all G1) originated from the mesenteric lymph nodes of jirds orally immunized with Echinococcus multilocularis protoscoleces, while the other 9 (2 IgM, 4 G1 and 3 G2) originated from the spleen of jirds inoculated repeatedly with Trypanosoma grosi. Jird IgA was prepared from intestinal washes from five 3-week-old jirds.
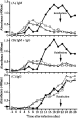
Fig. 7. Serial changes in serum levels of IgM (A), IgM+IgG (B), and IgG (C) after infection with Trypanosoma grosi, which were detected by anti-mouse IgM (μ) conjugate, anti-rat IgG (H+L) conjugate, and anti-rat IgG (H+L) conjugate pre-absorbed with jird IgM monoclonal antibody, respectively. Symbols are similar to Fig. 1. Results are expressed as mean of 4–5 animals/group. Note the lack of detectable specific IgG antibody in T cell-depleted jirds before day 12 p.i. (closed symbols). Arrowheads on the ordinates indicate cut-off points (mean+3 S.D. of OD values on day 0 p.i.) for each test.
 You have
Access
- 5
- Cited by