
1. Introduction
1.1. General research approach
Considering a turbulent flow that is dominated by a strong coherent oscillatory motion, the dynamics observed from measurements are twofold: there are the deterministic oscillatory motions potentially stemming from an intrinsic global hydrodynamic instability, and the broadband stochastic motion of the background turbulence. The differentiation of these deterministic and stochastic dynamics is key for accurately interpreting and modelling the dominant flow dynamics. While this separation can be achieved from a Fourier decomposition, a proper orthogonal decomposition (POD) or phase averaging of time-resolved data (Holmes et al. Reference Holmes, Lumley, Berkooz and Rowley2012), it does not reveal the origin of the oscillatory motion independently from the stochastic turbulent forcing. Analogously, if oscillations in turbulent flows are modelled by approaches formerly used to describe instabilities in laminar flows, an appropriate closure for the neglected turbulent fluctuations must be included. In this spirit, the dynamical models developed here built on models that were derived to describe dominant instabilities of laminar flows in the vicinity of the bifurcation point (Stuart Reference Stuart1958). However, these models are extended to account for perturbation from background turbulence by adding a stochastic forcing term, with the goal of determining the global stability of turbulent flows based only on observational data.
1.2. Linear instabilities in turbulent flows
To predict the bifurcation of laminar flows, linear stability analysis has been applied successfully in many cases (Landau & Lifshitz Reference Landau and Lifshitz1987). The consideration of small perturbations on the base flow and their effect on the eigenmode response of the linearised Navier–Stokes equations provides the decisive exponential growth rate of the coherent structures. Even for unstable flows, where the instability has already grown considerably, the mode shapes and frequencies of the coherent structures might still be approximated from a stability analysis based on the mean-flow field (Barkley Reference Barkley2006). This mean-flow stability analysis furthermore allows one to assess the sensitivity of the coherent structures to perturbations or forcing of the velocity field (Meliga, Pujals & Serre Reference Meliga, Pujals and Serre2012b; Carini et al. Reference Carini, Airiau, Debien, Léon and Pralits2017). In the case of turbulent flows, the coherent fluctuations can be interpreted as linear perturbations of the mean flow, while the remaining fluctuations act as an increased viscosity. The accurate modelling of the turbulent viscosity is essential to predict the observed coherent structures in highly turbulent flows (Oberleithner, Paschereit & Wygnanski Reference Oberleithner, Paschereit and Wygnanski2014; Viola et al. Reference Viola, Iungo, Camarri, Porté-Agel and Gallaire2014; Rukes, Paschereit & Oberleithner Reference Rukes, Paschereit and Oberleithner2016; Tammisola & Juniper Reference Tammisola and Juniper2016).
The mean-flow stability analysis has a general trait resulting from the fact that the mean flow is also formed by the Reynolds stresses induced by the investigated coherent structures. Namely, the predicted amplification rates indicate only neutral stability, no matter how large the original linear instability was that caused the coherent structures to grow. The investigation of Mantič-Lugo, Arratia & Gallaire (Reference Mantič-Lugo, Arratia and Gallaire2015) demonstrates this property from a coupled simulation using mean-field stability analysis and the steady Navier–Stokes equation to describe the transition of the cylinder wake flow from an unstable stationary state to saturated limit-cycle oscillations of the Kármán vortex street. There, it is shown that the Reynolds stresses of the coherent structures change the mean flow such that the instability becomes neutrally stable when the flow reaches the limit cycle. However, there are some cases reported in the literature where this is not the governing mechanism. For instance, Sipp & Lebedev (Reference Sipp and Lebedev2007) demonstrated that the mean-flow changes led to neutral stability for the global instability in a cylinder wake but not in a cavity flow. Furthermore, Turton, Tuckerman & Barkley (Reference Turton, Tuckerman and Barkley2015) showed that the mean-flow-driven saturation is not the governing mechanism that leads to saturation of standing waves in thermosolutal convection. In these cases, the failure of the mean-flow model is related to a strong nonlinear interaction between the fundamental mode and the first harmonic. The present investigation covers the global mode in a swirling jet, for which it was shown that the saturation is governed by the mean-flow change (Müller et al. Reference Müller, Lückoff, Paredes, Theofilis and Oberleithner2020).
The concept of the nonlinearity describing the saturation mechanism of hydrodynamic instabilities is referred to as mean-field theory. The idea of a weakly nonlinear saturation was first given by Landau's amplitude equation (Landau Reference Landau1944) derived from analytical reasoning. In the context of nonlinear stability theory, the mean-field theory explains the observation of supercritical and subcritical Hopf bifurcations via hydrodynamic instabilities (Stuart Reference Stuart1958). The work of Noack et al. (Reference Noack, Afanasiev, Morzyński, Tadmor and Thiele2003) further shows that also the transient dynamics from a steady state to the limit cycle can be covered by a simple mean-field model including an oscillatory mode for the dynamics of the instability and a shift-mode capturing the slow mean-flow corrections. In the present work, the model structure and wording used in Noack et al. (Reference Noack, Afanasiev, Morzyński, Tadmor and Thiele2003) are adopted and extended by consideration of stochastic disturbances induced by background turbulence.
An open aspect of describing transient dynamics by the amplitude equation and the mean-field model is the time delay between a change of the oscillation amplitude and the resulting correction of the mean flow that leads to a change of the amplification rate. Stuart (Reference Stuart1958) assumed this to be an instant feedback, which justifies the use of only the amplitude equation without considering the shift-mode. However, experimental investigations showed that there are flows that exhibit a delay in this feedback, which motivates the delay–saturation model suggested by Villermaux & Hopfinger (Reference Villermaux and Hopfinger1994). In the present work, this delay–saturation model cannot be used because the involved delay operation constitutes a memory of the system that conflicts with the requirements of the stochastic method. Alternatively, the mean-field model allows one to consider this delay through the inclusion of the shift-mode as an additional state variable. Accordingly, we adjust the mean-field model to the dynamics observed in the flow.
1.3. Stochastic methods for system identification
The identification of the fundamental properties of a physical system from observation data is essential for retaining the physical parameters of the flow from the calibrated models. From the many aspects of this field, we focus on the output-only calibration of grey-box models (Ljung Reference Ljung2012). The term ‘output-only’ refers to the utilisation of observation data of a system. This approach is in contrast to input–output data, which refers to an active forcing of the system and recording of the corresponding response. The term ‘grey-box model’ refers to the use of empirical models that are motivated by physics or the observed dynamics. This is in contrast to ‘white-box models’, which are derived directly from the governing equations, and also in contrast to ‘black-box models’, which only reproduce dynamics and are not related to the physics of the system.
The models employed in this work for the system identification are the amplitude equation and the mean-field model. Having two and three state variables, respectively, these are low-order models that represent only the dominant dynamics of a turbulent flow. The remaining dynamics is considered as stochastic turbulent fluctuations that may enter the model as a stochastic forcing. From the experimental perspective, an output-only calibration is performed that uses only stationary measurements of the flow. However, the intrinsic forcing of the flow by its background turbulence is also considered for the system identification. This requires one to estimate the properties of the stochastic forcing in line with the deterministic dynamics of the flow.
The accurate treatment of such stochastic equations requires a systematic introduction of the model. An overview of the topic can be found in the review of Friedrich et al. (Reference Friedrich, Peinke, Sahimi and Reza Rahimi Tabar2011) about stochastic methods for data-driven identification of physical systems. The general concept of the approach is a strict separation of deterministic and stochastic contributions in the model. This is obtained by requiring the model to have the form of a Langevin equation. Therefore, the model must account for all the deterministic dynamics contained in the data. It is not possible to oversimplify the model and lump secondary dynamics into the stochastic forcing. The stochastic part must be uncorrelated from the deterministic part to handle the data in this framework.
The requirement of the stochastic differential equation having the form of a Langevin equation implies that the future evolution of the system depends only on the current state of the system. Therefore, there should be no memory of the system or hidden variables that interfere with the resolved state variables. Moreover, the stochastic component of the equation must be uncorrelated such that the evolution of the system behaves like a Markov process. All deterministic dynamics present in the observed system must be described by the model, since they cannot be lumped together with the unresolved stochastic turbulence. However, a sufficient separation of time-scales allows some of the dynamics to be treated as stochastic contributions. The assumption of a Markov process allows one to describe the temporal evolution of the probability density function (PDF) by the corresponding Fokker–Planck equation. This eliminates the stochastic variable and gives a probabilistic description of the system that can be compared to statistical moments obtained from measured data.
The basic principle of stochastic methods proposed by Friedrich et al. (Reference Friedrich, Siegert, Peinke, St. Lück, Lindemann, Raethjen, Deuschl and Pfister2000) utilises the direct computation of the drift and diffusion terms from the first and second statistical moments of the data. This requires one to conduct a limiting process that may conflict with the non-vanishing correlation time of the stochastic process (Lehle & Peinke Reference Lehle and Peinke2018). An alternative is the evaluation of finite-time propagation of the PDF with the Fokker–Planck equation and comparison with the PDF of the data (Kleinhans & Friedrich Reference Kleinhans and Friedrich2007) or the direct estimation of the parameters from the adjoined Fokker–Planck equation (Boujo & Noiray Reference Boujo and Noiray2017). Furthermore, the stationary PDF of the data can be compared to the stationary solution of the Fokker–Planck equation as pursued by Noiray & Schuermans (Reference Noiray and Schuermans2013), Bonciolini, Boujo & Noiray (Reference Bonciolini, Boujo and Noiray2017) and Lee et al. (Reference Lee, Zhu, Li and Gupta2019).
Stochastic methods were applied to identify universal features of the turbulent cascade (Friedrich & Peinke Reference Friedrich and Peinke1997; Reinke et al. Reference Reinke, Fuchs, Nickelsen and Peinke2018), leading to very simple models that correctly capture the spectral properties of the cascade. Concerning the thermoacoustic system of a combustor, Noiray & Schuermans (Reference Noiray and Schuermans2013) proposed various approaches to derive the parameters of a Van der Pol oscillator from different measures of the data. This was further extended to handle also systems with non-white noise (Bonciolini et al. Reference Bonciolini, Boujo and Noiray2017). The existence of coherence resonance in a generic thermoacoustic system was also shown by Kabiraj et al. (Reference Kabiraj, Steinert, Saurabh and Paschereit2015), where the external stochastic forcing allowed further classification of the associated Hopf bifurcation before the onset of the instability (Saurabh et al. Reference Saurabh, Kabiraj, Steinert and Oliver Paschereit2017). The study of Lee et al. (Reference Lee, Kim, Gupta and Li2020) further showed that the detection of emerging thermoacoustic instabilities is also possible for the turbulent flow in a swirl-stabilised combustor by using the intrinsic forcing of the background turbulence.
The stochastic dynamics of turbulent axisymmetric and bluff-body wakes was studied by Rigas et al. (Reference Rigas, Morgans, Brackston and Morrison2015) and Brackston et al. (Reference Brackston, García de la Cruz, Wynn, Rigas and Morrison2016), respectively, showing that the symmetry-breaking modes are governed by simple stochastic models. The dynamics of a freely rotating disc in uniform flow was shown by Boujo & Cadot (Reference Boujo and Cadot2019) to be governed by a stochastic low-order model that captures the main features. The self-excited oscillations in the fluid acoustic system of bottle whistling were furthermore shown to be governed by a randomly forced Van der Pol oscillator (Boujo et al. Reference Boujo, Bourquard, Xiong and Noiray2020). The investigations of Zhu, Gupta & Li (Reference Zhu, Gupta and Li2019) and Lee et al. (Reference Lee, Zhu, Li and Gupta2019) revealed that the bifurcation, leading to the global instability of a low-density jet, can be characterised from the evaluation of stochastic forcing in the stable regime of the flow.
Beyond these very recent investigations, there were previous approaches to model the dynamics of turbulent flows by stochastic equations. Examples are the description of the bursts in boundary layers as noisy heteroclinic cycles by Stone & Holmes (Reference Stone and Holmes1989), and the control of such dynamics by Coller, Holmes & Lumley (Reference Coller, Holmes and Lumley1994). The occurrence of noise-induced dynamics of marginally stable modes is often also referred to as coherence resonance, referring to the work of Gang et al. (Reference Gang, Ditzinger, Ning and Haken1993). Another probabilistic description of fluid dynamics was recently proposed by Kaiser et al. (Reference Kaiser, Noack, Cordier, Spohn, Segond, Abel, Daviller, Östh, Krajnović and Niven2014), who used data-driven state-space segmentation to identify the related transition probability that allows the dynamics of the flow to be inferred. In the work of Brunton, Proctor & Kutz (Reference Brunton, Proctor and Kutz2016), the residuals of the model are interpreted as intermittent forcing of a deterministic system; this is in contrast to the present approach, where Markov properties of the stochastic forcing are expected.
To the best of the authors’ knowledge, there are no applications of stochastic methods to describe the characteristics of a global hydrodynamic instability besides the work of Zhu et al. (Reference Zhu, Gupta and Li2019) and Lee et al. (Reference Lee, Zhu, Li and Gupta2019). In contrast to their work, the current investigation does not rely on external forcing of the flow but utilises the background turbulence as intrinsic stochastic forcing.
1.4. Detailed research approach
In the present work, we consider the dominant coherent structure occurring in turbulent jets at high swirl. Swirling jets are commonly used in combustors to provide anchoring of the flame (Syred & Beér Reference Syred and Beér1974). This is due to the unique feature of the flow, which is known as vortex breakdown. If the swirl intensity in the jet exceeds a certain threshold, the jet breaks down and forms a recirculation region in the centre (Billant, Chomaz & Huerre Reference Billant, Chomaz and Huerre1998). In combustion applications, this provides recirculation of hot exhausts that stabilises the flame. The swirl intensity that governs the onset of vortex breakdown is quantified by the swirl number, given by the ratio of azimuthal to axial momentum flux (Chigier & Chervinsky Reference Chigier and Chervinsky1967) (see also Appendix A for the definition).
Beyond the onset of vortex breakdown, the swirl number remains the major control parameter for a global hydrodynamic instability. With increasing swirl number, the flow passes through a supercritical Hopf bifurcation that gives rise to a global mode (Gallaire & Chomaz Reference Gallaire and Chomaz2003; Liang & Maxworthy Reference Liang and Maxworthy2005; Oberleithner et al. Reference Oberleithner, Sieber, Nayeri, Paschereit, Petz, Hege, Noack and Wygnanski2011). It takes the form of a single helical structure that precesses around the centre axis of the jet. In the following, this specific global mode is referred to as a helical mode. In combustion-related applications, the helical mode is also known as a precessing vortex core (Syred & Beér Reference Syred and Beér1974; Terhaar et al. Reference Terhaar, Reichel, Schrödinger, Rukes, Paschereit and Oberleithner2014; Vanierschot & Ogus Reference Vanierschot and Ogus2019).
The supercritical Hopf bifurcation of global modes is commonly described by the Landau equation (Landau Reference Landau1944). Accordingly, the squared limit-cycle amplitude of the helical mode  $|A_{\textit{LC}}|^2$ should be proportional to the swirl number
 $S$ as
 \begin{equation} |A_{\textit{LC}}|^2 \propto S-S_{c}, \end{equation}
with the swirl number being the control parameter that governs the bifurcation of the global mode. The critical swirl number  $S_{c}$ marks the bifurcation point, where the flow transitions from a stable fixed point to an unstable fixed point. With the unstable fixed point at
 $S>S_{c}$, the flow converges to a stable limit cycle instead.
However, in turbulent flows, the helical-mode dynamics is subjected to stochastic turbulent forcing, which leads to a deviation from the Landau model in the vicinity of the bifurcation point. This is shown in figure 1, where measurements in a turbulent swirling flow reveal a continuous increase of the helical-mode amplitude at potentially subcritical conditions. This observation calls for stochastic methods to develop a dynamical system that explains the diffusion of the observed dynamics. Such a model differentiates between helical-mode activity due to an intrinsic flow instability and that due to turbulent forcing, providing a clear description of the dynamical flow state that enables the identification of the bifurcation point.
Bifurcation diagram for a supercritical Hopf bifurcation as described by the Landau equation. The solid line gives the limit cycle of the model and the dots indicate measurements from a turbulent flow.

The immediate approach to handle these stochastic contributions is the investigation of the amplitude equation with additive noise, and the estimation of equation parameters by inspection of the stationary PDF of measured amplitudes. This is also pursued in the present investigations as the first attempt. Therefore, an analytical expression for the stationary PDF is derived from the amplitude equation and calibrated from measured PDFs, as done in the investigations of Noiray & Schuermans (Reference Noiray and Schuermans2013), Bonciolini et al. (Reference Bonciolini, Boujo and Noiray2017) and Lee et al. (Reference Lee, Zhu, Li and Gupta2019).
For reasons of simplicity, the noise in the stochastic equation is usually assumed to be white, which is not the case for turbulent perturbations. This property is addressed in this work by the use of coloured noise created by an Ornstein–Uhlenbeck (OU) process (Hänggi & Jung Reference Hänggi and Jung1994). The effect of the noise properties on the accuracy of the system identification is assessed from a numerical model study, as done by Bonciolini et al. (Reference Bonciolini, Boujo and Noiray2017). Similar to their study, a sufficient separation of noise- and model-time-scales is found to be decisive for the reliability of the approach.
Furthermore, a mean-field model is incorporated in the dynamical system to capture the mean-field corrections related to the saturation of the instability on the limit cycle. This provides a deeper insight into the interaction between deterministic and stochastic dynamics. However, the system identification is adapted, since no analytical expression for the stationary PDF was obtained. The temporal change of the state variables is determined from the data, and the model equation is adjusted to replicate these. The approach depends on the selected processing parameters and might, therefore, be biased (Lehle & Peinke Reference Lehle and Peinke2018). This is in contrast to the amplitude equation, which can be solved analytically and compared to well-converged PDFs of the state variables, allowing an application to a large class of problems.
The remainder of this work is organised in the following way. In § 2 we outline the main experimental methods and the identification of coherent structures from the data. Furthermore, the dynamic content of the flow is presented from a decomposition of particle image velocimetry (PIV) and pressure measurements. In § 3, the stochastic amplitude equation and the corresponding system identification are described, followed by the validation of the approach based on a numerical study and the calibration of the model from the experimental data. Then, § 4 shows the stochastic mean-field model and its calibration from measurement data. Finally, the main findings are summarised in § 5.
2. Experimental details and observations of swirling jet dynamics
2.1. Experimental set-up and data acquisition
Experiments are conducted using a generic swirling jet set-up, shown schematically in figure 2, together with the measurement devices used. It consists of an adjustable radial swirl generator that is supplied at four azimuthal positions by regulated air from a pressure reservoir. Several grids ensure a homogeneous distribution of the supplied air. The swirling air is guided normally to the swirler plane in a circular duct of 150 mm diameter followed by a contoured contraction reducing the diameter to  $D=51\ \textrm {mm}$. The jet is emanating into a large space (4 m wide, 3 m high) that constitutes unconfined boundary conditions in radial and streamwise directions. Further details of the experimental set-up can be found in Rukes et al. (Reference Rukes, Sieber, Paschereit and Oberleithner2015) and Müller et al. (Reference Müller, Lückoff, Paredes, Theofilis and Oberleithner2020).
Schematic of the experimental set-up and the utilised measurement systems: HS PIV, high-speed particle image velocimetry; AMP, amplifier; DAQ, data acquisition system. The magnified picture of the flow field is an experimental smoke visualisation of the jet.

The jet is investigated at a fixed mass flow rate of 50 kg h $^{-1}$ that results in a nozzle bulk velocity of
 $u_{\textit{bulk}} = 5.7$ m s
 $^{-1}$ and a respective Reynolds number of 20 000 based on the nozzle diameter
 $D$. The swirl intensity is adjusted by an automated stepper motor that controls the angle of the swirler vanes. Swirl numbers in the range of 0.8 to 1.35 were tested. The current swirl-number definition is based on the linear fit of the integral swirl number against the angle of the swirler vanes. The reason for this approach is due to difficulties with a consistent formulation of the integral swirl number across the investigated swirl range, which is further detailed in Appendix A.
The velocity field of the swirling jet is captured by high-speed (HS) particle image velocimetry (PIV) as indicated in figure 2. A meridional section of the jet is illuminated by the laser and recorded by a high-speed camera. The flow is seeded by silicone-oil droplets (bis(2-ethylhexyl) sebacate; DEHS) of a nominal diameter smaller than 5 mm, which are added to the air between the mass flow controller and the swirler. For each configuration, a set of 2000 images was recorded at a rate of 1 kHz. The images were processed with PIVview (PIVTEC GmbH) using standard PIV processing (Willert & Gharib Reference Willert and Gharib1991) enhanced by iterative multigrid interrogation (Soria Reference Soria1996) and image deformation (Huang, Fiedler & Wang Reference Huang, Fiedler and Wang1993).
The HS PIV captured only the axial and radial velocity components, which is sufficient for the determination of coherent structures. The time resolution of the measurement, however, is essential for the later analysis. The computation of the swirl number, however, requires also the mean azimuthal velocity component. It was determined from non-time-resolved stereoscopic PIV measurements conducted in a previous investigation (Rukes et al. Reference Rukes, Sieber, Paschereit and Oberleithner2015).
Together with the PIV acquisition, pressure measurements were conducted. The probes are located at eight positions around the circumference of the nozzle lip, which are referred to in the following as  $p_k$ (
 $k=1,\dots ,8$). The piezoresistive sensors with a range of 1 kPa were amplified with an in-house bridge amplifier and recorded with a 24-bit analogue-to-digital converter at a rate of 2 kHz. The resonance frequency of the sensor tubing system was at 400 Hz, which is acceptable for the conducted investigations, where the oscillations of the dominant mode were in the range of 50–80 Hz. The resonance of the sensor caused an amplification of the signal by 2 % at 50 Hz and 4 % at 80 Hz. Other than the PIV, the pressure was recorded for 60 s to achieve converged statistics. Pressure measurements were conducted in an automated procedure, where the swirler angle was increased in steps of
 $0.1^{\circ }$ corresponding to
 ${\rm \Delta} S$ of
 $4\times 10^{-3}$.
2.2. Identification of coherent structures from measurement data
This section details how the helical mode is identified from the PIV and pressure data. The first part covers the extraction of the dominant coherent structures from the PIV data using spectral proper orthogonal decomposition (SPOD) as described by Sieber, Paschereit & Oberleithner (Reference Sieber, Paschereit and Oberleithner2016b). The method allows for a modal decomposition of the velocity snapshots, reading
 \begin{equation} \boldsymbol v(\boldsymbol x,t) = \bar{\boldsymbol v}(\boldsymbol x) + \boldsymbol v'(\boldsymbol x,t) = \bar{\boldsymbol v}(\boldsymbol x) + \sum_{i=1}^{N}{a_{i}(t)\varPhi_{i}(\boldsymbol x)}, \end{equation}
where the fluctuating part of the velocity field  $\boldsymbol v'$ is expressed as a sum of spatial modes
 $\varPhi$ and time coefficients
 $a$. The used variant of SPOD provides a time-domain representation of the decomposition, which is essential for the present analysis of flow dynamics. This is in contrast to a related frequency-domain representation (Towne, Schmidt & Colonius Reference Towne, Schmidt and Colonius2018), which is not applicable here.
SPOD has promising potential for the analysis of time-domain phenomena in turbulent flows (Noack et al. Reference Noack, Stankiewicz, Morzyński and Schmid2016). This has been shown for the identification of dynamics in the flow of a separated airfoil (Ribeiro & Wolf Reference Ribeiro and Wolf2017), the transient interaction and switching between different dynamics in a combustor (Stöhr et al. Reference Stöhr, Oberleithner, Sieber, Yin and Meier2018), or the provision of proper dynamics for the autonomous modelling of flow dynamics (Lui & Wolf Reference Lui and Wolf2019). The principal advantage of SPOD in these applications is that the dynamics are separated according to their space–time coherence while the time information is maintained, allowing the time-domain analysis of the individual dynamics.
SPOD is based on the snapshot POD proposed by Sirovich (Reference Sirovich1987), with the extension that the snapshot correlation matrix
 \begin{equation} {\mathsf{R}}_{i,j} = \frac{1}{N} \langle \boldsymbol v'(\boldsymbol x,t_i),\boldsymbol v'(\boldsymbol x,t_j) \rangle \end{equation}
is filtered, which constrains the spectral bandwidth of the coefficients (here  $\langle \cdot ,\cdot \rangle$ indicates the
 $L_2$ inner product; see also Sieber et al. (Reference Sieber, Paschereit and Oberleithner2016b)). The advantage of this approach against spectral filtering of data before or after performing POD is that the filtering is implicitly handled by the decomposition. Hence, there is no need to specify central frequencies of individual phenomena within the data or to apply digital filters. Instead, only the filter width
 $N_f$ must be chosen, as it sets the bandwidth of the coefficients. The filter is implemented as a simple convolution filter of the snapshot correlation matrix
 \begin{equation} {\mathsf{S}}_{i,j} = \sum_{k={-}N_f}^{N_f}{g_k {\mathsf{R}}_{i+k,j+k}}, \end{equation}
where  $g_k$ is a Gaussian filter kernel. Other than the snapshot POD, SPOD needs time-resolved data to allow time-domain filtering of the data. Further details on the selection of the filter size and handling of boundary conditions can be found in Sieber et al. (Reference Sieber, Paschereit and Oberleithner2016b) and Sieber, Paschereit & Oberleithner (Reference Sieber, Paschereit and Oberleithner2017). Beyond the application of the filter to the correlation matrix, the procedure is the same as for the snapshot POD. In the present investigation, a filter width
 $N_f$ of two times the oscillation period is used.
For further analysis, the link of mode pairs in the decomposition is identified from a cross-spectral correlation among all possible pairs of coefficients (harmonic correlation as in Sieber et al. (Reference Sieber, Paschereit and Oberleithner2016b)). The appearance of coherent structures as pairs is commonly observed in the POD of real-valued input data. It can be understood as the real and imaginary parts of a mode that is obtained from a spectral analysis. In the following, mode pairs (e.g. SPOD modes 1 and 2) are treated as one mode and they are coupled for the time-domain analysis as the real and imaginary parts of a complex coefficient,  $A(t) = a_1(t) + \textrm {i} a_2(t)$.
In the present application, the pressure measurements are used for the dynamic modelling since they allow much longer time series resulting in better-converged statistics than the PIV snapshots. The agreement of mode amplitudes determined from PIV and pressure measurements is detailed in Appendix B. To obtain the mode amplitude, the pressure measurements from the eight positions around the nozzle lip are decomposed azimuthally into Fourier modes, according to
 \begin{equation} \hat{p}_m(t) = \tfrac{1}{8}\sum_{k=1}^{8} p_k(t) \exp({-\textrm{i} m k {\rm \pi}/4 }) , \end{equation}
where  $m$ indicates the azimuthal mode number. The instantaneous amplitude of the helical mode with azimuthal wavenumber
 $m=1$ is then given as
 $A(t) =\hat {p}_1(t)$, accounting for the single-helical shape of this coherent structure. The signal was filtered around the average oscillation frequency of the helical mode
 $f_o$ in the band
 $[\frac {2}{3}\,f_o,\ \frac {3}{2}\,f_o]$. To set the centre of the filter band, the frequency of the mode was identified from the peak in the unfiltered spectrum and also compared to the frequency of the SPOD coefficients from the PIV measurements. In the low-swirl regime where no peak was visible, the frequency was extrapolated from larger swirl numbers.
In addition to the oscillatory mode, the dynamics of the slowly varying contributions to the flow are obtained from the pressure measurements. They are represented by the shift-mode that is determined from the  $m=0$ pressure mode:
 $B(t) = \hat {p}_0(t)$. Thereby, a relation between the mean flow and the mean pressure is assumed, which is supported by the data shown in Appendices A and B. The
 $\hat {p}_0$ signal is low-pass-filtered at
 $4f_o$ to remove acoustic perturbations from the upstream duct. All pressure signals are normalised by the maximum amplitude of the helical mode, this being 6 Pa, to ease the numerical procedures and improve the readability of graphs. The normalisation is not related to the dynamic pressure, which would be around 20 Pa in the present case.
2.3. Flow field and dominant coherent structures
The mean flow field and the structure of the global mode in the swirling jet are sketched in figure 3. Owing to vortex breakdown, the flow forms an annular jet with inner and outer shear layers. The global mode manifests in the central vortex of the jet that meanders and wraps around the breakdown bubble in a helical shape. The rollup of the outer shear layer is synchronised with this motion, resulting in a secondary helical vortex. These co-winding helical vortices cause a spiralling, flapping motion of the annular jet. With respect to the mean flow, the helical vortices are co-rotating and counter-winding. In the current section, the global mode is referred to as the helical mode, in contrast to secondary dynamics that is also observed in the data. The helical mode is considered as the oscillatory mode in the amplitude equation.
Schematics of the flow field of a swirling jet: (a) streamlines of the mean velocity field coloured by velocity magnitude; (b) slice through the symmetry axis of the mean velocity field represented by sectional streamlines and velocity magnitude as grey contour levels; and (c) instantaneous velocity field indicated by sectional streamlines and coherent structure as grey background. Specific features of the flow fields are marked and indicated in the legends. The breakdown bubble is indicated by the recirculating flow in the centre.

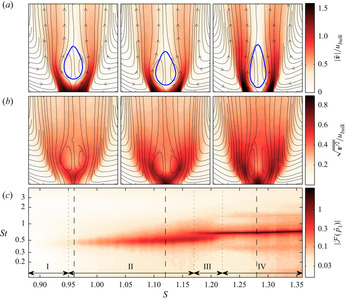
The velocity field and pressure spectra across the investigated swirl range are collectively presented in figure 4. The velocity is normalised with the bulk velocity and the frequency is normalised with the bulk velocity and nozzle diameter to obtain Strouhal numbers as  ${St} ={f_o D}/{u_{\textit{bulk}}}$.
Mean flow and spectrum of the dominant oscillatory mode at different swirl numbers. (a) Contours of relative velocity magnitude together with streamlines; the thick blue line indicates zero axial velocity. (b) The relative turbulence intensity as contours together with streamlines. (c) The magnitude of the spectrum of the pressure Fourier mode  $\hat {p}_1$ with a log scaled colour map for all investigated swirl numbers across the relevant Strouhal-number range. The dashed vertical lines indicate the respective swirl number (
 $S=[0.96,1.12,1.28]$) of the mean flow plots above. The arrows and vertical dotted lines indicate different regimes in the swirl-number range.

The mean velocity fields (figure 4a) show typical features of a swirling jet undergoing vortex breakdown as sketched in figure 3. From the low- to the medium-swirl-number case, there is only little change of the velocity field. The breakdown bubble mainly moves upstream closer to the nozzle in connection with an increased jet spreading. At large swirl number, the breakdown bubble becomes narrower and longer, while the jet spreading decreases.
The turbulence intensity (figure 4b) constantly increases with the swirl strength. The peak intensity is concentrated in the shear layers, while the value at the upstream stagnation point is always the largest. With increasing swirl, the shear layers become thicker and the fluctuations become spread over a larger area.
Several different regimes are visible from the spectrum of the helical mode (figure 4c). Starting from low swirl, there is a range where no oscillations are observed. At swirl numbers of approximately 0.95, there is a slight peak in the spectrum at Strouhal numbers around 0.5. With increasing swirl, the intensity of the peak increases as well as the frequency. Throughout the range, the spectral peak is rather broad. At a swirl number of 1.17, a second, narrow peak at slightly higher frequency appears, which continues to grow while the previous one fades out. After the first peak disappeared at a swirl number of 1.22, the second peak further grows and the frequency increases slightly. At the upper end of the range, the Strouhal number is at 0.73.
Based on the characteristics of the pressure spectra, the investigated swirl range can be divided into four regimes, as indicated in figure 4(c). Regime I corresponds to the swirl range where no helical-mode dynamics is observable. In regime II, the helical mode appears with a broad spectral peak and the mean flow shows a continuous change. Regime III corresponds to a bistable condition. It is characterised by intermittent switching between the states in regimes II and IV, which is visible from time-series data not shown here. Regime IV shows a similar trend as regime II, but with a sharper spectral peak and a longer breakdown bubble.
To provide an overview of the range of dynamics observed in the flow, SPOD is conducted based on flow snapshots acquired at three selected swirl numbers. The cases correspond to the mean velocity fields given in figure 4. The SPOD spectrum presented in figure 5 shows all modes contained in the flow. The detailed picture of spatial structures and coefficient spectra are given for some modes, which are selected such that a consistent ordering is obtained for the different swirl numbers.
SPOD spectrum (a,c,e) and spatial modes with mode coefficient spectrum (b,d,f) for  $S=[0.96,1.12,1.28]$ (from top row to bottom row). The spectrum shows mode energy against Strouhal number, where each dot corresponds to a mode pair and the colour/size indicate the spectral coherence. For selected modes, the spatial and spectral content is detailed as indicated by the numbers. The spatial modes are shown by the transverse velocity (cross-stream in-plane) together with streamlines of the mean flow. The mode coefficients are given as power spectral density.

Figure 5(a,b) shows the SPOD results for the low-swirl case  $S=0.96$, which corresponds to the onset of the helical mode. The first SPOD mode (#1) shows a clear peak at
 $St=0.4$ and the corresponding spatial structure shows typical characteristics of the helical mode (Rukes et al. Reference Rukes, Sieber, Paschereit and Oberleithner2015). Another dominant structure (mode #4) with low frequency (
 $St=0.05$) is also prominent. It corresponds to an axial movement of the breakdown bubble, as also observed previously by Rukes et al. (Reference Rukes, Sieber, Paschereit and Oberleithner2015). The other inspected modes (#2 and #3) do not indicate clear structures but might be precursors of the dynamics that become more pronounced at higher swirl numbers.
The medium-swirl case  $S=1.12$ (figure 5c,d) shows the helical mode again as the most dominant structure (mode #1). There is little change in the mode shape compared to the low-swirl case, but its relative energy increases significantly and it oscillates at a higher frequency of
 $St=0.5$. There exists another prominent coherent structure at
 $St=0.3$ (mode #2) that resembles a helical mode in the wake of the breakdown bubble, which has already been observed in combustor flows (Terhaar et al. Reference Terhaar, Reichel, Schrödinger, Rukes, Paschereit and Oberleithner2014; Sieber, Paschereit & Oberleithner Reference Sieber, Paschereit and Oberleithner2016a). The location in the wake and the single helical-mode structure indicates a strong relation to the global mode that is observed in laminar swirling flows, known as spiral vortex breakdown (Ruith et al. Reference Ruith, Chen, Meiburg and Maxworthy2003; Gallaire et al. Reference Gallaire, Ruith, Meiburg, Chomaz and Huerre2006; Qadri, Mistry & Juniper Reference Qadri, Mistry and Juniper2013). In the following, this structure is called the wake mode. At
 $St=0.8$ there is another mode that slightly sticks out from the continuous spectrum (mode #3). The spatial structure does not exhibit clear symmetries and the coefficient spectrum shows two peaks at
 $St=0.8$ and
 $St=1.0$. This mode supposedly represents the helical mode's second harmonic together with an interaction between the wake mode and the helical mode. The mode at very low frequency (mode #4) corresponds to the slowly varying changes of the flow, which is still considerable.
For the high-swirl case  $S=1.28$ (figure 5e,f), the mode dynamics is very clear and the low-frequency modes are reduced. The helical mode (#1) at
 $St=0.69$ has further gained in energy and now clearly exhibits higher harmonics at
 $St=1.38$ (mode #3) and
 $St=2.1$. The wake mode (#2) has consolidated at
 $St=0.36$ and also exhibits a higher harmonic at
 $St=0.77$ (mode #4). At the frequency of
 $St=1.05$, where interactions between helical mode and wake mode are expected, there is an agglomeration of less-dominant modes. This indicates an interaction between the two structures, which, however, is not captured by a single mode.
Overall, the SPOD of the flow shows only little change of the helical-mode shape with increasing swirl number. The observed increase in energy and the shift of the oscillation frequency are consistent with the pressure spectra (figure 4). The variations of the mean flow decrease with increasing swirl, which is probably due to the proximity of the breakdown bubble to the nozzle lip at high swirl, which constrains its movement. The SPOD reveals other modes, such as the wake mode and higher harmonics, but the helical mode is most dominant for the entire swirl range. The identified interaction modes remain weak with energies of at least one order of magnitude less than the helical mode. Therefore, the interaction between the helical mode and subdominant modes can be neglected in the following analysis.
3. Modelling and system identification by the amplitude equation
The dynamics of the helical mode is modelled by a stochastic amplitude equation. The corresponding model is derived at the beginning of the following section. This is followed by the consideration of coloured noise forcing and the derivation of the calibration procedure from data. Thereafter, the reliability of the model is investigated from a numerical study and the model is calibrated from experimental data.
3.1. Model design for the stochastic amplitude equation
The form of the presented model is based on the stochastic methods described by Friedrich et al. (Reference Friedrich, Peinke, Sahimi and Reza Rahimi Tabar2011). Accordingly, the stochastic differential equation that describes the temporal evolution of a system has the form of a Langevin equation,
 \begin{equation} \dot{X} = f(X) + g(X) \xi, \end{equation}
where the dot indicates the time derivative of the state  $X$. The deterministic contributions are collected in the drift
 $f$ and stochastic contributions are covered by the diffusion
 $g$. The stochastic forcing
 $\xi$ is Gaussian white noise with vanishing correlation time
 $\langle \xi (t)\xi (s) \rangle = \delta (t-s)$ (with
 $\delta$ being the Dirac delta function). The vanishing correlation, which was initially referred to as a Markov process, is essential for the later analysis of the equation.
The amplitude equation serves here as the simplest model to describe the dynamics of the helical mode and the leading-order nonlinearity that governs the saturation at the limit cycle (Stuart Reference Stuart1958; Landau & Lifshitz Reference Landau and Lifshitz1987). It is given as
 \begin{equation} \dot{A} = (\sigma + \textrm{i}\omega) A - \alpha |A|^2 A + \cdots, \end{equation}
where  $A$ is a complex-valued variable that describes the modal coefficient of a periodic perturbation of the flow field. The model parameters are the oscillation frequency
 $\omega$, the amplification rate
 $\sigma$ and the Landau constant
 $\alpha$. Here, no change of frequency due to saturation and no higher-order contributions are considered. A change of the frequency is generally associated with a complex-valued Landau constant, which is assumed to be real for the current investigations. This simplification is justified by the very weak change of the frequency observed in the measurements. Higher-order terms are neglected, since we expect a supercritical Hopf bifurcation, as previously observed by Oberleithner et al. (Reference Oberleithner, Sieber, Nayeri, Paschereit, Petz, Hege, Noack and Wygnanski2011), rather than a subcritical bifurcation, which would require a higher-order model (Meliga, Gallaire & Chomaz Reference Meliga, Gallaire and Chomaz2012a). However, as will be shown, the amplitude equation with cubic saturation remains an approximation of the nonlinearities in the vicinity of the bifurcation point occurring in this flow. In the following, the regime of model applicability will be stretched quite far beyond the bifurcation point to investigate the bounds of this regime.
For the stochastic flow model, noise is added to the amplitude equation (3.2), reading
 \begin{equation} \dot{A} = (\sigma + \textrm{i}\omega) A - \alpha |A|^2 A + \xi, \end{equation}
where the noise is complex,  $\xi = \xi _r + \textrm {i} \xi _i$, with uncorrelated real and imaginary parts, i.e.
 $\langle \xi _{r}\xi _{i} \rangle =0$. The noise has zero mean and the variance
 $\varGamma = \overline {\xi \xi ^*}$ (where
 $^*$ indicates the complex conjugate). A complex-valued noise is necessary to maintain the symmetry of the equation.
The representation of the mode coefficient as amplitude and phase,  $A = |A| \ \textrm {e}^{\textrm {i}\phi }$, allows one to separate the unperturbed amplitude equation (3.2) into two simple real-valued equations reading
 \begin{equation} |\dot{A}| = \sigma|A| - \alpha |A|^3, \quad \dot{\phi} = \omega. \end{equation}
The amplitude and phase are regarded as slow and fast variables, meaning that  $|\sigma | \ll |\omega |$. In combination with the amplitude and phase representation, this allows stochastic averaging over the fast variables of the stochastic equation (3.3) (Roberts & Spanos Reference Roberts and Spanos1986), which gives
 \begin{gather} |\dot{A}| = \sigma |A| - \alpha |A|^3 + \frac{\varGamma}{|A|} + \xi_{A}, \end{gather}
 \begin{gather}\dot{\phi} = \omega + \frac{\xi_{\phi}}{|A|} . \end{gather}
The conversion results in different contributions of the noise to the amplitude and phase ( $\xi _{A}$ and
 $\xi _{\phi }$) as indicated by the subscripts. These noise contributions are real-valued, uncorrelated, i.e.
 $\langle \xi _{A}\xi _{\phi } \rangle =0$, and have half the variance of the complex perturbation, i.e.
 $\langle \xi _{A},\xi _{A} \rangle = \langle \xi _{\phi },\xi _{\phi } \rangle =\varGamma /2$.
The stochastic averaging of the equation refers to a short-term integration of the stochastic contributions that is analogous to previous approaches (Noiray Reference Noiray2017; Lee et al. Reference Lee, Zhu, Li and Gupta2019), where the Van der Pol oscillator instead of the amplitude equation was considered. The Van der Pol oscillator has an equivalent amplitude and phase representation as (3.5) and (3.6), which makes the approaches comparable. The only difference in the present approach is the use of complex noise that maintains the symmetry of the equation even for large amplitudes and strong noise. Further details on the relationship between the two equations are given in Appendix C.
The change of variables separates the model into two equations. The amplitude equation (3.5) is independent of the phase, describing the exponential amplification and saturation mechanism of the oscillatory mode. In the unperturbed case (3.4a,b), the sign of the amplification rate  $\sigma$ determines whether the oscillations occur or not. However, the additional deterministic contribution
 ${\varGamma }/{|A|}$ in the stochastic amplitude equation (3.5) prevents the oscillator from decaying to zero amplitude even for negative amplification rates. In addition to the new deterministic contribution, the additive stochastic perturbation remains in the amplitude equation. Considering the phase equation (3.6), the stochastic forcing causes the phase to be dependent not only on the frequency but also on parametric perturbations that scale inversely with the amplitude. Therefore, the stochastic forcing couples the phase to the amplitude equation.
To estimate the noise intensity from experimental data, the phase equation (3.6) is rearranged to
 \begin{equation} \xi_{\phi,\textit{est}} = |A| (\dot{\phi} - \omega ), \end{equation}
which can be used to estimate the noise intensity using
 \begin{equation} \frac{\varGamma_\textit{est}}{2} = \langle \xi_{\phi,\textit{est}},\xi_{\phi,\textit{est}} \rangle . \end{equation}
The extraction of the remaining parameters from the amplitude equation is detailed in the subsequent section.
3.2. Stochastic perturbations with coloured noise
The application of stochastic methods requires the noise to be white (uncorrelated) to obtain a Langevin equation. However, the noise may have a short correlation time, which makes the stochastic forcing coloured instead of white noise. This is reasonable as long as the time scales of the deterministic and stochastic dynamics are well separated (Hänggi & Jung Reference Hänggi and Jung1994). A simple type of coloured noise is obtained from an OU process, which has the autocorrelation
 \begin{equation} \langle \xi(t),\xi(s) \rangle = \frac{D}{\tau}\exp({-|t-s|/\tau}) \end{equation}
and is created from a basic stochastic process as
 \begin{equation} \dot{\xi} ={-} \frac{1}{\tau} \xi + \frac{\sqrt{D}}{\tau} \xi_{w}. \end{equation}
In the above equations,  $\xi$ denotes the noise created from the OU process with time scale
 $\tau$ and intensity
 $D$. The variable
 $\xi _{w}$ denotes a white noise process with a variance of one that drives the OU process. To incorporate the coloured noise into the stochastic flow model, the specific correlation (3.9) is included in the stochastic averaging of the amplitude equation (Bonciolini et al. Reference Bonciolini, Boujo and Noiray2017; Noiray Reference Noiray2017). Accordingly, it is sufficient to replace the noise intensity in (3.5) by an effective noise intensity
 \begin{equation} \varGamma_{\tau} = \frac{2D}{\tau^2\omega^2+1} = \frac{2 \tau \langle \xi,\xi \rangle}{\tau^2\omega^2+1}, \end{equation}
which is equivalent to the power spectrum of the OU noise at the oscillator frequency  $\omega$. Note that the factor 2 in the equation results from the two noise components in the complex-valued forcing.
The time scale and intensity of the stochastic forcing were estimated from the empirical relation
 \begin{equation} \langle \xi_\phi(t),\xi_\phi(s) \rangle \approx \frac{D}{2\tau} \exp({|t-s|/\tau}) \cos(\omega (t-s)), \end{equation}
which is obtained by comparing the autocorrelation of the phase distortion (3.7) from a simulated model with coloured noise to the analytical correlation (3.9). By adding the cosine factor to the analytical correlation of the OU process, good agreement with the simulation is obtained (see figure 7). The obtained correlation (3.12) can be interpreted such that the cosine term accounts for the different coordinates in which the noise is represented. The noise adds to the amplitude equation as uncorrelated real and imaginary parts in a fixed coordinate system, whereas the phase distortion is considered in the rotating coordinates of the oscillator. Since the added noise is correlated in time, the rotation of the coordinate system in time must be accounted for in the correlation.
The procedure outlined here, using an effective noise and the estimation of the noise properties from the phase distortion, is only strictly valid for noise time scales that are smaller than the oscillator time scale and for small noise amplitudes. This limit of applicability is further investigated in § 3.4.
3.3. System identification from stationary probability density functions
The method presented here is used to estimate the parameters of the amplitude equation by inspecting the stationary PDF of measured amplitudes. An analytical expression for the stationary PDF is derived from the amplitude equation (3.5) through the corresponding Fokker–Planck equation. Therefore, the amplitude equation is brought in the form of the Langevin equation (3.1), where the corresponding drift and diffusion terms are
 \begin{gather} f(|A|) = |A| (\sigma - \alpha |A|^2 ) + \frac{\varGamma}{|A|}, \end{gather}
 \begin{gather}g(|A|) = \sqrt{\varGamma/2}, \end{gather}
respectively. The assumption of a Markov process allows one to describe the temporal evolution of the PDF of the magnitude  $|A|$ by the Fokker–Planck equation (Friedrich et al. Reference Friedrich, Peinke, Sahimi and Reza Rahimi Tabar2011),
 \begin{equation} \frac{\partial}{\partial t}P(|A|,t) ={-}\frac{\partial}{\partial |A|} (\,f(|A|) P(|A|,t) ) + \frac{1}{2} \frac{\partial^2}{\partial|A|^2} ( g^2(|A|) P(|A|,t) ), \end{equation}
where  $P$ refers to the PDF. This eliminates the stochastic variable and gives a probabilistic description of the system, which can be compared to statistical moments obtained from measured data.
In order to identify the model parameters, a stationary solution of the Fokker–Planck equation  $({\partial }/{\partial t})P(|A|,t) = 0$ has to be found. Following the derivations of Noiray (Reference Noiray2017), the stationary Fokker–Planck equation with vanishing PDF at infinite amplitudes and constant diffusion
 $g$ simplifies to
 \begin{equation} \frac{\mathrm{d}}{\mathrm{d} |A|}P(|A|) - \frac{2}{g^2}\,f(|A|) P(|A|) = 0. \end{equation}
The corresponding solution is obtained by writing the drift coefficient in a potential form, reading
 \begin{equation} f(|A|) ={-}\frac{\partial\mathcal{V}(|A|)}{\partial |A|}\quad \mathrm{with}\ \mathcal{V}(|A|) ={-}\frac{\sigma}{2}|A|^2 + \frac{\alpha}{4}|A|^4 -\varGamma\ln{|A|}, \end{equation}
which gives
 \begin{equation} P(|A|) = \mathcal{N}\exp\left(-\frac{4}{\varGamma}\mathcal{V}(|A|)\right). \end{equation}
The scale parameter  $\mathcal {N}$ is chosen to normalise the PDF such that
 $\int _0^\infty P(|A|)\,\mathrm {d}|A| = 1$. The expression contains a mixture of stochastic and deterministic parameters that are identified from different measures.
The strategy for the presented analysis is the following. We use a generic model of the PDF,
 \begin{equation} P_\textit{mod}(|A|) = \mathcal{N} |A| \exp (c_1 |A|^2 + c_2 |A|^4 ), \end{equation}
with the parameters  $c_1$ and
 $c_2$. It is fitted to the experimental PDF
 $P_\textit{exp}$ using the Kulback–Leibler divergence
 \begin{equation} D_\textit{KL} = \int_0^\infty {P_\textit{exp}(|A|) \log\left(\frac{P_\textit{exp}(|A|)}{P_\textit{mod}(|A|)}\right)}\,\mathrm{d}|A|\end{equation}
as similarity measure. The divergence  $D_\textit{KL}$ is minimised using common numerical procedures. The effective noise intensity
 $\varGamma _\tau$ is obtained from the procedure described in § 3.2. Together with the fitting parameters of the model PDF, this provides the physical model parameters
 \begin{equation} \sigma = \frac{c_1\varGamma_\tau}{2} \quad \mathrm{and}\quad \alpha ={-}c_2 \varGamma_\tau , \end{equation}
where the estimation of the amplification rate  $\sigma$ is most important for the interpretation of the flow state. Furthermore, the divergence
 $D_\textit{KL}$ is used to measure if the model fails to approximate the measured dynamics.
For illustrative purposes, figure 6 shows a characteristic time series of an unstable system ( $\sigma >0$) and a stable system (
 $\sigma <0$) that are both subjected to stochastic forcing. The signal was generated by numerical integration of the forced amplitude equation (3.3). The unstable system is initialised at
 $A=0$ and quickly approaches the limit cycle. Owing to the stochastic forcing, it never settles at the limit cycle. The stationary PDF of the amplitude quantifies the disturbance of the flow state around the limit cycle. The distribution reflects the balance between the stabilising drift that pushes the system to the limit cycle and the destabilising stochastic forcing. This is the same for the stable system, with the difference that the deterministic dynamics of the system tends to zero amplitude but gets continuously excited by the stochastic forcing. The estimation of the model parameters from the stationary PDF and the phase distortion allows one to quantify the balance between these forces and provides estimates of physical amplification rates.
Exemplary time series of the simulated stochastic amplitude equation (3.3) for an unstable system (a) and a stable system (b). The blue line shows the real part of  $A$ and the red line gives the corresponding magnitude
 $|A|$. The bar blots on the right show the stationary PDF of the magnitude. The models are simulated with white noise, and the ratio
 $\omega /\sigma$ is 10 for the unstable and
 $-$10 for the stable case.

3.4. Numerical study of the amplitude equation with coloured noise
The numerical study aims to validate the assumptions made during the derivation of the analytical procedure in §§ 3.1 to 3.3. Especially, the stochastic averaging (3.5) and the estimation of the noise properties (3.12) need to be validated for coloured noise. Therefore, the original complex-valued equation (3.3) is numerically integrated in time with coloured noise from an OU process (3.10). The OU process is integrated with a second-order Runge–Kutta scheme for stochastic equations (Tocino & Ardanuy Reference Tocino and Ardanuy2002). The amplitude equation is integrated with a fourth-order Runge–Kutta scheme with fixed time steps corresponding to 100 steps per oscillation period. The coloured noise is simulated with twice the temporal resolution to allow the Runge–Kutta scheme to be evaluated for intermediate time steps. In the cases with white noise forcing, the amplitude equation is simulated like the OU process. The amplitude equation is simulated for a range of amplification rates  $\sigma = -1, \ldots , 1\ \textrm {s}^{-1}$, noise time scales
 $\tau = 0, \ldots , 1\ \textrm {s}$ and effective noise intensities
 $\varGamma _{\tau } = 0.01, \ldots , 1$. The frequency is kept constant at
 $f_o=10$ Hz as well as the Landau constant
 $\alpha =1$. The parameters of the amplitude equation are identified according to (3.21a,b) and the effective noise intensity according to (3.11) and (3.12).
The fit of the model to the simulation data is exemplified in figure 7 for selected cases. The selection shows an unstable system for different noise time scales but the same effective noise intensity. In figure 7(a), the autocorrelation of the phase distortion is shown. Accordingly, the estimation of the noise parameters from the decay of the correlation envelope works well for small and intermediate noise time scales but deviates for the large noise time scale. Figure 7(b) shows the simulated, estimated and analytically derived amplitude PDFs. Since all presented simulations have the same effective noise intensity and model parameters, the analytic PDF must be the same for all cases (see (3.12)). For the small noise time scale ( $\tau =0.01$), all shown PDFs agree very well. For the moderate noise time scale (
 $\tau =0.1$), the analytical and simulated PDFs deviate slightly. Note that the noise time scale here is of the same order as the oscillation frequency. Therefore, the assumed separation of time scales is no longer met, but, nevertheless, the deviations stay small. The long noise time scale (
 $\tau =1$) causes significant deviations of the expected and simulated PDFs. Furthermore, the shape of the PDF is not correctly captured by the analytical model, indicating the need for higher-order approximations.
Selected simulation results of the numerical study at  $\sigma =0.5$,
 $\varGamma _{\tau } = 0.1$ and
 $\tau = [0.01,0.1,1]$, as indicated in the top-right corner. (a) The noise correlation from the simulation, as well as the estimated and analytical decay (plots are normalised by the value at zero shift
 $t=s$). The blue dots indicate the local maxima which are used to estimate the decay. (b) The PDF of the envelope calculated from the simulation, the estimated fit to the simulation results and the expected analytical PDF.

The estimated amplification rates and effective noise intensities for all simulated cases are presented in figure 8. The estimated amplification rate is displayed against the rate used in the simulation. For a perfect estimation, the graph displays a straight diagonal, which is the case for the simulation with white noise ( $\tau =0$). For
 $\tau = 0.01$ and
 $\tau = 0.1$, the relative deviations stay below 10 %; while for
 $\tau = 1$, the deviations exceed this limit. The source of the error is either an inaccurate fit of the PDF with the model (3.19) or an inaccurate estimation of the noise properties from the empirical correlation function (3.12). To differentiate between these two error sources, the estimates are also shown based on the true noise intensity. Accordingly, the errors from both sources are of the same order of magnitude. For the cases with
 $\tau \le 0.1$, the error generally only changes the slope of the amplification curve, and the bifurcation point (zero crossing) is accurately captured. With increasing noise time scales, the absolute rate becomes increasingly underpredicted, as seen from the decreasing slope. The estimation for
 $\tau = 1$ strongly deviates for the PDF fit as well as for the noise estimation. Hence, the model is not able to cover cases with noise time scales larger than the oscillation period
 $\tau > 1/f_o$.
Estimates of the model coefficients from the simulation data at  $\varGamma _{\tau } = 0.1$ and different noise time scales indicated in the legend. (a) The estimated against the true amplification rate. The solid curves show results with estimated
 $\varGamma _{\tau }$ and the dashed lines those with true
 $\varGamma _{\tau } = 0.1$. (b) The corresponding estimation of the effective noise intensity from data.

The numerical study shows that the model and the simplifications made in the deviations are valid as long as the noise time scale stays below the oscillatory time scale. Surprisingly, there is no need for a large separation of time scales if small deviations are acceptable. A perfect agreement, however, is only possible for purely white noise.
3.5. Parameter estimation of the amplitude equation from experiments
This section shows the results from the application of the procedure outlined in §§ 3.1 to 3.3 to the oscillatory mode measured from the pressure Fourier modes (2.4). An overview of the measured PDFs is given in figure 9 and the estimated model parameters are presented in figure 10.
Analysis of the amplitude statistics derived from pressure measurement. (a) The PDF of the envelope  $P(|A|)$ as contours for different swirl numbers. (b) Bar plots of the measurement data together with the best fit of the theoretical PDF as a red line. These plots correspond to sections of the contour plot above, where the corresponding positions are marked as dashed lines. The arrows and vertical dotted lines indicate different regimes in the swirl-number range.

Estimated model parameters against the swirl number obtained from pressure measurements. (a) The amplification rate; the inset is a vertical zoom into the region around zero. (b) The oscillation frequency  $f_o$ together with the noise time scale
 $\tau$. (c) The divergence (3.20) between the measured and the theoretical PDF (see figure 9). The arrows and vertical dotted lines indicate different regimes in the swirl-number range.

The amplitude PDFs presented in figure 9 show a continuous transition from narrow to wider distributions. A qualitative change can be observed in regime III, where the bistability of the mean flow occurs. The analytical model fits the observed PDF adequately, and larger deviations are only visible in the bistable regime. The gradual change of the PDF and the mean amplitude does not indicate a bifurcation point from this representation.
Figure 10 displays the estimated amplification rate (a), the estimated noise time scale (b) and the deviation of the PDF fit (c) quantified with the Kulback–Leibler divergence. Going through the graphs from low to high swirl, the amplification rate shows first a strong increase from largely negative values up to zero. After the bifurcation at  $S=1.1$, the estimated rates stay positive but the curve flattens and stays close to zero before there is a sudden increase in regime III. The noise time scale is always smaller than the oscillation time scale except for regime III. Similarly, a high divergence is observed in this regime, indicating a poor fit quality, whereas the divergence is low for all other swirl intensities. The overall divergence level is lowest in the stable regime and increases a little at
 $S=1.05$. Overall, the presented model parameters give a clear indication of the bifurcation point and also provide a quantification of the reliability of the estimation.
The estimation results in the bistable regime of the flow appear not to be reliable. This is primarily due to the stochastic switching between the two flow states, which creates low-frequency perturbations of the oscillatory mode that are outside of the model's valid parameter range. This is distinctly indicated by the noise time scale, which becomes larger than the oscillation time scale (figure 10b). The divergence consistently shows the failure of the model in that range. However, the estimated amplification rate does not show large outliers in that region but rather a continuous trend between the two neighbouring regions.
The plateau of the amplification rate at swirl levels slightly above the bifurcation point may be due to the following reasons. Either the decreasing noise time scale causes an underprediction of the estimation, in confirmation with the model study (§ 3.4), or the one-dimensional (1-D) dynamical model oversimplifies the underlying system dynamics at this flow regime. The latter will be addressed in the following section. The entire set of model parameters for the investigated swirl-number range is presented in Appendix D.
4. Modelling and system identification by the mean-field model
4.1. Model design and calibration procedure
In the model described in the previous section, the dynamics of the oscillatory mode is assumed to be independent of other state variables of the flow. However, the interaction of the oscillatory mode with the mean flow might take some time, such that there is a delayed saturation of the amplitude equation. This is further evaluated from an inspection of the mean-flow changes given by the shift-mode, which is referenced by the mode coefficient  $B$. The coupled dynamics of the oscillatory mode
 $A$ and the shift-mode
 $B$ is described by the mean-field model (Noack et al. Reference Noack, Afanasiev, Morzyński, Tadmor and Thiele2003; Luchtenburg et al. Reference Luchtenburg, Günther, Noack, King and Tadmor2009), which is given as
 \begin{gather} \dot{A} = (\sigma + \textrm{i}\omega ) A - \beta(B-B_0)A, \end{gather}
 \begin{gather}\dot{B} ={-}\frac{1}{\tau_B} (B - B_0 - \gamma|A|^2 ), \end{gather}
in the present nomenclature. The dynamics of the oscillatory mode  $A$ is very similar to the amplitude equation (3.2), but the saturation
 $\alpha |A|^2$ is exchanged by the feedback from the shift-mode,
 $\beta (B-B_0)$. The change of the shift-mode
 $B$ is driven by the Reynolds stresses induced by the oscillatory mode
 $\gamma |A|^2$. If there is no oscillatory mode, the mean flow restores to the fixed point
 $B_0$, commonly called the base flow. The rate of return to the fixed point is given by the time constant
 $\tau _B$. At the limit of an infinitely short time constant, the shift-mode is slaved to the oscillatory mode as
 $(B-B_0) = \gamma |A|^2$, and the amplitude equation (3.2) is obtained again, with the Landau constant being
 $\alpha =\beta \gamma$.
In the present investigation, the mean-field model is adapted to capture the dynamics observed in the experimental data. This results in the following model, where the dimension is reduced similar to the amplitude equation (3.4a,b) by changing variables to the phase–magnitude representation and retaining only the magnitude, yielding
 \begin{gather} |\dot{A}| = (\sigma - \alpha |A|^2 - \beta(B-B_0) )|A| + \frac{\varGamma}{|A|}, \end{gather}
 \begin{gather}\dot{B} ={-}\frac{1}{\tau_B} ( B - B_0 - \gamma |A|^2 ), \end{gather}
which describes the evolution of the oscillation magnitude  $|A|$ and the shift-mode
 $B$.
The amplitude equation in the adapted mean-field model (4.3) covers two saturation mechanisms. The first is called ‘direct saturation’ and is represented by the quadratic term  $\alpha |A|^2$, which is equivalent to the representation in the amplitude equation (3.2). The second is called ‘delayed saturation’ and is represented by the shift-mode term
 $\beta (B-B_0)$ introduced in the basic mean-field model (4.1). The inclusion of both mechanisms is necessary to capture the dynamics observed in the data, which is discussed in the following section.
The parameters  $\alpha$,
 $\beta$ and
 $\gamma$ in (4.3) and (4.4) are positive, which implies only negative feedback. In other words, an increasing amplitude shifts the mean flow to a state that causes less amplitude growth and vice versa. The fixed points of the system of equations lie on an inertial manifold called the mean-field paraboloid, given by
 $\gamma |A|^2 = B - B_0$ (Noack et al. Reference Noack, Afanasiev, Morzyński, Tadmor and Thiele2003). This is an attracting manifold where the mean-flow state corresponds to the Reynolds stresses induced by the limit-cycle oscillations of the system.
The current mean-field model (4.3) is further adapted by the inclusion of the drift term from the amplitude equation (3.5) that results from the additive noise, reading  ${\varGamma }/{|A|}$. This empirical adaptation considers the effect of an additive noise that is not explicitly modelled for the mean-field model. The actual addition of a stochastic forcing would need another independent noise term for the shift-mode and an extensive stochastic averaging to reduce the system to the two slow variables, the magnitude of the oscillatory mode and the shift-mode. Furthermore, there is most probably no simple analytical form for this two-dimensional (2-D) system, which would require a numerical solution of the Fokker–Planck equation (Friedrich et al. Reference Friedrich, Peinke, Sahimi and Reza Rahimi Tabar2011).
To overcome these difficulties, a different approach is pursued that extracts the deterministic drift directly from the statistical moments of the measured data. Therefore, the mean-field model needs to cover only the deterministic dynamics and no stochastic forcing. The drift is identified from a conditional average of the observed state  $X$ of the stochastic process (Friedrich et al. Reference Friedrich, Siegert, Peinke, St. Lück, Lindemann, Raethjen, Deuschl and Pfister2000), reading
 \begin{equation} \tilde{f}(X_k) = \lim_{{\rm \Delta} t \rightarrow 0} \frac{1}{{\rm \Delta} t} \langle X(t+{\rm \Delta} t) - X(t) \rangle|_{X(t) = X_k} , \end{equation}
where  $\langle {~}\rangle$ indicates the averaging operation. The function
 $\tilde {f}(X)$ is an estimate of the drift function that drives the process as given by the Langevin equation (3.1). In the present case, the system state is
 $X = [|A|,B]^\textrm {T}$ and the drift function
 $\dot {X} = f(X)$ is (4.3) and (4.4). The conditional average in (4.5) considers the mean drift of all trajectories that passed through a certain point in state space
 $X_k$, where the drift is approximated by a forward-time finite difference. The limit in (4.5) is only valid for strictly white noise, which is often not given for experimental data (Lehle & Peinke Reference Lehle and Peinke2018) and generally not for turbulent perturbations. Therefore, a fixed interval of one oscillation period was chosen to estimate the drift of the slow variables. Neglecting the limit causes an inaccurate prediction of the drift, but relative differences and trends are still captured. Accordingly, the analysis of the mean-field model constitutes a qualitative study of the relation between oscillatory mode and shift-mode. Therefore, the results are not directly compared to the investigations with the amplitude equation in § 3, and the accuracy of the mean-field model is not studied in detail.
The evaluation of the conditional average in (4.5) requires the subdivision of the state space  $X = [|A|,B]^\textrm {T}$ into bins. For this purpose, data-based
 $k$-means clustering of the state space is pursued. This approach has been shown to be very effective for a statistical description of fluid dynamics (Kaiser et al. Reference Kaiser, Noack, Cordier, Spohn, Segond, Abel, Daviller, Östh, Krajnović and Niven2014). The drift, determined for each cluster centre
 $X_k$, is fitted to the model (4.3) and (4.4) by tuning the parameters to minimise
 $\sum _k{(\,\tilde {f}(X_k)-f(X_k))^2}$. A consistent calibration of the parameter
 $\varGamma$ from the estimated drift function turned out to be ineffective, because in unstable cases it was difficult to distinguish between noise-induced and linearly amplified oscillations. To make the estimation of the noise-induced drift more robust, the parameter
 $\varGamma$ is determined from the phase distortion (3.8) and scaled with a constant factor
 $c_{\textit{scale}}$ to adapt it to the drift function. This relation reads as
 $\varGamma = c_{\textit{scale}} \langle \xi _{\phi ,\textit{est}},\xi _{\phi ,\textit{est}} \rangle$, where the factor
 $c_{\textit{scale}}$ is calibrated to minimise the global sum of squared differences for all investigated swirl numbers.
4.2. Parameter estimation of the mean-field model from experimental data
The parameters of the stochastic mean-field model (4.3) and (4.4) are determined from the drift coefficients estimated from the pressure measurements of the flow, according to the procedure outlined in § 4.1. The pressure data are processed as described in § 2.2 to obtain the magnitude of the oscillatory mode  $|A|$ and the shift-mode
 $B$. The data are scaled to equal variance to obtain clusters from
 $k$-means clustering with 100 centres. Throughout the processing, the clusters have an average of 1500 elements and an absolute minimum of 24 elements.
The drift coefficients estimated for each cluster centre and the fitted mean-field model are displayed in figure 11. The model shows the attraction of the flow to a central point to which the drift vectors are directed. Although this is technically a limit cycle, the central point appears as a fixed point in this representation and is, therefore, referred to here as a fixed point. Furthermore, the representation shows the mean-field paraboloid, which appears as a bent region with low drift magnitudes. The model shows some deviations from the measurement data, especially at states far away from the fixed point. However, the general trend is very accurately captured. The three displayed cases correspond to the stable and the two unstable regimes. Despite their different dynamic states, the models show very similar dynamics in state space. The main change in the drift field is due to the increase of the limit-cycle amplitude and the corresponding movement of the fixed point in state space to larger amplitudes  $|A|$. A specific characteristic of the present model is visible from the horizontal approach towards the fixed point. Especially for the intermediate case (figure 11b), there is an upward trend on the left side and a downward trend on the right side. This indicates the dependence of the oscillatory mode drift on the shift-mode. Otherwise, there would be horizontal drift lines at the limit-cycle amplitude. The general agreement of the observed and modelled dynamics is also a validation of the empirical mean-field model. The model is designed such that it covers the shown dynamics by combining elements from the stochastic amplitude equation and a basic mean-field model. Therefore, it indicates the dynamics that is relevant for the observed flow.
Fits of the stochastic mean-field model (4.3) and (4.4) to the estimated drift coefficients (4.5). Fields for  $S=[0.96,1.12,1.28]$ are depicted from (
 $a$) to (
 $c$). Black arrows indicate the estimated coefficients and red arrows show the model coefficient at the same point. The streamlines and the contour in the background show the global picture of the model drift direction and magnitude, respectively (drift
 $f(X)=\dot {X}$ with
 $X = [|A|,B]^\textrm {T}$).

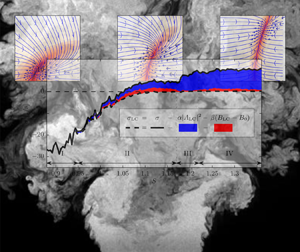
Figure 12 shows the estimated amplification rate obtained from the calibration of the mean-field model. The graph gives the linear amplification rate similar to figure 9, and further details which mechanism in the model leads to the saturation at the limit cycle. The coloured areas indicate different contributions to the saturation of the amplification rate at the limit cycle as given in (4.3). Accordingly, the effective amplification rate at the limit cycle is given by
 \begin{equation} \sigma_{{\textit{LC}}} = \sigma - \alpha |A_{\textit{LC}}|^2 - \beta (B_{\textit{LC}}-B_0), \end{equation}
where the subscript LC refers to a specific amplitude at the limit cycle. The two contributions that lead to the reduction of the initial linear amplification rate  $\sigma$ to the amplification rate at the limit cycle
 $\sigma _{{\textit{LC}}}$ are shown. The differences due to the direct saturation
 $\alpha |A_{\textit{LC}}|^2$ and the delayed saturation
 $\beta (B_{\textit{LC}}-B_0)$ are indicated on the graph. In contrast to the estimates from the amplitude equation (figure 10), which showed a bifurcation at
 $S=1.1$, the mean-field model shows a bifurcation of the flow at
 $S=1.05$. Figure 12 further shows that the delayed saturation is much more relevant in regime II. In regime IV, the main contribution comes from the direct saturation term in the model. For the larger swirl numbers, the two saturation mechanisms always add up to neutral stability at the limit cycle (
 $\sigma _{\textit{LC}}\approx 0$). Furthermore, the magnitude of the linear amplification rate
 $\sigma$ in regime II goes clearly above the zero line, in contrast to the previous estimation from the amplitude equation (figure 10). This is more consistent with the continuous increase of the limit-cycle amplitude observed in figure 9.
Estimated model parameters from pressure measurements using the mean-field model. The coloured areas indicate different contributions to the saturation of the amplification rate in (4.6). The arrows and vertical dotted lines indicate different regimes in the swirl-number range.

The agreement of the observed and modelled drift coefficients, as well as the consistent description of the flow physics, suggest a more reliable description of the bifurcation by the mean-field model than the amplitude equation. Especially at the bifurcation point, the secondary dynamics from the shift-mode contribute significantly to the dynamics of the oscillatory mode, which causes the deviation from the simpler approach based on the amplitude equation.
4.3. Insights from the description of the flow by the mean-field model
The parameters estimated from the 2-D mean-field model (4.3) and (4.4) allow an accurate description of the dominant flow dynamics consistent with the 1-D amplitude equation (3.5). The 2-D model, however, differs in two main points: (i) the identified bifurcation point and (ii) the growth rates for swirl numbers closely beyond the bifurcation point. The 2-D model reveals that the interaction of the shift-mode and the oscillatory mode in this regime is of great importance, which is not covered by the 1-D model. Hence, neglecting the shift-mode and describing the system solely based on the amplitude makes it a non-Markovian process, which cannot be covered by the proposed Langevin equation. The unresolved dynamics between the shift-mode and oscillatory mode causes the additive noise to be correlated with the dynamics, which violates the basic assumptions.
The pressure-sensor-based estimation of the mode amplitude does not provide an exact reproduction of the helical-mode amplitude as obtained from the PIV measurements. The pressure-based estimation is contaminated by the streamwise movement of the breakdown bubble position, which is connected to the shift-mode amplitude. This interaction is further investigated in Appendix B, where it is shown that a part of the amplitude variations might be attributed to a modulation by the shift-mode. However, it is not entirely clear if this results from a delay between the local pressure-based estimate and the global determination from PIV, or if it is simply an amplitude modulation. Consequently, it is possible that the delayed saturation in the model is caused not by flow dynamics but by the measurement principle. Nevertheless, incorporating this additional influence in the model allows one to describe the correlated dynamics in the data and brings the model in line with the correlations of the measured dynamics.
The results from the calibration of the mean-field model provide a deeper understanding of the dynamics governing the swirling flow. The corresponding properties of the flow model are summarised in figure 13(a). Two distinct flow states can be derived from the model: (i) the base flow, which constitutes the quasi-stationary state of the flow before the onset of the instability; and (ii) the mean flow, which is the mean velocity field corresponding to the instability oscillating at the limit cycle. The base flow is a state that is rarely reached in unstable conditions due to the unavoidable external perturbations from turbulence and instabilities. It can only be obtained artificially through active flow control or from transient investigations of the flow. The unique feature of the current approach is that one can make statements about the stationary base flow state, although one considers only fluctuations around the mean flow state.
(a) Reduced schematic of one of the plots from figure 11, where the mean-field paraboloid is indicated as the dashed line. The base flow is indicated by  $B_0$ and the mean flow (limit cycle) by
 $B_{\textit{LC}}$. (b) Simulated time series of the mean-field model for
 $S=1.12$, where the line is coloured by the simulation time (from blue to red). The time series starts at
 $B=B_{\textit{LC}}$ and
 $A=0$, the unperturbed mean flow.

More generally, the better understanding of the interaction between hydrodynamic instabilities and the mean flow helps to link the experimental observations and numerical results from mean-flow stability analysis beyond the comparison of mode shapes. The quantitative assessment of amplification rates and mean-flow corrections from measurements allows a direct comparison of both approaches. Moreover, the distinction between deterministic and stochastic parts and their contribution to the flow dynamics enriches the picture of hydrodynamic instabilities in turbulent flows and helps to interpret the amplification rates obtained from mean-flow stability analysis. The effective limit-cycle amplification rate (see figure 12) should be directly comparable to the amplification rate of a corresponding mean-flow stability analysis.
The simulation of a time series shown in figure 13(b), starting from the mean flow with no oscillations, further illustrates the essence of the mean-field model. Before the oscillations grow significantly, the flow rapidly shifts towards the base flow and then grows in amplitude along the mean-field paraboloid. This behaviour is consistently observed for simulations of a cylinder wake (Noack et al. Reference Noack, Afanasiev, Morzyński, Tadmor and Thiele2003; Brunton et al. Reference Brunton, Proctor and Kutz2016), where the mean-field paraboloid is also identified as an inertial/slow manifold. The drift in state space (figure 13a) clearly shows that the mean-field paraboloid constitutes an attracting, slow manifold for the swirling jet. This knowledge of the mean-field model helps to understand the transient and intermittent dynamics of the swirling jet.
5. Conclusions
In this work, a method was developed to estimate the properties of a global hydrodynamic instability from measurement data of turbulent flows. The approach makes use of the stochastic perturbations that are present in the flow due to background turbulence. Background turbulence pushes the flow away from stable fixed points or limit cycles and, thus, forces the dynamics into other parts of the state space. From the deterministic return to the fixed point or limit cycle, the dynamic properties of the flow can be extracted.
The dynamical system is modelled by a stochastic amplitude equation describing the oscillatory dynamics of the instability (1-D model) and, in a second approach, by a stochastic mean-field model that captures additionally the interaction between the instability and the mean-flow corrections (2-D model). The stochastic perturbations are incorporated as additive forcing.
To capture the spectral properties of the turbulent perturbations, coloured noise was used for the stochastic forcing in the dynamical system. The validity of the derived amplitude equation for coloured noise was investigated by a numerical study. It is shown that the approach is feasible as long as the noise time scale is smaller than the oscillation period of the instability.
The methodology was applied to experimental data of a turbulent swirling jet undergoing vortex breakdown. This flow is dominated by a helical global mode commonly termed the ‘precessing vortex core’. Thereby, the swirl number is the major control parameter that governs the supercritical Hopf bifurcation of the global mode. PIV measurements were conducted to ensure that this mode is the most dominant coherent structure in the flow for the investigated swirl-number range. For the system identification, pressure measurements around the nozzle lip were used, providing longer time series than PIV.
The application of the 1-D model showed very good capabilities to fit the observed dynamics of the flow. The bifurcation point of the global mode was identified, and the good agreement between measured and estimated statistics showed that the model captures the relevant dynamics. The approach also identifies regions of a potential mismatch between the modelled and observed dynamics. The occurrence of an intermediate bistable switching between two flow states was correctly identified as a regime that is not accurately captured by the model. Moreover, the 1-D model shows a decrease of the slope of growth rate versus swirl number prior to the bifurcation point and a plateauing of the growth rate of the instability shortly beyond the bifurcation point. This contradicts the expected proportional scaling of the growth rate with the swirl number in the vicinity of the bifurcation point. This discrepancy is addressed in the 2-D mean-field model. Nevertheless, the 1-D approach is fairly robust with regard to increased noise magnitude and noise time scales.
The employed 1-D model is only strictly valid in the vicinity of the bifurcation point. Therefore, reliable results are only expected in the swirl-number regime II. Nevertheless, the analysis was carried out for a wider range of swirl numbers to demonstrate potential discrepancies between the model and the flow. The divergence between measured and modelled amplitude PDFs served well as an indicator for a mismatch between model and experiments. Accordingly, the entire bistable regime III is considered as a mismatch. Nevertheless, higher-order models might be constructed that capture these dynamics as well. In the present investigation, a higher-dimensional model was used instead of a higher-order model. This 2-D mean-field model was intended to explain the mismatch in the vicinity of the bifurcation point, which was also indicated by a slight increase of the divergence.
The description of the flow from a stochastic mean-field model was introduced as an alternative estimate of the flow properties. The calibration of the 2-D model provides a qualitative estimate, since no reduced analytical solution was derived. In contrast to the analytical approach pursued for the 1-D amplitude equation, the drift coefficients were determined from statistical moments of the measurement data. Other than the development of the equation for the amplitude PDF in the first approach, the estimate of the drift coefficients need no prior knowledge of the flow model. The 2-D model was constructed a posteriori to correspond to the observed dynamics. This will serve as a point of departure for future developments of a stochastic mean-field model that also incorporates accurate stochastic forcing and consequent development of 2-D analytical models from stochastic averaging.
The main difference in the description of the flow by the 2-D instead of 1-D model is a bifurcation of the flow at slightly lower swirl numbers and an increased growth rate right after the bifurcation. These differences most probably arise from not accounting for the interaction between the oscillatory mode and the slow mean-flow corrections by the shift-mode. In the 1-D model, these are lumped into the stochastic forcing, which violates the assumption of purely additive forcing. The consideration of the mean-flow corrections by the 2-D model clarifies this transient dynamics of the flow. This gives a more detailed picture of the flow dynamics and allows an estimation of the unperturbed base-flow state.
The work demonstrates that the observation of limit-cycle oscillations is not sufficient to determine the flow state, as the influence of the stochastic turbulent forcing is significant and masks the actual bifurcation point. However, the proposed separation of deterministic and stochastic contributions in the dynamical model allows identification of the flow state solely based on stationary measurement data. The inclusion of the shift-mode gives further capabilities to handle flows with a pronounced mean-flow correction. The methodology is expected to apply to a wide range of turbulent flows subjected to global flow instabilities.
Appendix A. Swirl-number determination
The swirl number for the present investigations is obtained from PIV and laser Doppler anemometer (LDA) measurements as presented in figure 14. The integral swirl number is computed as in Oberleithner et al. (Reference Oberleithner, Paschereit, Seele and Wygnanski2012) from the ratio of axial flux of azimuthal to axial momentum
 \begin{equation} S = \frac{2 \dot{G_{\theta}}}{D \dot{G_{x}}} = \frac{2{\rm \pi} \displaystyle\int_{0}^{\infty}\rho \bar{v}_{x} \bar{v}_{\theta} r^{2}\,\mathrm{d}r} {{D}{\rm \pi} \displaystyle\int_{0}^{\infty}\rho (\overline{v_{x}^{2}}- \tfrac{1}{2}\overline{v_{\theta}^{2}}\,) r \,\mathrm{d}r}. \end{equation}
The general perception is that the integral swirl number is very sensitive to the axial position utilised for the calculations, although it should be constant along the jet axis. This is due to difficulties of an accurate representation of the pressure-related momentum transport in a turbulent flow. Especially, the presence of stagnant or reversed flow at the axial position of evaluation causes complications.
Different swirl-number definitions against the swirler vane angle of the experimental apparatus. The integral swirl numbers are obtained from PIV and LDA measurements. Approximations of the integral swirl number based on the pressure measurements and the swirler angle are given as well.

Since the current investigations span a large range of swirl numbers, there are cases where the recirculation region reaches up to the nozzle and different breakdown shapes occur. The graphs in figure 14 reflect these properties, where different measures of the swirl number are plotted against the swirl generator vane angle. Owing to the transition between the two mean flow states, there is a jump in the representation of swirl number against the swirler vane angle. As the integral swirl number is not unique for the investigated range, a swirl number based on the swirl angle is calibrated to the integral swirl number, resulting in  ${S}_{\alpha } = \alpha /25^\circ - 1.2$. This geometry-based swirl number is used throughout the current investigation.
The black dots in figure 14 represent a swirl measure based on the time mean  $m=0$ pressure Fourier mode
 $\langle \hat {p}_{0} \rangle$ as
 ${S}_{{p}} = \langle \hat {p}_{0}\rangle /28\,\mathrm {Pa} + 0.9$. It becomes clear that the pressure is a good indicator for the mean flow state, which justifies the description of the shift-mode being proportional to the mean pressure. The relation is only violated in the bistable region where the model predictions fail anyway.
Appendix B. Relation between PIV and pressure measurements
In this work, the dynamics of the helical mode and the shift-mode are quantified based on velocity and pressure data. To confirm the correlation between these two quantities, the data from simultaneous PIV and pressure measurements of the flow are analysed and presented in figure 15. The presented data are from a 5.5 s measurement series, where synchronised measurements were recorded at a swirl number of  $S=1.12$. The plot compares the oscillatory mode
 $A$ and the shift-mode
 $B$ obtained (i) from the pressure measurements and Fourier decomposition of the pressure signals as
 $A_p = \hat {p}_1$ and
 $B_p = \hat {p}_0$, and (ii) from the SPOD coefficients of the PIV measurements as
 $A_{\textit{PIV}} = a_1 + \mathrm {i} a_2$ and
 $B_{\textit{PIV}} = a_3$. The subscript of the SPOD coefficient indicates the mode number according to a ranking by energy. The phase and magnitude of the oscillatory mode are obtained from the polar representation of the complex coefficient, reading
 $A=|A|\exp (\textrm {i}\phi )$.
Comparison of the helical-mode coefficient obtained from simultaneous PIV and pressure measurements, as indicated by the subscripts PIV and  $p$, respectively. (a) The correlation coefficient between the complex coefficient from both measurements ( the inset shows a zoom of the peak). (b) Relation between the phases (argument of the complex amplitude); the colour indicates
 $|A_{\mathrm {PIV}}|$. (c) Relation between the helical magnitudes and (d) relation between the shift-modes, where the linear trend is indicated by the black lines.

The cross-correlation (figure 15a) indicates a good overall agreement of the helical mode obtained from both approaches, where the maximum correlation coefficient is 0.95. Since both measurements are taken at different locations, there is a 5 ms shift in time between PIV and pressure data, corresponding to a quarter oscillation period of the flow oscillation. The maximum of the correlation is used to align both measurement series in time.
The direct comparison of the phase (figure 15b) and the magnitude (figure 15c) allows a more detailed investigation of this relation. The phases show limited jitter, with a standard deviation of less than 5 % of a period and a very good agreement. Relatively larger deviations are mainly observed at times with low oscillation magnitude.
The magnitude comparison (figure 15c) indicates larger deviations between the two measures; especially, the pressure shows stronger fluctuation around the limit cycle. This is because the SPOD coefficient of the PIV data represents the average magnitude over a large measurement domain, whereas the pressure measurement only senses the local dynamics near the nozzle lip. Thus, any local perturbation of the helical mode is spatially averaged in the SPOD coefficient but directly visible in the pressure signal. Moreover, the large difference in the number of spatial measurement points causes a larger pickup of measurement noise in the pressure estimation of the mode coefficient.
The colouring of the scatter plot in figure 15(c) indicates that part of the discrepancies between PIV and pressure measurements can be explained by a modulation of the (pressure-based) helical-mode amplitude  $A_p$ through the shift-mode
 $B$. This is plausible due to the fact that an increasing shift-mode amplitude represents an upstream movement of the breakdown bubble, which, in turn, causes an upstream movement of spatial structure of the helical mode. This effect moves the helical mode closer towards the pressure sensors that stay at a fixed position at the nozzle exit. Therefore, regions with stronger precessing motion move closer to the pressure sensor, which results in a stronger signal (compare figure 5). The observation would call for a stochastic estimation of the SPOD coefficients from the pressure signals as presented by Lasagna, Orazi & Iuso (Reference Lasagna, Orazi and Iuso2013). However, such an approach requires extensive, simultaneous PIV and pressure measurements.
Figure 15(d) shows the corresponding comparison of the shift-mode from both measurements. Similar to the magnitudes, the pressure estimation shows larger fluctuations, but the average dynamics agree very well.
Appendix C. Relation between stochastic Van der Pol oscillator and the stochastic Stuart–Landau equation
For the stochastic analysis of basic oscillators, the Van der Pol oscillator is often employed to model the system. The Stuart–Landau equation employed in this investigation shares some properties with the Van der Pol oscillator but also deviates in some regards. Therefore, the steps from the original equation to the stochastic amplitude equation are presented here for both approaches. The derivations for the Van der Pol oscillator were in accordance with those of Noiray (Reference Noiray2017).
The starting point for the derivation is (3.3), the randomly forced amplitude equation with complex amplitude  $A$, reading
 \begin{equation} \dot{A} = (\sigma + \textrm{i} \omega) A - \alpha |A|^2 A + \xi. \end{equation}
The added stochastic forcing is complex-valued,  $\xi =\xi _r + \textrm {i} \xi _i$, with variance
 $\varGamma$. The model parameters are given in § 3.1. The change of variables to magnitude and phase,
 $A = |A| \ \textrm {e}^{\textrm {i}\phi }$, and the use of trigonometric identities leads to
 \begin{gather} |\dot{A}| = |A| (\sigma - \alpha |A|^2) + \xi_r \cos{\phi} + \xi_i \sin{\phi}, \end{gather}
 \begin{gather}\dot{\phi} = \omega + \frac{\xi_r}{|A|}\sin{\phi} + \frac{\xi_i}{|A|}\cos{\phi}. \end{gather}
Stochastic averaging of this equation allows the magnitude  $|A|$ to be decoupled from the phase
 $\phi$ as
 \begin{gather} |\dot{A}| = |A|(\sigma - \alpha |A|^2) + \frac{\varGamma}{|A|} + \xi_{A}, \end{gather}
 \begin{gather}\dot{\phi} = \omega + \frac{\xi_{\phi}}{|A|} , \end{gather}
where  $\xi _{A}$ and
 $\xi _{\phi }$ are new forcing terms with a variance of
 $\varGamma /2$. The separation of the stochastic equation into amplitude and phase relies on the fact that only real-valued Landau constants
 $\alpha$ are considered.
In contrast to the Stuart–Landau equation, which is a two-variable first-order differential equation, the Van der Pol oscillator is a single-variable second-order differential equation. With the parameters adapted to the present nomenclature, the randomly forced Van der Pol oscillator of the real-valued variable  $x$ is given as

where the random forcing  $\zeta$ is real-valued as well. The change of variables
 $x = |A| \cos (\phi )$ (with
 $|A|=\sqrt {x^2+\dot {x}^2/\omega ^2}$) and deterministic averaging over one oscillation period (Noiray Reference Noiray2017) lead to
 \begin{gather} |\dot{A}| = |A| (\sigma - \alpha |A|^2) + \frac{\sin{\phi}}{\omega} \zeta, \end{gather}
 \begin{gather}\dot{\phi} = \omega + \frac{\cos{\phi}}{\omega |A|} \zeta. \end{gather}
Furthermore, stochastic averaging of the two equations gives
 \begin{gather} |\dot{A}| = |A| (\sigma - \alpha |A|^2) + \frac{\varGamma}{4 \omega^2 |A|} + \zeta_A, \end{gather}
 \begin{gather}\dot{\phi} = \omega + \frac{\zeta_\phi}{|A|}, \end{gather}
with the new independent noise contributions  $\zeta _{A}$ and
 $\zeta _{\phi }$, which both have variance
 $\varGamma /2\omega ^2$.
Clearly, the magnitude–phase representations of the two stochastically averaged equations are fairly similar. Only one difference is apparent when comparing (C4) and (C9), which is the additional factor  $1/(4\omega ^2)$ in the
 $\varGamma /|A|$ term. Furthermore, the magnitude–phase representation of the Van der Pol oscillator in (C9) and (C10) constitutes an approximation that is only valid for
 $|\sigma | \ll |\omega |$. In contrast to the limited validity of the Van der Pol oscillator, the amplitude equation of the Stuart–Landau equation is represented in polar coordinates without any restrictions.
Appendix D. Complete parameter set for the stochastic amplitude equation
The entire model parameters for the stochastic amplitude equations (3.5) and (3.6) are presented here. The representation completes the results presented in § 3.5, especially in figure 10. In accordance with figure 10, all the parameters are presented here in figure 16. Based on this representation, it is interesting to note that reasonable estimates of the Landau constant  $\alpha$ are only obtained for
 $S>1.05$. This corresponds exactly to the point where the 2-D model indicates the bifurcation of the flow, whereas the 1-D model, shown here, indicates the bifurcation at
 $S=1.1$. Note that the time scales (
 $1/\omega ,1/\sigma ,1/\alpha$) in the measurement are approximately one-tenth of the simulation time scales presented in § 3.4. This makes the value of
 $\varGamma _\tau = 1$ obtained here from the measurements comparable to the value of
 $\varGamma _\tau = 0.1$ used for the simulation.
Estimated model parameters against the swirl number obtained from pressure measurements. From ( $a$) to (
 $e$), the graphs show the oscillation frequency
 $\omega$, the growth rate
 $\sigma$, the Landau constant
 $\alpha$, the noise correlation time
 $\tau$ and the effective noise intensity
 $\varGamma _\tau$.

Funding
The authors gratefully acknowledge funding from the German Research Foundation under DFG Project PA 920/30-1 and DFG Project PA 920/37-1.
Declaration of interests
The authors report no conflict of interest.