


Introduction
Melt ponds and wet snow cover a significant area of the summer Arctic sea ice. Melt features on sea ice can cover more than 50% of the sea-ice area (Reference Derksen, Piwowar and LeDrewDerksen and others, 1997; Reference Fetterer and UntersteinerFetterer and Untersteiner, 1998). As the albedo of wet snow and melt ponds is considerably lower than the albedo of dry ice (down to 0.2 for 30 cm deep ponds (Reference Grenfell and MaykutGrenfell and Maykut, 1977)), accurate classification is essential for estimates of the polar summertime energy balance.
Reference Perovich, Maykut and GrenfellPerovich and others (1986) measured the spectral albedos of dry snow, wet snow and melt ponds for several depths. Whereas wet snow reduces the spectral albedo, compared to dry snow, by about the same value over the whole visible range, melt ponds have a greater reduction at longer wavelengths and therefore appear blueish. The spectral albedo of melt ponds for wavelengths greater than 800 nm is about 0.05 independent of melt-pond depth, whereas at 500 nm the albedo decreases from 0.6 for an early-season 0.1 m deep melt pond to 0.25 for a 0.3 m deep old melt pond. Nevertheless, melt ponds can have a range of color tones depending on the underlying ice type and ice thickness. The relative higher blue albedos have also been observed by Reference Morassutti and LeDrewMorassutti and LeDrew (1996) and Reference Barber and YackelBarber and Yackel (1999). Reference Tschudi, Curry and MaslanikTschudi and others (1997) made use of this spectral difference to identify melt ponds using video data.
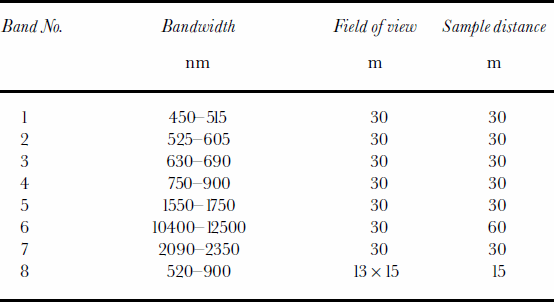
For large spatial areas, the Landsat 7 Enhanced Thematic Mapper Plus (ETM+) is an excellent sensor with which to study the surface properties of sea ice during summer. In addition to the different spectral bands, covering the range from 450 nm (blue) to near-infrared and also thermal infrared, the data have a spatial resolution of 30 m (15m for the panchromatic band) (Table1). This high spatial resolution is necessary to enable the identification of melt ponds, as these commonly have diameters of a couple of meters, although melt ponds as large as 400m across have been measured (Reference Fetterer and UntersteinerFetterer and Untersteiner, 1998). On first-year ice, melt ponds are generally larger in extent and shallower compared to multi-year sea ice. Therefore, areas of first-year ice only are an excellent test site for investigating melt-pond signatures in the Landsat data.
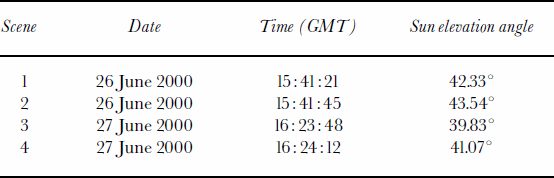
As part of the pre-launch summer Arctic Earth Observing System (EOS) Aqua Advanced Microwave Scanning Radiometer validation aircraft campaign Meltpond 2000 in June/July 2000 (Reference CavalieriCavalieri, 2000), four cloud-free Landsat 7 scenes over Baffin Bay were acquired (Fig. 1; Table 2). Baffin Bay is a good area for this initial investigation as it does not contain any multi-year ice so that we only have one primary ice type and the observed signatures result from variations in the surface properties only.
Overview of the Landsat scenes acquired for 26–27 June 2000 (see Table 2 for details).

Landsat characteristics
Details of the Landsat scenes shown in Figure 1
Analysis
After the digital numbers of each Landsat band have been scaled into absolute radiances for each wavelength (Rλ), respective reflectivities (αλ) are calculated following
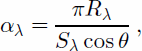
where Sλ is the respective solar irradiance given in the Landsat 7 Science Data User Handbook and θ is the solar zenith angle.
Spectral analysis of melt features
Figure 2a shows a true-color subset of Landsat scene 2 (Table 2) of Baffin Bay where bands 3, 2, 1 are red, green and blue, respectively. The width of the image is 25 km. One can clearly distinguish between open water and individual ice floes. Whereas open water has a very distinct signature, the summertime reflectivities of sea ice vary significantly. Dry snow is generally seen as white, but with the onset of melt and the consequent wettening of the snow/ice cover, various tones of blue and gray are apparent. Only ridges and hummocks, despite some likely wetness, still appear as white. As mentioned above, melt ponds (at least shallow melt ponds) appear as light blue in the true-color images (point A). Additionally, one can identify different shades of blue (points B–D) that are separate from different shades of gray (points E–H). This is even more distinct in the two-dimensional histograms of band 1 vs band 4 and band 1 vs band 3 (Fig. 3). The majority of pixels fall along the ice–water line from point E
(a) Landsat true-color image of Baffin Bay for 26 June 2000 (bands 3, 2, 1 for red, green and blue, respectively). The width of the image is 25 km (b) True-color blow-up (red box in (a)). The width of the scene is 5 km. (c) Difference of band 3 and band 2 for the same area as shown in (b). (d) Classified image.


(white ice) to point H (open water). Points F and G, which also lie on this line, represent very wet snow or remains of decaying sea ice. The heavy population of pixels with reflectivities of 0.68 in band 1 results from saturation in the high-gain Landsat data. The saturation limits the reflectivities so that expected maximum reflectivities of about 0.9 are not measured. If one continued the H-G-F line until the reflectivity in band 3 was about 0.65, reflectivities of band 1 would reach values of about 0.9. According to Reference Perovich, Maykut and GrenfellPerovich and others (1986), a wet snow cover shifts the albedo by about the same value for the whole visible range. Therefore points Fand Glie on the ice–water line. On the other hand, when melt ponds develop, shorter wavelengths remain relatively high compared to the longer wavelengths. Thus, pixels will deviate from the dry-ice–open-water line towards higher band 1 (blue) values, and presumably move from point A to point D as the melt-pond depth increases.
It is noteworthy that points A–D (and similar pixels) lie on the outer margin of the distribution. These pixels have been identified because of their distinct blue signature. We assume that as melt ponds develop and increase in depth, pixels move from point E to A and then to points B, C and D. Pixels between the A–D curve and the E–H line are likely pixels that contain mixtures of melt ponds and ice with different degrees of wetness.
When plotting reflectivities vs wavelength (Fig. 4), one notices that melt-pond pixels (A–D; solid lines) have a larger gradient than points E–H (dotted lines), in agreement with the measurements from Reference Perovich, Maykut and GrenfellPerovich and others (1986). Also in agreement with their measurements, at wavelengths longer than 800 nm, melt-pond pixels (except for point A) have about the same reflectivities. Furthermore, the gradient between bands 2 and 3 is clearly negative for melt ponds, whereas the gradient for white and wet ice is smaller. Reflectivity differences between band 3 and band 2 for melt-pond pixels vary between –0.08 and –0.15 (Fig. 4). The values agree well with the measurements of Reference Perovich, Maykut and GrenfellPerovich and others (1986). These spectral differences make sea-ice surface classification possible. Figure 2b shows an enlarged (red box in Fig. 2a) true-color image of a floe that is significantly ponded. Although individual melt ponds are not necessarily resolved, the floe in the center of the image consists of vast areas of melt ponds that are interspersed with ridges. The difference between band 3 and band 2 is shown in Figure 2c. The black-gray-white areas in Figure 2b have values between –0.02 and –0.06, whereas melt-ponded areas have values of <–0.08. There is a transition area of values between –0.06 and –0.08 (dark green and bright yellow in Fig. 2c) where classification would be subjective. These pixels are likely areas with mixtures of different surface types. The fraction of pixels with gradients within this range is 18% for Figure 2c. We are conservative and do not classify these pixels as melt ponds. The following scheme is used to differentiate between white ice, wet and/or bare ice, melt ponds and open water:
Landsat reflectivities vs wavelength. The solid lines are for points A–D in decreasing brightness; the dotted lines are for points E–Hin decreasing brightness.

White ice: αb1 > 0:65 and αb3 – αb2 > –0.08 Wet/bare ice: 0:2 < αb1 < 0.65 and αb3 – αb2 > –0.08 Melt ponds: αb1 > 0.2 and αb3 – αb2 <–0.08 Open water: αb1 < 0.2
In the classified image (Fig.2d) open water is black, white ice is white, wet/bare ice is gray, and melt ponds are light blue. Comparison of Figure 2b and c shows that the thresholds used qualitatively classify the Landsat image accurately. Nevertheless, the fraction of melt ponds within mixed pixels is uncertain. Therefore further investigations, for example the comparison of Landsat signatures with in situ measurements of melt ponds at different stages, are needed.
Melt features in the panchromatic channel
Although different surface types can have similar gray values when single-channel instruments are used (Reference Derksen, Piwowar and LeDrewDerksen and others, 1997) (making the distinction between melt ponds and wet surfaces difficult), the use of the very high-resolution (15 m) panchromatic channel (band 8) may be desirable, particularly for ice-concentration estimates. In Figure 3a, points C, D and G correspond to the darkest sea-ice areas in band 4, and yet their spectral signatures are different, indicating different surface types (deep melt ponds vs very wet snow or remains of decaying sea ice; see discussion above). Despite these spectral differences, both surface types have similar albedo values of around 0.18 in the panchromatic band. Thus, neglecting pixels consisting of mixtures of open water and dry ice, a value of 0.18 seems to be a valid lower threshold of sea ice during summer.
Clouds and cloud shadows
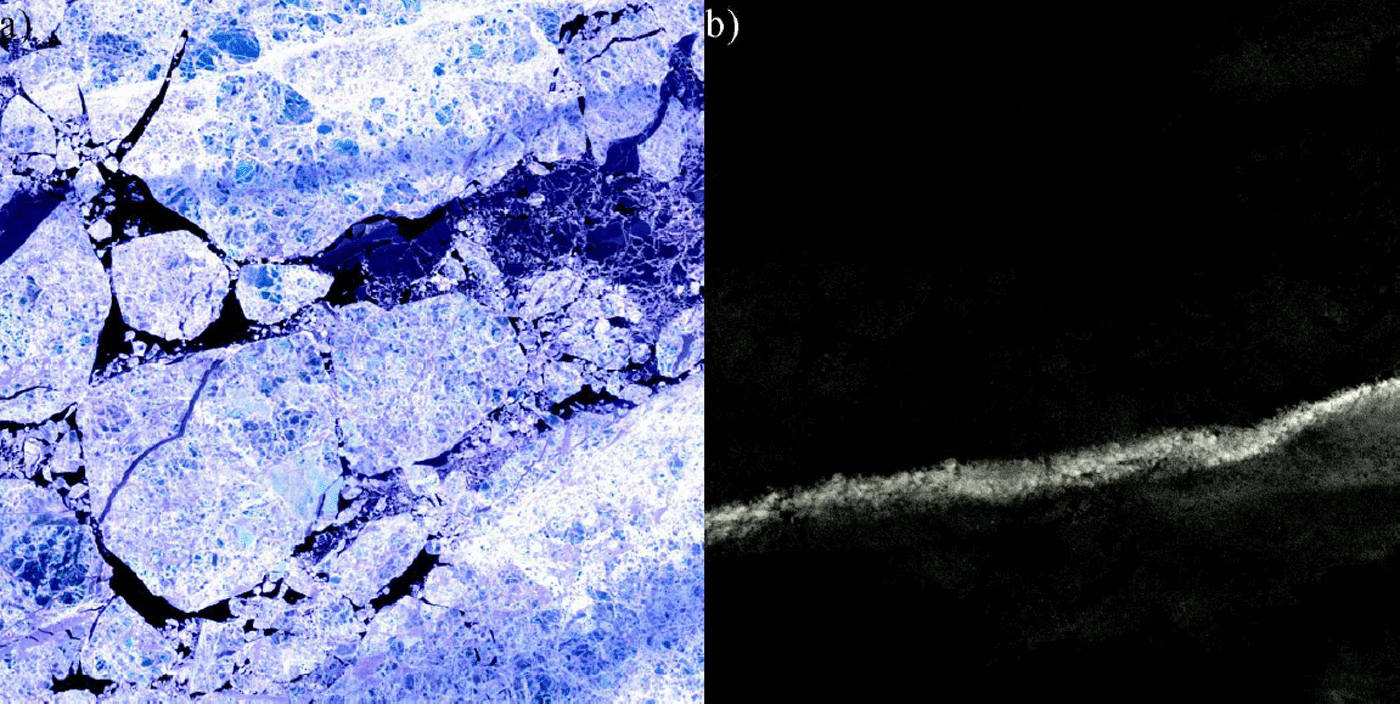
Band 5 and/or band 7 can be used for cloud detection. At these wavelengths (see Table 1) snow has very low reflectivities whereas clouds are highly reflective (Reference Bunting and d’EntremontBunting and d’Entremont, 1982; Reference Crane and AndersonCrane and Anderson, 1984). Figure 5a shows a subset of Figure 2a juxtaposed with the corresponding band 5 image (Fig. 5b). The clouds (probably cirrus) in band 5 appear bright (Fig. 5b) whereas water and snow/ice are almost black. Comparison of the true-color image with the band 5 subset reveals that the cloud band itself does not affect the albedos directly. No variation in brightness can be detected for the pixels where band 5 detects clouds. It is the shadow of the clouds that causes a darkening in the visible bands (above (north of) the cloud band in Fig. 5a). All Landsat bands show a reduction in brightness for the cloud-shadow region reducing the spectral distinction of melt ponds. Given the lack of information in the Landsat data needed to easily discriminate between shadows and variations in surface type using an algorithm, visual interpretation or perhaps a digital pattern recognition approach is needed to detect cloud shadows.
(a) True-color subscene and (b) band 5 image for the same area.
Conclusions
This study has demonstrated the potential inherent in Landsat 7 ETM+ data for the classification of summertime sea-ice surface conditions. The Baffin Bay area is an ideal region for investigating melt ponds because all the sea ice is first-year ice and melt ponds tend to be shallower and larger in extent compared to multi-year ice. Areas with a high fraction of melt ponds can easily be distinguished from white and wet ice by their blueish appearance and by their greater negative spectral gradients between bands 2 and 3. Although areas with vast amounts of melt ponds are identifiable in the Landsat images, individual melt ponds may be too small to be detected. The distance of a given pixel in band 3 or 4 from the ice–water line (see Fig. 3) may help to estimate the fraction ofmelt ponds, but higher-resolution data are needed. As part of the Meltpond 2000 experiment, video data have been obtained which are currently being analyzed. We anticipate that these data will help to quantitatively access the accuracy of the algorithm and to address the problem of mixed pixels in the Landsat data. Further investigations are needed to develop a broader range of case-studies and to acquire coincident in situ measurements for enabling a detailed analysis of melt-pond signatures (e.g. relationship to melt-pond depth) in the ETM+ data. Whereas clouds can be detected using band 5 or 7, cloud shadows alter the spectral signatures and therefore must be detected visually before large-scale operational analyses can be carried out.
Acknowledgements
We want to thank the reviewers for their thorough reading of the manuscript and their very constructive comments which helped to improve the paper significantly. This work was supported by the NASA EOS Aqua project.



