Introduction
The accurate detection and classification of organic compounds are critical in various scientific and industrial domains, including environmental monitoring, food quality control [Reference Nath1], and medical diagnostics [Reference Mascini and Tombelli2–Reference Wasilewski, Kamysz and Gębicki4]. Three common organic substances, methanol, ethanol, and propanol, offer both unique problems and potential benefits. Methanol, often used in industry as a solvent and a fuel source, is highly poisonous and thus presents considerable health hazards [Reference Dybiński, Milewski, Szabłowski, Szczęśniak and Martinchyk5]. Ethanol finds extensive use in alcoholic drinks, medicines, and as a sterilizing agent. Propanol is also used for disinfection, but it further serves as a component in manufacturing various items like industrial solvents, cleaning products, beauty products, and specific printing inks. Accurate identification of these three substances is essential for maintaining safety and quality in a wide range of uses.
Dielectric property sensors are versatile devices that characterize materials by analyzing their interactions with electromagnetic fields, typically in the microwave or radio-frequency ranges [Reference Han, Liu, Zhang, Peng, Fu, Qiao and Ma6, Reference Hussain, Zahra, Abbas and Zhu7]. Previous research has highlighted the potential of microwave resonant sensors for noninvasive glucose monitoring. For example, one study reported a sensor operating at 9 GHz with a quality factor (Q-factor) of 240, achieving a sensitivity of 7.67 MHz per mg/dL in tests conducted on human volunteers [Reference Kiani and Rezaei8].
More recently, a compact meandered-microstrip microwave sensor demonstrated high performance in liquid characterization, attaining a Q-factor of 506 and exhibiting a resonance-frequency shift from 5.42 to 3.27 GHz when exposed to various liquids, including ethanol, methanol, glucose solutions, and deionized water [Reference Kiani, Rezaei and Fakhr9].
In another study, a split-ring-resonator (SRR)-based microwave sensor was developed to measure the real part of a liquid’s dielectric constant across two frequency bands. This sensor combined high Q-factor, strong sensitivity, and multi-sensing capability, with resonance frequencies shifting from 5.76 to 4.80 GHz and from 7.85 to 6.35 GHz depending on the permittivity of the tested liquids, including ethanol, methanol, glucose solution, and deionized water [Reference Kiani, Rezaei and Navaei10].
A dual-band microwave resonant sensor operating at 5.5 and 8.5 GHz was also introduced for noninvasive blood-glucose monitoring via fingertip measurements. With Q-factors of 180 and 106, the device achieved frequency detection resolutions (FDRs) of 3.53 and 3.58 MHz/(mg/dL) over glucose concentrations ranging from 89 to 262 mg/dL, showing strong agreement with invasive measurements and a maximum error of only about 3% [Reference Kiani, Rezaei and Fakhr11].
Additionally, a substrate-integrated-waveguide (SIW) planar sensor was designed and realized for noninvasive glucose monitoring. By integrating slots and interdigital arms to enhance the local electromagnetic field and by considering fingertip displacement and fingerprint effects, the fabricated sensor demonstrated improved stability and significantly higher resonance-frequency shifts, indicating a marked enhancement in glucose-detection sensitivity compared to earlier SIW-based designs [Reference Kiani, Rezaei, Karami and Sadeghzadeh12].
Finally, a planar microstrip sensor based on a band-stop filter was developed to measure the relative permittivity of solid materials. By combining a meandered-microstrip line with a T-shaped resonator and an interdigital structure grounded via vias, the sensor achieved enhanced electric field intensity, improving sensitivity and resolution. Fabricated on an RO4003 substrate, the device exhibited a linear relationship between resonance-frequency shifts and permittivity variations (from 3 to 11), with resonance frequencies ranging from 3.7 to 5.65 GHz, outperforming previous similar designs in terms of both Q-factor and sensitivity [Reference Kiani, Rezaei, Navaei and Abrishamian13].
Recent research demonstrates that combining metamaterials with microwave sensors has created significant advancements in sensing technology [Reference Han, Liu, Zhang, Peng, Fu, Qiao and Ma6, Reference Khalil, Yong, Islam, Hoque, Islam, Leei and Soliman14]. This integration notably improves sensor sensitivity, enabling the detection of subtle signals and the identification of minute details.
Metamaterials can produce intense, concentrated electromagnetic fields, including surface plasmon resonances (SPRs) [Reference Yamamoto15], which greatly strengthen the interaction between a sensor and the biomolecules being analyzed. This intensification results in greater sensitivity, facilitating the detection of even trace amounts of substances. SPR sensors function by analyzing how light interacts with a thin metal film’s surface. Metamaterials, like plasmonic nanostructures, can boost SPR signals by increasing the field’s strength at the boundary between the metal and the surrounding material, substantially improving sensitivity [Reference Wang, Nasir, Krasavin, Dickson, Jiang and Zayats16].
Furthermore, metamaterials’ ability to confine electromagnetic fields to extremely small areas enables highly localized sensing and greater spatial precision. They can also be incorporated into electrochemical sensors to improve both sensitivity and selectivity [Reference Stetter, Penrose and Yao17]. For instance, metamaterial structures can create concentrated electric fields that amplify the electrochemical signals produced when the analyte interacts with the sensor’s surface.
Despite the significant progress witnessed in the field of biosensors and microwaves, most previous research has focused primarily on studying the performance and sensitivity of these sensors to various stimuli. While these studies are essential for understanding how sensors work, they have not delved into explaining the fundamental phenomena that make some materials more suitable for sensing than others. Understanding the mechanisms underlying the sensitivity of different materials is a crucial step toward developing sensors with unique and flexible properties. Therefore, our research aims to bridge this knowledge gap by studying the factors that affect the susceptibility of materials for sensing and detection, thus opening new horizons for the development of advanced sensing technologies that meet the growing needs in various fields.
This research focuses on the design and development of dielectric microwave sensor incorporating metamaterial elements for the selective detection and classification of hydroxyl organic compounds (HOCs) such as methanol, ethanol, and propanol. The performance of the developed metamaterial-based sensor was rigorously evaluated through a combination of the method of moment’s simulations and experimental measurements. This study underscores the significant potential of integrating metamaterial concepts into sensing platforms, paving the way for advancements in the development of highly sensitive and selective sensors for a wide range of organic compounds.
After designing and fabricating the sensor, we will strive to determine why hydroxyl organic materials respond differently to microwave radiation and what influences their different levels of detection. We will try to explain the mechanisms governing the sensitivity and detectability of hydroxylated organic materials in the microwave frequency range.
This work lies in its detailed investigation of the fundamental mechanisms governing the sensitivity and detectability of HOCs in the microwave frequency range – an area that has received limited attention in prior studies. Unlike conventional approaches that focus solely on empirical detection, this research establishes a direct correlation between the measured microwave response and intrinsic molecular parameters such as dipole moment, refractive index, and absorption characteristics. By elucidating how these molecular properties influence the microwave interaction mechanisms, the study provides a new framework for predicting and enhancing detection sensitivity across different organic compounds, offering valuable insights for the development of advanced microwave-based sensing and diagnostic systems.
Methodical approach to designing a metamaterial-based microwave sensor
The design of the sensor was carried out through a structured process that begins with defining the requirements, including the target frequency range (1–20 GHz), the specific hydroxyl compounds to detect, and the desired sensitivity and resolution. A capacitively loaded loop (CLL) metamaterial unit cell was then designed, selecting appropriate geometry parameters to induce a strong magnetic response and tune the resonance frequencies. This design was optimized through numerical simulations, where S-parameters and field distributions were analyzed to maximize sensitivity. The sensor was subsequently fabricated using standard printed circuit board (PCB) techniques, and experimental testing was performed by connecting it to a vector network analyzer (VNA) with full calibration. S-parameters were measured for all samples, and the data were processed to extract electrical properties using the Debye–Cole–Cole (Havriliak–Negami) hybrid model. Experimental results were validated against simulations, and performance optimization was performed iteratively by adjusting the unit cell geometry as needed. The structured process for the design, simulation, fabrication, and testing of the metamaterial-based microwave sensor is illustrated in Figure 1.
Workflow for design, simulation, fabrication, and testing of a metamaterial-based microwave sensor.

Structural design of the metamaterials
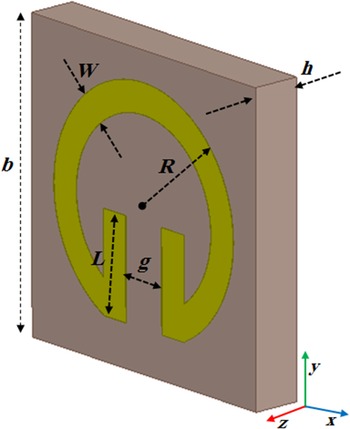
The core component of our metamaterial is a unit cell with a “CLL” geometry, as depicted in Figure 2. This CLL design, while functionally similar to SRRs, offers a significant advantage in terms of fabrication simplicity. The CLL features an outer radius of 10 mm and a gap of 4 mm. A thin copper layer (0.035 mm thick) forms the metallic component and is printed on an FR4 epoxy substrate with a thickness of 1.5 mm. The selection of FR4 is based on its low-loss properties, minimizing energy dissipation within the substrate, thereby ensuring optimal performance of the metamaterial.
Metamaterial unit cell, L = 8.28 mm, b = 25 mm, h = 1.5 mm, R = 10 mm, g = 4 mm, W = 2.5 mm, and t = 0.035 mm.

The metamaterial unit cell’s effective permittivity and permeability show resonance between 1.2 and 1.7 GHz, with the permeability exhibiting a resonance frequency approximately f 0 = 1.54 GHz, as shown in Figure 3(a). Energy dissipation within the metamaterial is indicated by the imaginary components of these effective parameters.
(a) Effective properties of the metamaterial unit cell and (b) refractive index.

Figure 3(b) depicts the real Re(n) and imaginary Im(n) parts of the refractive index (n) from 1 to 3.5 GHz. A clear resonance phenomenon is evident between 1.4 and 2 GHz, where both Re(n) and Im(n) change most dramatically.
The real part of the refractive index Re(n) peaks around 1.54 GHz, then decreases and stabilizes at higher frequencies, maintaining positive values. The imaginary part Im(n), which signifies energy absorption, also peaks near 1.54 GHz, coinciding with the Re(n) peak. Beyond this point, Im(n) rapidly decreases, approaching zero at higher frequencies, signifying significant energy absorption near the resonance.
This CLL metamaterial displays a powerful resonance, a distinctive physical trait that intensifies its interaction with electromagnetic radiation at particular frequencies. This trait makes it perfectly suited for cutting-edge sensing technologies. Following a detailed examination of its electromagnetic characteristics, we will use this unique metamaterial to engineer a highly sensitive and precise microwave sensor. This resonance will allow us to accurately distinguish materials and objects by detecting their unique resonant frequencies.
Design and fabrication of sensors
The proposed metamaterial sensor, depicted in Figure 4, comprises three layers. The top layer features a previously designed CLL metamaterial resonator integrated with a line. This layer is constructed from a 0.035 mm thick copper sheet with a conductivity of 5.8·107 S/m. Beneath this, an FR-4 substrate with a dielectric constant of 4.3 and a loss tangent of 0.025 forms the second layer. The bottom layer consists of a 0.035 mm thick copper ground plane.
(a) Microwave sensor, a = 60 mm, b = 25 mm, h = 1.5 mm, R = 10 mm, g = 4 mm, Ws = 2 mm, W = 2.5 mm, and Ls = 30 mm. (b) Equivalent circuit model.

To provide a more precise representation of the proposed sensor, an accurate equivalent circuit can be developed to model its resonant behavior and electromagnetic interactions, as shown in Figure 4(b). The sensor can be effectively represented using a combination of lumped elements, including series and parallel resonant LC circuits corresponding to the main resonant modes, along with coupling capacitors and inductors that account for the interaction between the sensing region and the feed lines. Such an approach allows capturing the frequency-dependent response, including shifts caused by the presence of the material under test. The design methodology for deriving this equivalent circuit can be guided by established works, such as the approach described in [Reference Varcheh, Rezaei and Kiani18], which demonstrates the use of multi-resonator LC networks for accurate modeling of planar microwave sensors. Implementing this equivalent circuit enables both a deeper understanding of the sensor’s operating principles and the ability to optimize its sensitivity, Q-factor, and overall performance.
Both experimental fabrication and measurement process, as shown in Figures 5 and 6, were used to thoroughly evaluate the sensor’s design.
The fabricated sensors.

Experimental setup for measure using VNA Anritsu MS4644A.

The sensor was fabricated using a standard PCB process, and all scattering parameters were measured with a VNA Anritsu MS4644A. The measurement procedure began with a full two-port calibration of the VNA using a calibration kit consisting of open, short, load, and thru standards across the X-band frequency range. The fabricated sensor was then connected to both ports via coaxial cables, replicating the setup used in numerical simulations. The testing process was carefully controlled to ensure accuracy and repeatability: all connections were checked for proper impedance matching and minimal signal loss, while environmental conditions such as temperature and humidity were monitored. HOC samples were prepared at specific concentrations and consistently positioned within the sensor’s sensitive region. Baseline measurements without samples were first recorded, followed by repeated measurements of each sample four times, capturing S11, S21, S12, and S22 across the frequency range to assess repeatability and reliability.
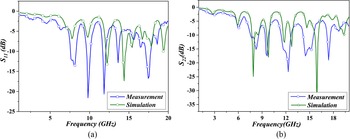
Both the simulation and measurement were performed across a frequency range from 1 to 20 GHz. The results of the simulation and experimental measurements were almost identical, demonstrating a strong correlation between the simulated and measured data, as shown in Figures 7 and 8. This close agreement between simulation and measurement validated the design’s accuracy. Through these results, analysis of the reflection parameters clearly shows the presence of three essential distinct resonance responses at approximately 8.6503, 11.072, and 13.368 GHz, as shown in Figure 7. These three distinct resonance responses will be the primary focus of our study.
Comparison between simulated and measured reflection coefficients of the proposed sensor: (a) S11 and (b) S22.

Comparison between simulated and measured transmission coefficients of the proposed sensor: (a) S21 and (b) S12.

The resonance phenomenon in the sensor can be explained by the agreement of the sensor’s electrical length with even or odd multiples of half or quarter wavelengths of the electromagnetic signal. This means that the sensor’s dimensions are proportional to specific wavelengths of the frequencies at which it resonates. From S11, we also noted good impedance matching, which corresponds to minimal signal reflection.
Figure 8 shows the transmission coefficient (S12 and S21) magnitude as a function of frequency, illustrating the power transfer efficiency between the sensor’s input and output ports. Across the 1 to 20 GHz range, the curve displays four distinct dips near 5.3, 11.14, 13.13, and 18.12 GHz, where S12 reaches approximately −38, −47, −43, and −53 dB, respectively, indicating minimal signal transmission at these frequencies. The transmission coefficient also exhibits good agreement between numerical simulation and experimental results.
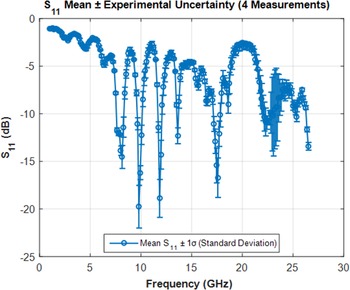
To verify measurement repeatability and quantify uncertainty, four repeated measurements of all S-parameters (S11, S21, S12, and S22) were carried out under identical conditions. The mean value and corresponding standard deviation (±1σ) were computed at every frequency point. The results were then visualized using error-bar plots, with the ±1σ intervals clearly illustrating the spread of the repeated measurements and providing an intuitive representation of experimental variability. The two figures (Figures 9 and 10) show the repeatability analysis for S11 and S21 across the 1–26 GHz range, where each curve represents the averaged response and the error bars quantify the measurement uncertainty.
Response with experimental uncertainty (±1σ) across four measurements of S11 (1σ): ±0.532 dB.

Response with experimental uncertainty (±1σ) across four measurements of S21 (1σ): ±1.223 dB.

The S11 results exhibit minimal and consistent uncertainty throughout most of the band, confirming the high stability of the reflection measurement, with an average deviation of only ±0.532 dB. In contrast, the S21 measurements display slightly larger fluctuations – particularly between 15 and 25 GHz – due to the increased sensitivity of transmission measurements to cable movement, connector conditions, and propagation losses, yielding an average uncertainty of ±1.223 dB. For completeness, the computed experimental uncertainties for the remaining parameters are ±1.262 dB for S12 and ±0.027 dB for S22 (Figures 11 and 12). Overall, these results demonstrate excellent repeatability, stable calibration, and reliable electromagnetic behavior of the sensor across repeated trials, confirming the robustness of the experimental setup.
S12 response with ±1σ uncertainty based on four repeated measurements (average 1σ: ±1.262 dB).

S22 response with ±1σ uncertainty from four repeated measurements (average 1σ: ±0.027 dB).

To gain a clearer understanding of the designed sensor’s operating mechanism, simulations of the electric field and surface current distributions were conducted at the resonant frequencies of 8.6503, 11.072, and 13.368 GHz. These findings are presented in Figures 13 and 14.
Surface current distributions of the proposed sensor: (a) f = 8.6503 GHz, (b) f = 11.072 GHz, and (c) f = 13.368 GHz.

Simulated electric field distributions of the proposed sensor at (a) 8.6503 GHz, (b) 11.072 GHz, and (c) 13.368 GHz.

At the first resonant mode (Figure 13(a)), the surface current is strongly concentrated on the inner split ring and the central segment of the vertical feed line. This intense confinement indicates that the inner ring functions as the dominant resonating element at the fundamental frequency, where the current completes a full oscillation cycle around the ring structure. The feed line acts primarily as an excitation path rather than a resonant contributor at this mode. The resulting current loop is well defined, showing that energy is efficiently stored in the ring, which explains the high field localization and sharp resonance observed at this frequency.
At the higher resonant modes (Figure 13(b) and (c)), the current distribution undergoes a significant transformation. Although the ring still supports current flow, additional high-intensity regions (current antinodes) appear along the upper and lower sections of the vertical feed line. This behavior is typical of higher-order standing-wave modes, in which the feed line itself starts behaving like a resonant element. The presence of multiple current peaks along the line suggests that harmonics of the ring’s natural resonance are being excited. These patterns also become more symmetrical due to boundary conditions imposed by the surrounding material and the electromagnetic properties of the substrate. At 11.072 and 13.368 GHz, the current loops appear more diffuse and exhibit broader contours compared to the fundamental mode, indicating altered field confinement and increased electromagnetic interaction with the structure’s geometry.
Figure 14 further reinforces these observations by illustrating the electric field distribution at the three resonant frequencies. The peak electric field amplitude is clearly highest at 8.6503 GHz, corresponding to the fundamental mode. This strong electric field concentration results from the efficient coupling between the incident electromagnetic wave and the inner SRR, where energy is tightly confined within a small region. At the higher modes (11.072 and 13.368 GHz), although the field remains present, its intensity is noticeably lower and more spatially distributed. This spreading indicates that the stored electromagnetic energy is shared between the ring and the feed line, leading to weaker confinement and reduced field enhancement. Such behavior is typical of harmonic modes, where the resonance is less sensitive to local permittivity variations and more influenced by the overall geometry of the structure.
Overall, Figures 13 and 14 highlight that the sensor exhibits a multi-resonant behavior. The fundamental mode shows highly concentrated fields and enhanced sensitivity, making it the most effective for detecting variations in material properties.
In contrast, the higher-order modes generate additional resonances with distinct field patterns, which can be advantageous for extracting multiple sensing parameters or differentiating materials with closely similar dielectric characteristics.
Dielectric characterization of hydroxyl compounds
The first step before evaluating the sensor’s performance is to determine the electrical properties across a wide frequency range (1–20 GHz) for four different hydroxyl compounds (water, methanol, ethanol, and propanol). This step is essential for predicting the detectability of these hydroxyl compounds by analyzing the disparities and variations in their permittivity values, thereby providing a preliminary assessment of their detection response strength.
A generalized hybrid Debye–Cole–Cole model based on the Havriliak–Negami model [Reference Havriliak and Negami19] was chosen for this analysis due to its evident ability to accurately characterize complex materials and produce precise and detailed results.
The Cole–Cole model [Reference Cole and Cole20] will be employed to describe the broad and asymmetric relaxation observed in complex systems. A Debye model [Reference Debye21] will simultaneously be used to account for a secondary relaxation process with simpler dynamics. This hybrid model is particularly advantageous for materials exhibiting multiple relaxation phenomena.
The generalized Havriliak–Negami can be expressed by the following mathematical formula [Reference Havriliak and Negami19]:
 \begin{equation}\varepsilon \left( \omega \right) = {\varepsilon _\infty } + \frac{{{\varepsilon _s} - {\varepsilon _\infty }}}{{{{\left[ {1 + {{\left( {j\omega {\tau _1}} \right)}^{1 - \alpha }}} \right]}^\beta }}}\end{equation}
where ɛ(ω): complex permittivity, ɛ ∞: permittivity at infinite frequency, ɛs: static permittivity for the Cole–Cole component, τ 1: relaxation time (Cole–Cole process), α: Cole–Cole broadening parameter (0 ≤ α ≤ 1), β: Cole–Cole shape parameter (0 < β ≤ 1), and ω: angular frequency (ω = 2πf).
This hybrid model combines the Debye and Cole–Cole models into a single equation, providing clear physical interpretations and capturing single-relaxation (Debye), distributed relaxation (Cole–Cole), or combined relaxation behavior. It also accounts for complex materials exhibiting multiple relaxation mechanisms, including both broad and sharp relaxations.
The hybrid model is characterized by special cases, which are as follows:
• When α = 0 and β = 1, it simplifies to the Debye model.
• When 0 < α < 1 and β = 1, the model reduces to a purely Cole–Cole form.
• When α = 0 and 0 < β < 1, it reduces to the Davidson–Cole model [Reference Dw22].
The high-frequency permittivity limit, ɛ ∞, is shared by both the Cole–Cole and Debye components.
To establish the parameters for a hybrid model combining Debye and Cole–Cole relaxation, the initial step involves determining the static permittivity (ɛs). This is achieved by extracting the permittivity value from experimental data at very low frequencies, where it plateaus to its static value. Subsequently, the Cole–Cole relaxation time (τ 1) is calculated. This is done by identifying the frequency (f) at which the imaginary part of the complex permittivity is maximized; τ 1 is then equal to 1/(2πf). These two values serve as crucial starting points for the hybrid model’s parameters. Finally, the remaining five parameters are estimated using fitting algorithms. These algorithms compare the model’s output with experimental data, iteratively adjusting the parameters to achieve the optimal fit.
For this study, methanol, ethanol, propanol, and water were chosen as reference hydroxyl compounds. The hybrid model’s coefficients were then determined for each of these substances. These calculated coefficients are presented in detail in Table 1 and the complex permittivity of hydroxyl materials is visualized in Figure 15.
Complex permittivity of hydroxyl materials extracted using the hybrid model: (a) real part and (b) imaginary part.

Comparison of dielectric relaxation parameters of hydroxyl compounds with existing literature

A logarithmic scale was used to plot the complex permittivity curve. Figure 15 suggests that water is more readily detectable due to its high permittivity, consequently exhibiting strong absorption of electromagnetic waves. This initial finding will be further validated in the following section.
A comparison of these results with existing literature data reveals a strong correlation and high accuracy between the values generated by the hybrid model and established reference values. This close agreement validates the hybrid model’s effectiveness and suitability for this analysis.
Analysis of the sensor’s performance
Once the electrical properties of the hydroxyl compound samples have been determined between 1 and 20 GHz, the sensor’s ability to identify and distinguish these compounds will be evaluated by placing the samples above it and analyzing its response. This analysis will determine the sensor’s effectiveness in differentiating the various hydroxyl compounds. Figures 16 and 17 provide a comprehensive visualization of the results, including the sensor response and its analysis.
Reflection coefficient for the detection of different hydroxyl samples: (a) S11 parameter and (b) S22 parameter.

Transmission coefficient for the detection of different hydroxyl samples.

It is clear from these figures that a distinct sensor response was observed for all tested hydroxyl compounds in both reflections (S11 and S22) and transmission (S21, S12), with reflection showing a stronger response.
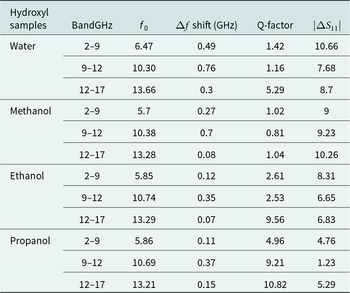
To evaluate the performance and sensitivity of the sensor, three key parameters will be analyzed. First, the Q-factor, a measure of resonance efficiency, will be calculated. Second, the sensor’s sensitivity will be evaluated by analyzing the resonant frequency shift (Δf). This involves determining the difference between the sensor’s resonant frequency with and without a target sample. Third, the change in the amplitude difference of the reflection coefficient (S11), denoted as |ΔS11|, will also be calculated. All three parameters will be evaluated within three frequency ranges of 2–9, 9–12, and 12–17 GHz, where the sensor’s resonant frequency is located at 8.6503, 11.072, and 13.368 GHz, as the results will exhibit greater clarity and contrast within this range. The results are clearly shown in Figures 18 and 19 and Table 2.
Reflection coefficient response of the sensor to hydroxyl samples: (a) 2–9 GHz, (b) 9–12 GHz, and (c) 12–17 GHz.

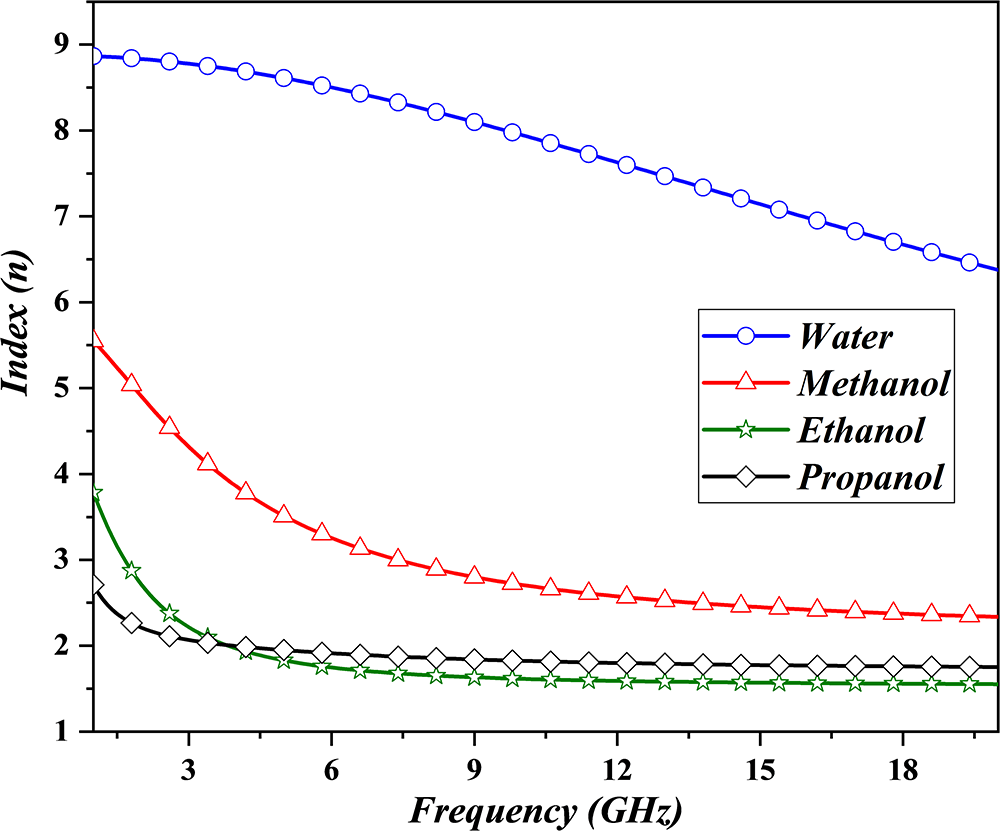
The real part of refractive index of hydroxyl compounds.

Sensor performance evaluation based on Q-factor and sensitivity (amplitude and frequency)

Among the hydroxyl compounds tested, water demonstrated the most substantial resonance-frequency shift (Δf), reaching a maximum of 0.76 GHz. In comparison, methanol exhibited a shift of 0.7 GHz, ethanol 0.35 GHz, and propanol 0.37 GHz. Notably, propanol displayed a high Q-factor (Q = 10.82) within the 12–17 GHz frequency band, resulting in a sharper and narrower resonance peak.
Regarding amplitude sensitivity, water exhibited a maximum variation of 10.66 dB, followed by methanol at 10.26 dB, ethanol at 8.31 dB, and propanol at 5.29 dB. While ethanol and propanol displayed nearly identical frequency shifts across all analyzed frequency bands, ethanol consistently demonstrated a greater amplitude sensitivity variation compared to propanol in most frequency bands, as shown in Figure 18.
We also observe that the range from 2 to 9 GHz is the optimal detection range, as all hydroxyl compounds showed a strong response to detection. This can be explained by the fact that the sensor exhibits higher efficiency in this range. This is due to the resonance frequency being at 8.6503 GHz, where the sensor, at this frequency, is characterized by regions with a high concentration of the electric field and electric current.
The resolution of the sensor is assessed using the FDR, as defined in [Reference Kiani, Rezaei, Navaei and Abrishamian13]. This parameter is expressed as:
 \begin{equation}FDR = \frac{{{f_1} - {f_2}}}{{\Delta {\varepsilon _r}}}\end{equation}
In this expression, ∆ɛr denotes the change in relative permittivity, while f 1 and f 2 correspond to the higher and lower resonance frequencies, respectively. Based on this definition, the sensor demonstrates an FDR of 6.75 MHz, meaning it can reliably detect frequency variations as small as 6.75 MHz.
Based on the obtained results, water exhibits the highest sensitivity for detection, followed by methanol, ethanol, and propanol. This order of sensitivity is attributed to the molecular properties of each compound, particularly their microwave absorption, dipole moments, and refractive indices.
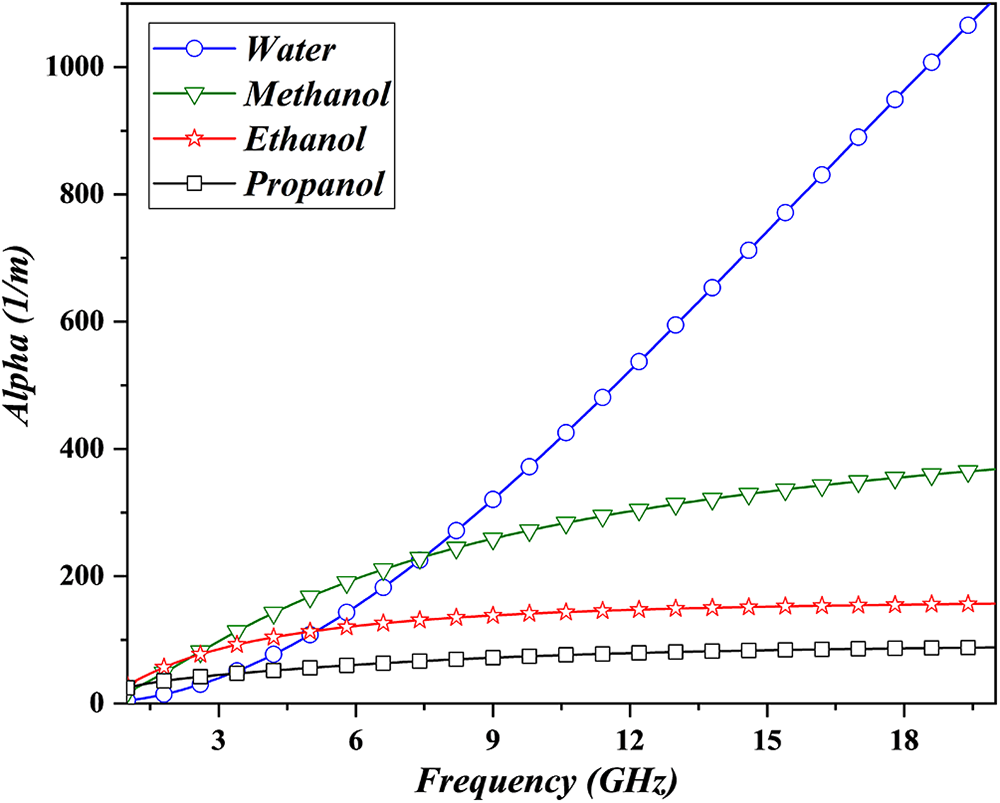
Methanol demonstrates relatively higher microwave absorption due to its simpler molecular structure and higher dipole moment is approximately 1.7 D compared to ethanol (1.69 D and propanol (1.68 D) [Reference Jorge, Gomes and Barrera27] plays a significant role. This indicates that methanol molecules interact more strongly with the electric field of microwave radiation, resulting in greater energy absorption and a stronger detection response, as shown in Figure 19.
Ethanol and propanol, on the other hand, possess longer carbon chains (ethanol: C2H5OH, propanol: C3H7OH), which increase the complexity of their molecular structures. These longer chains influence the molecules’ vibrational and rotational dynamics, leading to distinct absorption and refraction behaviors (see Figures 19 and 20). The extended carbon chains restrict the molecules’ ability to rotate freely in response to the electric field of microwave radiation, which diminishes their absorption compared to methanol.
The absorption coefficient of the hydroxyl compounds.

Additionally, each compound has unique refractive index values that vary with frequency. The refractive index, which measures how much electromagnetic waves slow down when passing through a material, influences the propagation and interaction of microwaves with the substance. A higher refractive index indicates greater wave slowdown and an increased likelihood of interaction with the material (Figure 19).
The results shown in Figure 21 provide a comprehensive visualization of the absorption behavior of various hydroxyl-based compounds across the microwave spectrum, plotted as a function of both refractive index and wavelength. As expected, water exhibits the strongest absorption in the microwave region. This is primarily attributed to its relatively high permanent molecular dipole moment (≈1.84 Debye) [Reference Clough, Beers, Klein and Rothman28], which enhances its interaction with oscillating electromagnetic fields. Additionally, the rotational and vibrational relaxation mechanisms associated with the O–H bonds in water contribute significantly to energy absorption, resulting in pronounced dielectric losses. These characteristics make water the most easily detectable substance among the tested hydroxyl compounds.
Absorption coefficient of hydroxyl materials as a function of refractive index and wavelength: (a) water, (b) methanol, (c) ethanol, and (d) propanol.

Ethanol, which contains both C–H and O–H bonds, shows a broader yet weaker absorption peak compared to water. Its dipole moment and rotational relaxation times differ from water, yielding a reduced but still notable microwave response.
Propanol, with an even lower dipole moment and heavier molecular structure, exhibits weaker absorption and slower relaxation dynamics. Both ethanol and propanol show similar refractive indices (approximately n ≃ 2) within the 6–20 GHz range, yet ethanol consistently presents a slightly higher absorption coefficient. This difference indicates that ethanol remains more responsive to microwave interrogation than propanol due to its shorter molecular chain and higher dipole-related interactions.
We have compared the performance of our sensor with several recent microwave-based sensors reported in literature. Table 3 summarizes the key metrics, including Q-factor, FDR, and measurement accuracy, based on the literature. Our sensor demonstrates a competitive frequency sensitivity, reaching approximately 0.76 GHz, along with a notable amplitude sensitivity of 10.66 dB. Additionally, it provides an FDR of 6.75 MHz and a measurement accuracy (measurement error ranging from 0.075 to 1.262) that is comparable to or exceeds that of recent studies.
Comparison of designed sensors with literature

Conclusion
This study presented the design and development of a metamaterial-based microwave sensor for the detection and classification of HOCs, addressing a critical gap in understanding their microwave detectability. The sensor was built using a CLL metamaterial unit cell with unique magnetic properties, operating across a broad frequency range of 1–20 GHz. Simulation and experimental measurements of S-parameters (S11, S22, S12, and S21) showed strong agreement, validating the sensor design. Three primary resonance points at 8.6503, 11.072, and 13.368 GHz were identified and served as the main indicators of sensor performance.
A key innovation of this work lies in correlating the microwave response to intrinsic molecular properties, including dipole moment, refractive index, and absorption characteristics, through a predictive, physics-based framework. By combining experimental measurements with molecular polarization and relaxation modeling using the Debye–Cole–Cole (Havriliak–Negami) hybrid model, the electrical properties of water, methanol, ethanol, and propanol were extracted and linked to frequency shifts and amplitude variations.
The findings offer a detailed depiction of the absorption characteristics of the examined hydroxyl compounds across the microwave frequency range, analyzed in relation to refractive index and wavelength. Water displayed the most pronounced absorption, which can be attributed to its relatively high permanent dipole moment (≈1.84 Debye) and the rotational and vibrational relaxation of its O–H bonds, both of which enhance energy uptake and lead to significant dielectric losses. As a result, water emerged as the most detectable compound, exhibiting a maximum frequency shift of 0.76 GHz and an amplitude variation of 10.66 dB. Ethanol, containing both C–H and O–H bonds, showed a broader yet less intense absorption peak, whereas propanol, characterized by a lower dipole moment and a heavier molecular structure, displayed the weakest absorption and slower relaxation processes. Interestingly, ethanol and propanol exhibited similar refractive indices (≈2) across the 6–20 GHz range, but ethanol consistently had a slightly higher absorption coefficient, indicating stronger interaction with the microwave field.
Propanol also demonstrated a high Q-factor (Q = 10.82), resulting in sharp and clearly defined resonance peaks. The sensor achieved an FDR of 6.75 MHz and a measurement error ranging from 0.075 to 1.262, underscoring its capability to detect subtle frequency changes with competitive sensitivity. Analysis indicated that the 2–9 GHz range is particularly favorable for detection, likely due to enhanced electric field intensity and current localization near the 8.6503 GHz resonance. These results confirm that both the sensor’s geometric design and the selection of resonance frequencies are critical factors in optimizing detection performance.
Issues such as calibration accuracy, environmental effects, and repeatability of measurements were addressed to ensure reliable operation. Overall, this study presents an innovative strategy that combines metamaterial-based sensor design with a physics-driven, predictive modeling framework, contributing to advancements in microwave sensing and diagnostic applications for chemical and biological systems.
Acknowledgement
The authors are grateful for the partial support provided by the Applied Science and Didactics Laboratory, Higher Normal School of Laghouat, Algeria.
Competing interests
The author(s) declare none.

Bensafieddine Djalal Eddine received his Ph.D. degree in Electrical Engineering from Amar Telidji University of Laghouat, Algeria, in 2019. He also holds a university habilitation degree. He is currently a teacher at the Higher Normal School of Laghouat, Algeria, and a member of the Applied Science and Didactics Laboratory. His research focuses on the design and analysis of metamaterials for various applications, including tunable and programmable devices, RF surface coils, optical metamaterials, and biosensors. His expertise also extends to the propagation of electromagnetic waves through periodic structures, metasurface antennas, smart materials, and electromagnetic bandgap materials. He has authored and co-authored numerous scientific publications in international peer-reviewed journals and conference proceedings.

Hocine Merah was born in Laghouat, Algeria, in 1986. He received his Ph.D. degree in Electrical Engineering from Amar Telidji University of Laghouat, Algeria, in 2020. He also holds a university habilitation degree. He is currently a teacher at the Higher Normal School of Laghouat and a member of both the Applied Science Laboratory and the Didactics Laboratory. His research interests include 5G and 6G wireless communications, antennas, PAPR signal processing, and optimization methods.

Hocine Nebair (born September 12, 1992, Laghouat, Algeria) received his Ph.D. degree in Material Physics from Amar Telidji University, Laghouat, Algeria, in 2023. He also holds university habilitation degrees. He is currently a teacher and Head of Physics Department at the Higher Normal School of Laghouat, Algeria, and a member of the Laboratory of Applied Science and the Didactics Laboratory. His work bridges experimental metallurgy and magnetic characterization methods of the materials, making it applicable to both academic research and industrial nondestructive testing.

Fatima Djerfaf is a Professor of Electrical Engineering at Amar Telidji University in Laghouat, Algeria (UATL). She obtained her Ph.D. degree in Electronics-Instrumentation (2012) from FERHAT Abbas in SÉTIF (Algeria), under the supervision of Professor Abdelaziz MERZOUKI, Professor Didier Vincent (Telecom Saint-Etienne – France) and Professor Stéphane Robert (Telecom Saint-Etienne – France). She was appointed as an Assistant Professor at UATL in the Electronic Department in 2006. She was promoted to Full Professor in 2020. She is a member of the Laboratory of Materials, Energetic Systems, Renewable Energy and Energy Management. She has made various contributions (chief of PRFU projects, supervisor of PhD thesis, publications, etc.). Her research focuses on the design and performance study of improved planar devices based on new composite materials for microwave, medical, and energy harvesting applications.

Saleh Mohsen Chaker received the B.Sc. degree in Electronics and Communications Engineering in 2010, the M.Sc. degree in Telecommunications and Networks in 2012, and the Ph.D. degree in Electronic Systems and Telecommunications in 2016, all from the University of Laghouat, Algeria. He is currently an Associate Professor in the Department of Electronics, Faculty of Technology, at the University of Laghouat and a member of the LTSS (Telecommunications, Signals and Systems) Laboratory. He also serves as the Program Coordinator of the Master’s Program in Networks and Telecommunications. He has actively participated in several international conferences and has published numerous research articles in international peer-reviewed journals and conference proceedings. His research interests include smart antennas, transmission lines, metamaterials for 5G and 6G applications, artificial intelligence in telecommunications, web technologies, cybersecurity, and the application of machine learning techniques in antenna design and modern communication systems.

Mouloud Bouzouad is a Professor at Amar Telidji University of Laghouat, Algeria, specializing in Communication Engineering. He is the head of the MetaTeam research group, focusing on the design and analysis of antennas, metamaterials, and advanced electromagnetic materials and their applications in several areas. His research interests also include microwave engineering, electromagnetic wave propagation, and antenna systems for sensing and communication applications. Prof. Bouzouad has authored and co-authored numerous scientific publications in international peer-reviewed journals and conference proceedings, contributing significantly to the development of antenna technologies and metamaterial-based devices.