


Obese patients typically show a pattern of dyslipidaemia characterised by high levels of fasting plasma TAG and NEFA and low levels of HDL-cholesterolReference Denke1, Reference Wajchenberg2. Those alterations have also been reported in obese children as main features of early onset of the metabolic syndrome (MS) associated with insulin resistanceReference Valle, Gascón, Martos, Ruz, Bermudo, Morales and Cañete3, Reference Weiss, Dziura and Burgert4.
Changes in plasma fatty acid composition reflect abnormalities in lipoprotein metabolism and dietary habits and have been widely studied in animals and obese adultsReference Rossner, Walldius and Bjorvell5–Reference Tremblay, Despres, Piche, Nadeau, Bergeron, Almeras, Tremblay and Lemieux9. There have also been some studies of children and adolescents that have analysed changes in plasma fatty acid composition of total plasma lipidsReference Agostoni, Riva, Bellu, Vincenzo, Grazia and Giovannini10, Reference Scaglioni, Verduci, Salvioni, Bruzzese, Radaelli, Zetterstrom, Riva and Agostoni11 and selected lipid fractions, i.e. phospholipids (PL) and cholesteryl esters (CE)Reference Decsi, Molnár and Koletzko12–Reference Klein-Platat, Drai, Oujaa, Schlienger and Simon15. However, contradictory results have been published by these studies of mixed child/adolescent and pre-teen adolescent populations, and it has been suggested that the investigation of differences related to puberty should focus on a homogeneous populationReference Scaglioni, Verduci, Salvioni, Bruzzese, Radaelli, Zetterstrom, Riva and Agostoni11. Reports of specific alterations in fatty acid profiles have differedReference Decsi, Molnár and Koletzko12–Reference Klein-Platat, Drai, Oujaa, Schlienger and Simon15, and only one study provided data on dietary intakesReference Scaglioni, Verduci, Salvioni, Bruzzese, Radaelli, Zetterstrom, Riva and Agostoni11, further hampering the interpretation of results. Finally, data are only expressed in percentages and no attempt has been made to quantify changes in fatty acid concentrations; therefore there may be some relevant alterations that escape detection. There are no studies in prepubertal children about changes in plasma fatty acids and plasma lipid fractions and their postprandial behaviour in relation to obesity, except for a recent paper by our group on the postprandial response of trans fatty acids in prepubertal obese children that is based on the same population as the present reportReference Larque, Gil-Campos, Ramirez-Tortosa, Linde, Canete and Gil16.
Over the past few years, there have been marked changes in the dietary habits of children in both developed and developing countries, with increases in total energy, fat and sugar consumptionReference Haslam and James17–Reference Cruz, Shaibi, Weigensberg, Spruijt-Metz, Ball and Goran19. We hypothesised that an energy-rich diet might have a negative effect by increasing plasma fatty acid concentrations and leading to an altered fatty acid profile in lipid fractions.
The aim of the present study was to evaluate the fatty acid composition and profile of plasma and its fractions (PL, CE, TAG and NEFA) in obese prepubertal children compared with normal-weight prepubertal children under fasting conditions. Since clearance of lipids might be affected in early childhood obesity, we also assessed the postprandial plasma fatty acid profile during 3 h after intake of a standardised breakfast.
Subjects and methods
Study population
We studied fifty-four Caucasian children, of which thirty-four were obese and twenty had normal weight. All were selected from children referred to our Paediatric Endocrinology Unit. Inclusion criteria were: apparent good state of health, age between 6 and 12 years, and classification as prepubertal (Tanner 1) based on Tanner criteriaReference Tanner20 and validated by appropriate plasma sex hormone concentrations. Children on a restrictive diet were excluded. The groups (obese and normal weight) were matched for age and sex. Children were classified as obese if their BMI exceeded the 97th percentile for their age and sex defined according to Spanish standards (BMI Z score ≥ 2·0)Reference Hernández, Castellet, Narvaiza, Rincón, Ruiz, Sánchez, Sobradillo and Zurimendi21. Children were classified as normal weight if their BMI was higher than the 5th and lower than the 75th percentileReference Hernández and Pombo22. Children were only included in the normal-weight group if examination verified absence of disease, including low height and thyroid conditions. The anthropometric characteristics of the subjects have been previously reportedReference Larque, Gil-Campos, Ramirez-Tortosa, Linde, Canete and Gil16.
Exclusion criteria for both groups were: presence of pubertal development, disease, or malnutrition, use of medication that alters blood pressure or glucose or lipid metabolism, history in the past 1 year of a long rest period or consumption of hypoenergetic diets.
The study was approved by the Human Investigation and Ethics Committees of the University of Granada and the Reina Sofia University Hospital of Cordoba (Spain). Written informed consent was obtained from parents and verbal approval from children.
Dietary assessment and dietary intervention
Children and parents were interviewed on an individual basis to obtain valuable information on lifestyle and dietary habits. Dietary intake was estimated by means of a previously validated FFQ and 72 h dietary survey using a database for the composition of Spanish foodsReference Martínez-Victoria and Mañas23. Both obese and normal-weight children received a standardised breakfast at 09:00 hours. The composition of the breakfast has been previously describedReference Larque, Gil-Campos, Ramirez-Tortosa, Linde, Canete and Gil16 and contained 200 ml milk, 10 g sugar, 18 g cocoa, 10 g butter, 30 g toasted bread and 20 g jam, providing 1084 kJ (259 kcal) from carbohydrates (59 % of the breakfast energy), 163 kJ (39 kcal) from proteins (9 % of energy) and 582 kJ (139 kcal) from lipids (32 % of the energy).
Sampling
Baseline blood samples were obtained from children while they were fasting, using an indwelling venous line to measure levels of glucose, insulin, sex hormones (follicle-stimulating hormone, luteinising hormone, oestradiol and testosterone), lipids, total fatty acids (TFA) and fatty acid profile in lipid fractions. Blood samples were also taken postprandially at 1, 2 and 3 h after receiving the standardised breakfast for determination of plasma fatty acids. All samples were processed within 2 h of sampling and divided into samples for immediate analysis or long-term storage at − 80°C until their analysis.
Biochemical analysis
Glucose was analysed by the glucose oxidase method using an automatic analyser (CV 1 %) (Roche-Hitachi Modular PyD Autoanalyser; Roche Laboratory Systems, Mannheim, Germany), and plasma insulin was analysed by RIA (CV 2·6 %) using an automatic analyser for microparticles (Axsym; Abbott Laboratories, Chicago, IL, USA). Insulin resistance was calculated by using the homeostasis model assessment (HOMA) index, as defined by the equation HOMA = fasting glucose (G0) (mm) × fasting insulin (I0) (μU/ml)/22·5Reference Matthews, Hosker, Rudenski, Naylor, Treacher and Turner24. Tissue insulin sensitivity were calculated by using the quantitative insulin sensitivity check index (QUICKI), as defined by the equation QUICKI = 1/(log I0+log G0)Reference Katz, Nambi, Mather, Baron, Follmann, Sullivan and Quon25. Sex hormones (follicle-stimulating hormone, CV 3·6 %; luteinising hormone, CV 3·1 %; testosterone, CV 2 %; oestradiol, CV 1·8 %) were measured by chemiluminescence using an automatic analyser (Architet I4000; Abbott Laboratories, Chicago, IL, USA). Plasma TAG (CV 1·5 %), HDL-cholesterol (CV 0·8 %) and apo B (CV 1·0 %) were measured by means of an automatic analyser (Roche-Hitachi Modular PyD Autoanalyser; Roche Laboratory Systems).
Isolation of plasma lipids and separation of lipid fractions
For analysis of the total plasma fatty acid profile, total lipids from 0·1 ml plasma were extracted into hexane–isopropanol (4 : 1) after addition of 250 μl tridecanoyl acid (0·2 g/l) (13 : 0) as internal standard, as previously describedReference Larqué, Demmelmair, Berger, Hasbargen and Koletzko26.
For analysis of the fatty acid profile in lipid fractions, isolation of total plasma lipids was performed according to Kolarovic & FournierReference Kolarovic and Fournier27, and plasma was spiked with an internal standard mixture of TAG, PL, CE and NEFA. Briefly, 0·5 ml plasma plus 0·5 ml water were vortexed for 30 s with 100 μl of internal standard (tripentadecanoyl glycerol (TAG, 15 : 0, 0·625 g/l); dipentadecanoyl choline (PL, 17 : 0, 0·857 g/l), heptadecanoyl cholesterol (CE, 17 : 0, 1·0 g/l) and pentadecanoic acid (15 : 0, 0·05 g/l), all dissolved in chloroform). Then 4 ml hexane–2-propanol (3 : 2, v/v) with butylated hydroxytoluene (25 mg/l) were added and centrifuged for 10 min (4°C) at 1500 g. The organic layer was then moved to another glass tube and the extraction process was repeated three more times with the remnant hydrophilic layer. The organic layer was evaporated to dryness under vacuum. The isolated lipids were dissolved into 200 μl hexane–methyl-tert-butyl-ether–acetic acid (100 : 3 : 0·3, by vol.).
TAG, PL, CE and NEFA fractions were separated by using aminopropyl columns (SepPak Cartridges; Waters, Milford, MA, USA), as described elsewhereReference Agren, Julkunen and Penttila28. Fractions obtained from the columns were evaporated to dryness under vacuum and 100 μl hexane were added to each tube. This method yields 96–100 % recovery of lipid fractions.
Quantification of fatty acids in total plasma lipids and plasma lipid fractions
Synthesis of fatty acid methyl esters from total plasma lipids was performed with 3 m-methanolic HCl (Supelco, Bellafonte, PA, USA) at 85°C for 45 min; derivatives were extracted into hexane and stored at − 20°C until gas chromatographic analysis. Fatty acid methyl esters from total plasma lipids were analysed by GLC using an SP-2560 fused silica capillary column (100 m × 0·25 mm internal diameter, 20 μm film thickness; Supelco, Bellefonte, PA, USA) in a Hewlett-Packard 5890 gas chromatograph. The oven temperature was programmed for 39 min at 175°C and increased at 3°C per min to 230°C for 14 min. The carrier gas used was He at a pressure of 42 pounds per square inch. Peaks were identified by comparison of their retention times with appropriate fatty acid methyl ester standards purchased from Sigma Chemical Company (Urbana, IL, USA). For the calculation of the total plasma fatty acid concentrations, we used the relative response factors relative to the fatty acid 13 : 0 (internal standard); these relative response factors were close to 1 (1·030 (sd 0·180)) and ranged from 0·882 for 18 : 0 to 2·050 for 18 : 3n-6.
Fatty acid methyl esters from plasma lipid fractions were formed as previously reportedReference Lepage and Roy29. Briefly, hexane extracts were dissolved into 2 ml methanol–benzene (4 : 1, v/v) and butylated hydroxytoluene (9 μmol/l) was added to samples as an antioxidant. Then 200 μl acetyl chloride were slowly added, and tubes were then closed and subjected to methanolysis at 100°C for 1 h. After tubes were cooled in water, 5 ml 0·43 m-K2CO3 solution was slowly added to stop the reaction and neutralise the mixture. Tubes were then shaken and centrifuged, and the benzene upper phase was removed and transferred to another glass tube to be dried under N2 and re-suspended to 100 μl with hexane. A Model HP-5890 Series II GLC (Hewlett Packard, Palo Alto, CA, USA) equipped with a flame ionisation detector was used to analyse fatty acids. Chromatography was performed using a capillary column of 60 m length, 0·32 mm internal diameter and 0·20 μm thickness impregnated with Sp™ 2330 FS (Supelco Inc., Bellefonte, PA, USA). The injector and detector were maintained at 250 and 275°C respectively; N2 was used as the carrier gas, and the split ratio was 29 : 1. Temperature programming (for a total time of 40 min) was as follows: initial temperature, 160°C for 5 min, 2°C per min to 190°C, 3°C per min to 220°C, 15°C per min to 230°C, hold for 12 min, 14°C per min to 160°C.
The response factors used were those relative to the fatty acid 15 : 0 (internal standard) for TAG, phospholipids and NEFA, and to the fatty acid 17 : 0 (internal standard) for cholesteryl esters these factors were close to 1 (1·050 (sd 0·10)) and ranged from 0·940 for 24 : 0 to 1·250 for 22 : 6n-3.
Statistical analysis
Data are expressed as mean values with their standard errors. Variables that did not follow a normal distribution (TAG, insulin, HOMA and fatty acid percentages) were log-transformed before analysis. Comparisons of socio-demographic and clinical variables and dietary fatty acid intakes between obese and control children, adjusted for age and sex, were assessed with general linear models of variance. The general linear model of variance for repeated measurements was used to evaluate the effects of the two sources of variation in the study: obesity × postprandial time. To evaluate specific mean differences among different postprandial times, post hoc comparisons using Bonferroni tests were performed. P < 0·05 was considered significant. Since no effect was observed for sex, fatty acid results for both sexes were pooled. Multivariable logistic regression models were performed to identify fatty acids significantly related to the likelihood of being obese. Correlations between variables were assessed using Pearson's correlation coefficients. Associations of fatty acid variables with those considered in definitions of obesity and insulin resistance were analysed for the obese children by multivariable linear regression models. Analyses were performed using the software program SPSS version 13.0 (SPSS Inc., Chicago, IL, USA).
Results
Anthropometric, metabolic and dietary evaluation
The demographic data and anthropometric characteristics of the subjects have been previously reportedReference Larque, Gil-Campos, Ramirez-Tortosa, Linde, Canete and Gil16. Obese children presented a significantly higher BMI than controls (BMI 29 (sem 1) v. 17 (sem 1) kg/m2; BMI Z score 4·05 (sem 0·30) v. − 0·99 (sem 0·39)), as well as tricipital and subscapular skinfolds (26·1 (sem 0·8) v. 8·7 (sem 1) mm and 30·2 (sem 1·1) v. 6·7 (sem 1) mm) and waist:hip ratio compared with normal-weight children (0·93 (sem 0·02) v. 0·89 (sem 0·03)). In addition, TAG (0·98 (sem 0·07) v. 0·60 ((sem 0·06) mmol/l), apo B (744 (sem 31) v. 619 (sem 17) mg/l), insulin (97·72 (sem 10·69) v. 40·97 (sem 5·60) pmol/l) and HOMA values (2·86 (sem 0·32) v. 1·30 (sem 0·19)) were significantly higher in obese children, whereas HDL-cholesterol (0·15 (sem 0·01) v. 0·18 (sem 0·01) mmol/l) and quantitative insulin sensitivity check index (QUICKI; 0·34 (sem 0·01) v. 0·41 (sem 0·02)) were lower. However, fasting glucose concentrations (4·78 (sem 0·08) v. 4·99 (sem 0·12) mmol/l) did not differ between groupsReference Larque, Gil-Campos, Ramirez-Tortosa, Linde, Canete and Gil16. On the other hand, systolic blood pressure and diastolic blood pressure were higher in obese than in normal-weight children (systolic blood pressure 110 (sem 3) v. 95 (sem 1) mmHg; diastolic blood pressure 60 (sem 2) v. 49 (sem 2) mmHg).
Obese children had a significantly higher absolute daily intake of energy and all major nutrients v. normal-weight children; nevertheless, both obese and normal-weight children had a similar energy distribution of nutrientsReference Larque, Gil-Campos, Ramirez-Tortosa, Linde, Canete and Gil16. Likewise, the percentages by energy of dietary saturated, monounsaturated and polyunsaturated fat intakes did not significantly differ between groups (saturated fat 13·5 (sem 0·6) v. 14·4 (sem 0·8) %; monounsaturated fat 20·8 (sem 1·1) v. 19·3 (sem 1·6) %; polyunsaturated fat 6·8 (sem 0·6) v. 5·6 (sem 0·8) %).
Plasma fatty acids
Table 1 shows plasma fatty acid concentrations at fasting and at 1, 2 and 3 h after intake of standardised breakfast in obese and normal-weight children. Compared with normal-weight children, obese children had significantly higher concentrations, at all measurement time points, of 14 : 0, 16 : 0, 16 : 1n-7, 18 : 0, 18 : 1n-9, 18 : 2n-6, 18 : 3n-3, 20 : 2n-6, 20 : 3n-6, 20 : 5n-3 and 22 : 6n-3, whereas 20 : 4n-6 and 22 : 4n-6 did not differ. Concentrations of 16 : 1n-7, 18 : 0, 18 : 1n-9 and 20 : 2n-6 showed a significantly different time-course in normal-weight v. obese children, characterised by a significant decrease between the 2nd and 3rd hour in the former (Table 1).
(Mean values with their standard errors)
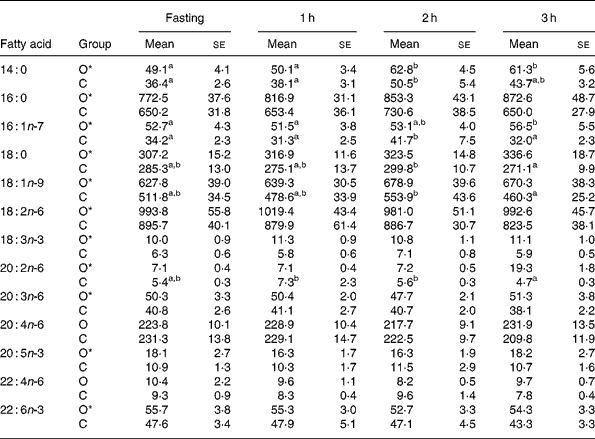
a,b Mean values within a row with unlike superscript letters were significantly different (P < 0·05 for postprandial time).
* Mean values were significantly different between obese and controls (P < 0·05).
† The selected fatty acids summed more than 95 % of the total fatty acids analysed.
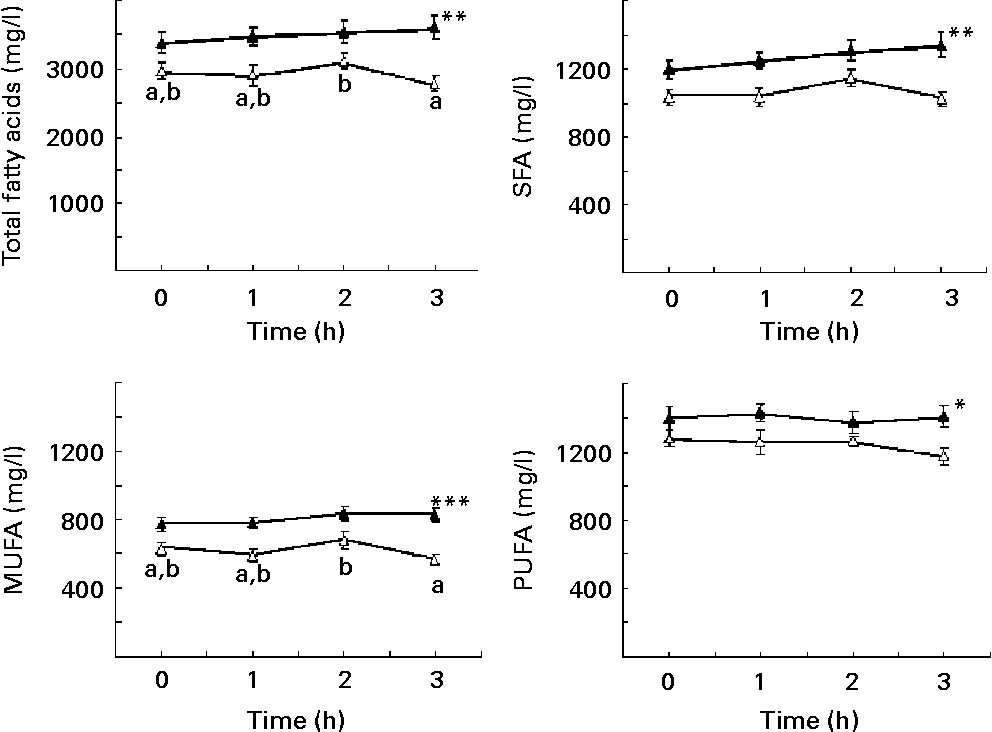
TFA, SFA, MUFA and PUFA showed significantly higher concentrations in obese than in control children (Fig. 1). TFA and MUFA decreased between the 2nd and 3rd hour in normal-weight children but not in obese; a similar behaviour was seen for SFA and PUFA, although in these two cases the differences between the 2nd and 3rd hour for normal-weight children were only marginally significant (SFA, P = 0·053; PUFA, P = 0·065) (Fig. 1).
Plasma concentrations of total fatty acids (A), SFA (B), MUFA (C) and PUFA (D) in prepubertal obese (▲; n 34) and normal-weight (Δ; n 20) children, adjusted for sex, under fasting conditions and at 1, 2 and 3 h after intake of a standardised breakfast. Total fatty acids is the sum of SFA, MUFA and PUFA. SFA is the sum of 6 : 0, 8 : 0, 10 : 0, 12 : 0, 14 : 0, 15 : 0, 16 : 0, 17 : 0, 18 : 0 and 24 : 0. MUFA is the sum of 16 : 1n-7, 18 : 1n-9, 20 : 1n-9, 22 : 1n-9 and 24 : 1n-9. PUFA is the sum of n-6 PUFA (18 : 2n-6, 18 : 3n-6, 20 : 2n-6, 20 : 3n-6, 20 : 4n-6, 22 : 4n-6 and 22 : 5n-6) and n-3 PUFA (18 : 3n-3, 18 : 4n-3, 20 : 5n-3, 22 : 5n-3 and 22 : 6n-3). Values are means, with their standard errors represented by vertical bars. Mean value was significantly different from that of the control children: *P < 0·05, **P < 0·01, ***P < 0·001. a,bMean values with unlike letters were significantly different for time (P < 0·05).
In fasting conditions the proportion of each plasma fatty acid and the proportions of SFA, MUFA and PUFA were mostly unaffected (results not shown), with the exception of palmitoleic acid of the n-7 series (16 : 1n-7) (obese children 1·55 (sem 0·10) v. normal-weight children 1·16 (sem 0·06)), α-linolenic acid (18 : 3n-3) (obese children 0·29 (sem 0·02) v. normal-weight children 0·21 (sem 0·02)) and eicosadienoic acid (20 : 2n-6) (obese children 0·21 (sem 0·01) v. normal-weight children 0·18 (sem 0·01)), which were elevated in obese children (P < 0·05), and stearic acid (18 : 0) (obese children 9·05 (sem 0·14) v. normal-weight children 9·64 (sem 0·17)), which was lower in the obese children (P < 0·05), who also showed a marginally lower (P = 0·066) proportion of arachidonic acid (20 : 4n-6) (obese children 6·78 (sem 0·29) v. normal-weight children 7·85 (sem 0·38)).
Compared with normal-weight children, all fatty acid concentrations in TAG were elevated in obese children with the exception of 18 : 0, 18 : 3n-3, 20 : 4n-6 and n-3 PUFA (Table 2). However, no differences between groups were found for fatty acid concentrations in PL or CE (Table 2). In contrast, TFA, SFA and MUFA were significantly higher in the NEFA fraction of normal-weight children (Table 3). Nevertheless, the proportions of major fatty acid classes (i.e. SFA, MUFA and PUFA, in TAG, PL, CE and NEFA) did not significantly differ between obese and control children (results not shown).
(Mean values with their standard errors)
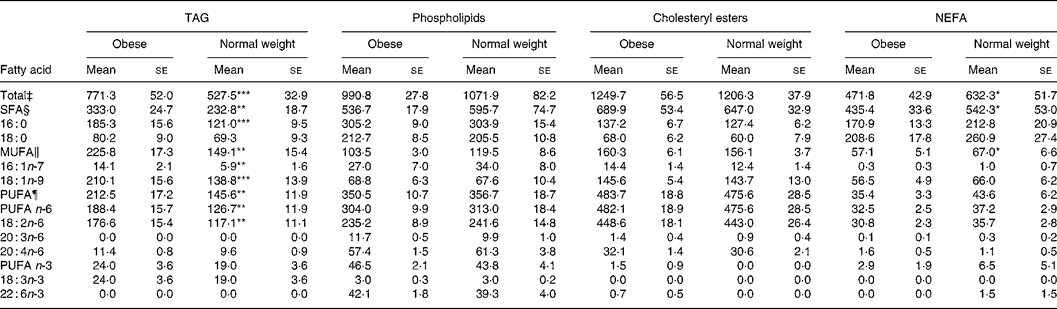
Mean value was significantly different from that of the obese children: *P < 0·05, **P < 0·01, ***P < 0·001.
† The selected fatty acids summed more than 95 % of the total fatty acids analysed. Not all minor fatty acids appeared in all lipid fractions.
‡ Sum of SFA, MUFA and PUFA.
§ Sum of 6 : 0, 8 : 0, 10 : 0, 12 : 0, 14 : 0, 15 : 0, 16 : 0, 17 : 0, 18 : 0 and 24 : 0.
‖ Sum of 16 : 1n-7, 18 : 1n-9 and 24 : 1n-9.
¶ Sum of n-3 PUFA (18 : 3n-3, 20 : 3n-3, 20 : 5n-3 and 22 : 6n-3) and n-6 PUFA (18 : 2n-6, 18 : 3n-6, 20 : 2n-6, 20 : 3n-6, 20 : 4n-6 and 22 : 4n-6).
Relationships between plasma fatty acids and selected variables associated with obesity and the insulin resistance syndrome (Pearson correlations)
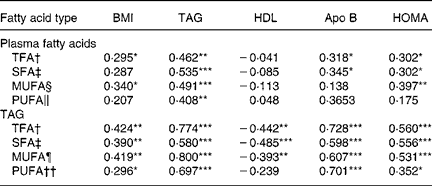
HOMA, homeostasis model assessment index; TFA, total fatty acids.
Pearson correlation significance: *P < 0·05, **P < 0·01, ***P < 0·001.
† Sum of SFA, MUFA and PUFA.
‡ Sum of 6 : 0, 8 : 0, 10 : 0, 12 : 0, 14 : 0, 15 : 0, 16 : 0, 17 : 0, 18 : 0 and 24 : 0.
§ Sum of 16 : 1n -7, 18 : 1n - 9, 20 : 1n - 9, 22 : 1n - 9 and 24 : 1n - 9.
‖ Sum of n -6 PUFA (18 : 2n - 6, 18 : 3n - 6, 20 : 2n - 6, 20 : 3n - 6, 20 : 4n - 6, 22 : 4n - 6, 22 : 5n - 6) and n - 3 PUFA (18 : 3n - 3, 18 : 4n - 3, 20 : 5n - 3, 22 : 5n - 3 and 22 : 6n - 3).
¶ Sum of 16 : 1n - 7, 18 : 1n - 9 and 24 : 1n - 9.
†† Sum of n - 6 PUFA (18 : 2n - 6, 18 : 3n - 6, 20 : 2n - 6, 20 : 3n - 6, 20 : 4n - 6 and 22 : 4n - 6) and n - 3 PUFA (18 : 3n - 3, 20 : 3n - 3, 20 : 5n - 3 and 22 : 6n - 3).
Relationships between plasma fatty acid concentrations, obesity and insulin resistance
After adjustment for sex and age, each 0·9 unit increase in the concentration of total plasma 16 : 1n-7 was positively associated with a significant increase in the risk of obesity (OR 2·46 (95 % CI 1·30, 4·66); P = 0·006). Likewise, each half-unit decrease in the proportion of 20 : 4n-6 in plasma lipids was associated with a significant increase in the risk of obesity (OR 0·62 (95 % CI 0·40, 0·97); P = 0·038).
Table 3 shows the Pearson correlation coefficients adjusted by age and sex for the relationships between fasting TFA, SFA, MUFA and PUFA concentrations in plasma lipids and TAG and selected variables associated with obesity and insulin resistance. TFA and MUFA concentrations in total plasma lipids and TFA, SFA, MUFA and PUFA concentrations in TAG were positively associated with BMI. Likewise, TFA, SFA, MUFA and PUFA in plasma lipids were positively associated with TAG. As expected, these fatty acid indices in TAG also correlated positively with plasma TAG. In contrast, TFA, SFA, MUFA and PUFA in TAG but not in total plasma lipids were inversely associated with HDL-cholesterol. All of these fatty acid indices were positively associated with apo B and HOMA except for MUFA and PUFA in total plasma lipids.
Backward stepwise multiple linear regression models were used to test whether TFA, SFA, MUFA and PUFA concentrations in total plasma lipids were associated with BMI, systolic blood pressure, TAG, HDL-cholesterol, apo B and HOMA. TFA was independently associated with TAG (R 0·545; P = 0·001) and HDL-cholesterol (R 0·477; P = 0·001). Both SFA and PUFA were associated with TAG (SFA, R 0·594, P < 0·001; PUFA, R 0·452, P = 0·010), HDL-cholesterol (SFA, R 0·471, P = 0·001; PUFA, R 0·455, P = 0·0040) and apo B (SFA, R 0·311, P < 0·031; PUFA, R 0·344, P = 0·033), whereas MUFA was independently associated with TAG (R 0·536; P < 0·001).
Discussion
The present study shows that obese prepubertal children have an altered plasma fatty acid composition under both fasting and postprandial conditions, mainly related to an increase in fatty acids in plasma TAG and an alteration of their fatty acid profile. The obese children also exhibited a lower clearance of plasma fatty acids compared with the normal-weight children. In addition, TFA, SFA, MUFA and PUFA plasma concentrations were independently related to BMI and some metabolic features of the so-called insulin resistance syndrome. Moreover, the concentration of 16 : 1n-7 in total plasma lipids was positively associated with obesity, whereas the proportion of 20 : 4n-6 was inversely associated with this condition.
Besides measuring the proportions of fatty acids in total plasma and its lipid fractions, as usual in previous studies on obesity in children and adolescentsReference Agostoni, Riva, Bellu, Vincenzo, Grazia and Giovannini10–Reference Klein-Platat, Drai, Oujaa, Schlienger and Simon15, we also determined their concentrations. This methodology was previously used to evaluate the effects of dietary long-chain PUFA supplementation in animals and childrenReference Ramírez, Gallardo, Souto, Weissheimer and Gil30, Reference Amate, Gil and Ramirez31 and to assess metabolic and dietary changes in adults with liver and intestinal inflammatory diseasesReference Cabré, Periago, Abad-Lacruz, Gil, González-Huix, Sánchez-Medina and Gassull32, Reference Esteve, Ramírez and Fernández-Bañares33. In addition, we separated the plasma lipid fractions by means of liquid chromatography, which prevents losses associated with TLC, which was used in other studiesReference Agostoni, Riva, Bellu, Vincenzo, Grazia and Giovannini10, Reference Decsi, Molnár and Koletzko12–Reference Klein-Platat, Drai, Oujaa, Schlienger and Simon15.
Obesity causes marked dyslipidaemia, leading to increased hepatic synthesis and altered peripheral tissue utilisation of TAG and concomitant alterations in lipoproteins, for which PL, CE and TAG are the main lipid componentsReference Weiss, Dziura and Burgert4, Reference Reaven34, Reference Reaven35. Moreover, dietary alterations are commonly observed in obese childrenReference Speiser, Rudolf and Anhalt18, Reference Cruz, Shaibi, Weigensberg, Spruijt-Metz, Ball and Goran19, which may also affect plasma fatty acid composition. Hence, an absence of changes in the proportion of fatty acids in a particular lipid fraction does not rule out important alterations in their concentrations.
Although obese prepubertal children exhibit a certain degree of insulin resistance, the obese children in the present study had a lower capacity for clearing circulating fatty acids after the intake of a meal, which may contribute to the pathogenesis of obesity and to the development of cardiovascular co-morbidities. In a recent study of the same obese population, our group found that plasma levels of trans-fatty acids remained higher in obese v. normal-weight children at 3 h after a mealReference Larque, Gil-Campos, Ramirez-Tortosa, Linde, Canete and Gil16. The impaired clearance of fatty acids appears to be associated with TAG concentrations because NEFA was lower in obese children, suggesting that baseline lipolysis in childhood obesity remains sensitive to the suppressive effects of insulin, and the concentration of fatty acids in PL and CE were unchanged. Indeed, hypertriacylglycerolaemia is a well-known factor in the development of atherosclerosis in humansReference Ramirez-Tortosa, Suarez, Gomez, Mir, Ros, Mataix and Gil36.
A number of studies in animal models of obesity and human obese adults have shown changes in fatty acid proportions for total plasma lipids and plasma lipid fractionsReference Rossner, Walldius and Bjorvell5, Reference Phinney, Tang, Thurmond, Nakamura and Stern6, Reference Vessby8, Reference Tremblay, Despres, Piche, Nadeau, Bergeron, Almeras, Tremblay and Lemieux9, Reference Phinney, Davis, Johnson and Holman37, Reference Kunesova, Hainer, Tvrzicka, Phinney, Stich, Parizkova, Zak and Stunkard38. In severely obese adult patients, the most marked differences were reduced percentages of 18 : 2n-6 in TAG, CE and PL with reciprocal increases in 16 : 0 and 16 : 1n-7 in TAG and CEReference Rossner, Walldius and Bjorvell5. Likewise, a lower percentage of 20 : 4n-6 in PL was reported in moderate obesityReference Phinney, Davis, Johnson and Holman37. However, data on fatty acid status in obese children and adolescents are controversialReference Agostoni, Riva, Bellu, Vincenzo, Grazia and Giovannini10–Reference Klein-Platat, Drai, Oujaa, Schlienger and Simon15.
In the present study, the higher concentrations of most fatty acids in total plasma lipids under fasting conditions can be explained by the increase in TAG concentration and changes in the fatty acid pattern of TAG associated with an insulin-mediated alteration in metabolic status that takes place in prepubertal children. The present results confirm previous reports in obese prepubertal children of high plasma TAG levels associated with hyperinsulinaemiaReference Valle, Gascón, Martos, Ruz, Bermudo, Morales and Cañete3, Reference Weiss, Dziura and Burgert4 but differ in part from previously published reports in children and adolescents of changes in the fatty acid composition of total plasma lipidsReference Agostoni, Riva, Bellu, Vincenzo, Grazia and Giovannini10, Reference Scaglioni, Verduci, Salvioni, Bruzzese, Radaelli, Zetterstrom, Riva and Agostoni11 and plasma lipid fractionsReference Decsi, Molnár and Koletzko12–Reference Klein-Platat, Drai, Oujaa, Schlienger and Simon15. A study of a mixed population of severely obese children and adolescents (age 13.8 ± 1.1 years) described a higher proportion of 20 : 4n-6 in PL and CE, of 20 : 3n-6 in PL, CE and TAG, and of 18 : 3n-6 in CE, with no changes in 18 : 2n-6 in any lipid fractionReference Decsi, Molnár and Koletzko12, Reference Decsi, Molnar and Koletzko13. The same authors, in a study of pubertal children (median Tanner stages between 3 and 5), found that obese children with some MS features had lower proportions of 18 : 2n-6 in PL and higher proportions of 20 : 3n-6 in PL and 18 : 3n-6 in CE compared with obese children without the MS and normal-weight childrenReference Decsi, Csabi, Torok, Erhardt, Minda, Burus, Molnar and Molnar14. In a population of overweight pre-teen adolescents, however, those with the MS had a higher proportion of SFA and lower proportion of 22 : 6n-3 in plasma PL and CE and a lower proportion of 18 : 2 n-6 and higher proportion of 16 : 1n-7 in PL and CEReference Klein-Platat, Drai, Oujaa, Schlienger and Simon15. A recent case–control study of children aged 8–12 years with moderate obesity (BMI Z score of 2·09), which did not record the Tanner stage of the population, has added to the controversy by reporting lower percentages of total PUFA, n-6 PUFA and higher total MUFA, 18 : 3n-3 and 20 : 5n-3 in obese childrenReference Scaglioni, Verduci, Salvioni, Bruzzese, Radaelli, Zetterstrom, Riva and Agostoni11.
Contradictory results for differences in the fatty acid composition of total plasma and lipid fractions may be due to differences in the pubertal stage, metabolic status, dietary habits of the study populations, inter-individual differences and variations in analytical methodology. The present study only included children in the prepubertal Tanner 1 stage. Moreover, although the obese children consumed more nutrients compared with the control children, their diet was rich in MUFA and relatively low in SFA and PUFA, and the proportions of saturated, monounsaturated and polyunsaturated fat were fairly similar between the groups. In contrast, the diet of the children in the Scaglioni study had a higher content of SFA and PUFAReference Scaglioni, Verduci, Salvioni, Bruzzese, Radaelli, Zetterstrom, Riva and Agostoni11.
In the present study, the concentration and proportion of 16 : 1n-7 was elevated in TFA and in the TAG lipid fraction in obese children. Since 16 : 1n-7 is unusual in the human dietReference Phinney39 it appears that it must be synthesised by enhanced activity of Δ-9 fatty acid desaturase. In fact, a significantly higher activity and expression of this enzyme has been observed in the liver of obese animalsReference Hu, Qing and Chen40, Reference Sampath and Ntambi41. Other studies reported significantly higher proportions of 16 : 1n-7 in PL and CE of obese adolescents with the MSReference Decsi, Molnar and Koletzko13, Reference Decsi, Csabi, Torok, Erhardt, Minda, Burus, Molnar and Molnar14. This fatty acid was associated with the risk of obesity in the present series, suggesting that 16 : 1n-7 is an early marker of lipid metabolic changes related to this disease.
It has been speculated that the activity of Δ-6 fatty acid desaturaseReference Decsi, Molnár and Koletzko12 and of Δ-5 and Δ-4 would be enhanced in childhood obesityReference Agostoni, Riva, Bellu, Vincenzo, Grazia and Giovannini10. However, the present results do not support this hypothesis, since the proportion of 20 : 4 n-6 tended to be lower in total plasma lipids of the obese children and proportions of 20 : 4n-6, 20 : 5n-3 and 22 : 6n-3 were unaffected in CE and PL. Moreover, a decrease in the proportion of 20 : 4n-6 in the obese children was independently associated with the risk of obesity.
In adults, central obesity has been positively correlated with percentages of long-chain PUFA of the n-6 series and inversely associated with n-3 long-chain PUFA, which is negatively correlated with apo B and plasma TAGReference Garaulet, Pérez-Llamas, Pérez- Ayala, Martínez, Sánchez de Medina, Tébar and Zamora7. Likewise, the risk of the MS was associated with an increase in the PUFA:SFA ratio in PL in a population of overweight pre-teen adolescentsReference Klein-Platat, Drai, Oujaa, Schlienger and Simon15. In the present study, plasma TFA and SFA were significantly correlated with TAG, apo B and HOMA, which are known features of the MS, whereas MUFA were correlated with BMI, TAG and HOMA. Similarly, all major fatty acid classes in TAG were positively associated with BMI, apo B and HOMA and were inversely associated with HDL-cholesterol, confirming elevated plasma TAG as a key factor in the early onset of the MS in childhood obesity. Tremblay et al. Reference Tremblay, Despres, Piche, Nadeau, Bergeron, Almeras, Tremblay and Lemieux9 reported in adult men that the fatty acid content of plasma TAG was associated with many metabolic variables of the insulin resistance syndrome independently of body fat mass or visceral adipose tissue accumulation. Nevertheless they did not evaluate the relationships between fatty acids in other plasma lipid fractions and the variables associated with the MS. On the other hand, an age-independent positive correlation between insulinaemia or the HOMA index and arachidonic acid content in adipose tissue TAG has been recently found in healthy children; however, no attempt to relate the fatty acid composition of TAG and HOMA was doneReference Aldamiz-Echevarria, Prieto, Andarde, Elorz, Sanjurjo and Rodriguez-Soriano42.
In conclusion, obese prepubertal children show altered plasma fatty acid profiles and concentrations, mainly related to fatty acid changes in the TAG fraction, and a lower clearance of fatty acids in comparison with normal-weight children. Moreover, concentrations of all major classes of fatty acids in TAG are associated with insulin resistance.
Acknowledgements
The present study was supported by the Plan Nacional de Investigación Científica, Desarrollo e Innovación Tecnológica (I+D+I), Instituto de Salud Carlos III-Fondo de Investigación Sanitaria Project no. PI 020826 from the Spanish Ministry of Health and Consumption, and co-financed by FEDER, Fundación Salud 2000, and Hero España SA, Spain.



