I. INTRODUCTION
As the global demand for energy increases, the need for suitable energy storage devices continues to grow. Reference Bruce, Freunberger, Hardwick and Tarascon1–Reference Choi, Chen, Freunberger, Ji, Sun, Amine, Yushin, Nazar, Cho and Bruce4 Our current energy storage technology of choice is the lithium-ion battery which is commonly found in handheld devices, electric vehicles, and other portable electronics. Reference Chiang5 Since the lithium-ion battery was first introduced in the mid-1970s, it has grown to become an extremely popular commercial technology with specific energies of 0.58 kW h/kg and 2.09 kW h/L for the LiFePO4 discharge product. Reference Padhi, Nanjundaswamy and Goodenough6 While one of the main benefits of a lithium-ion battery is the technology's maturity and cyclability, lithium–oxygen batteries, also commonly referred to as lithium–air batteries, have received a great deal of attention over the years due to their high theoretical gravimetric energies and energy densities. Reference Lu, Gallant, Kwabi, Harding, Mitchell, Whittingham and Shao-Horn7–Reference Yao, Kwabi, Quinlan, Mansour, Grimaud, Lee, Lu and Shao-Horn10 These batteries can theoretically supply a car with power and speed characteristics comparable to gasoline. A big reason these lithium–oxygen batteries have such greater theoretical energy densities and gravimetric energies is because they do not require a transport metal (such as cobalt, Co) to bond to the lithium as it travels between the electrodes of the battery. Reference Christensen, Albertus, Sanchez-Carrera, Lohmann, Kozinsky, Liedtke, Ahmed and Kojic11 Without the need of a heavy transport metal, the gravimetric energies of the battery are increased. Reference Christensen, Albertus, Sanchez-Carrera, Lohmann, Kozinsky, Liedtke, Ahmed and Kojic11
Lithium–oxygen batteries are composed of three different parts: a pure lithium metal anode, electrolyte, and a cathode. The three components work together to store and release energy through charging and discharging of the battery cell. While the cell discharges, lithium undergoes an oxidation process, releasing electrons through the circuit and moving to the cathode where the lithium bonds with oxygen to form lithium peroxide (Li2O2). Through charging, a high voltage is applied to the cell leading to a reduction reaction and the lithium bonding again with the lithium metal anode. Reference Hojberg, Knudsen, Hjelm and Vegge12–Reference Ding, Xu, Graff, Zhang, Sushko, Chen, Shao, Engelhard, Nie, Xiao, Liu, Sushko, Liu and Zhang14 Another interesting property of a lithium–oxygen battery is the oxygen permeable layer on the cathode. This layer acts between the outer cathode surface and the atmosphere. The permeable layer is designed to allow oxygen to pass into the battery cell as needed but does not allow other outside containments to enter the cell while also releasing oxygen back into the atmosphere as the cell is recharged and the oxygen is no longer needed. Reference Li15,Reference Andersen, Hu, Qiu, Kalra and Sun16 While some lithium–oxygen battery designs do omit the oxygen permeable layer by including a small oxygen storage tank as part of the battery design, these cells have significantly smaller volumetric energies.
Many of the problems with lithium–oxygen batteries can be categorized as issues related to either the lithium–metal anode Reference Lu, Gallant, Kwabi, Harding, Mitchell, Whittingham and Shao-Horn7–Reference Lu and Shao-Horn9,Reference Hojberg, Knudsen, Hjelm and Vegge12,Reference Ding, Xu, Graff, Zhang, Sushko, Chen, Shao, Engelhard, Nie, Xiao, Liu, Sushko, Liu and Zhang14 or the carbon cathode structure. Reference Li15,Reference Andersen, Hu, Qiu, Kalra and Sun16 Both electrodes provide their own challenges for developing a commercially viable lithium–oxygen battery. Many studies have been published to better understand the morphology and formation of lithium dendrites on metal anodes Reference Ding, Xu, Graff, Zhang, Sushko, Chen, Shao, Engelhard, Nie, Xiao, Liu, Sushko, Liu and Zhang14,Reference Garcia-Araez and Novak17 and model the growth of dendrites in lithium–oxygen cells using numerical methods. Reference Ryan, Ferris and Tartakovsky18 At the same time extensive work has also been done to model the precipitate growth (Li2O2) within the cathode numerically and through in situ techniques. Reference Ryan, Ferris and Tartakovsky18–Reference Tan and Ryan21 Despite these studies, the effects of dendrite growth on the formation of Li2O2 within the cathode at discharge have not been studied together to a satisfactory degree. The main objective of the study is to complete a comprehensive finite elements model of a lithium–oxygen battery that can take into account the structure of the lithium metal anode as well as various design aspects of the carbon cathode to understand how these different behaviors affect the discharge performance of a lithium–oxygen battery. Specifically, one of the common design parameters when assembling a lithium–oxygen battery cell is in the porosity of the carbon cathode. Constructing a finite element model of the lithium–oxygen cell gives the benefit of adjusting parameters such as cathode porosity and oxygen mass fraction through potentiostatic or galvanostatic discharge. Examining these cell and experimental characteristics with different anode surface structures provides the ability to make observations that may be difficult to conduct through pure experimental work.
II. METHOD
The CFD Fluent and the Fuel-Cell Module add-on within finite element software ANSYS (ANSYS, Inc., Canonsburg, PA) was used to model chemical reactions of a lithium–oxygen cell due to the similarities of chemical reactions in fuel-cell and lithium–oxygen systems. In fuel-cell, the chemical reaction at cathode is
 ${1 \over 2}{{\rm{O}}_2} + 2{{\rm{e}}^ - } + 2{{\rm{H}}^ + } \leftrightarrow {{\rm{H}}_2}{\rm{O}}$
; and in lithium–oxygen cells, the chemical reaction at cathode is
 ${{\rm{O}}_2} + 2{{\rm{e}}^ - } + 2{\rm{L}}{{\rm{i}}^ + } \leftrightarrow {\rm{L}}{{\rm{i}}_2}{{\rm{O}}_2}$
. In the fuel-cell system, electrons enter the cathode side through the current collectors, and electrons, the hydrogen ion and the oxygen combine to form water at the catalyst layer on the cathode side. Similarly, in the lithium–oxygen battery, electrons also enter the cathode side through the current collectors, and electrons, lithium-ions and the oxygen combine to form Li2O2 at the catalyst layer on the cathode side. With these similarities, once appropriate chemical species are assigned, chemical reactions could be simulated for each of the desired system. Therefore, the Fuel-Cell module could be used to simulate chemical reactions of lithium–oxygen cells. A lithium–oxygen cell was modeled with the same dimensions reported in the literature with different anode surfaces: one smooth/homogeneous and two differing anode surface structures reflecting lithium dendrite growth (4 and 12.5 μm).
Reference Read22,Reference Li and Faghri23
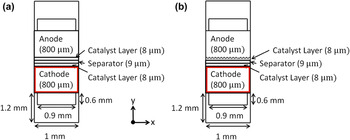
Our goal was to observe how the effects of different anode surfaces (and other cell properties) affected the discharge capacity, voltage, Li2O2 concentration, and other characteristics to have a better understanding of how the entire cell operates. The model dimensions of the homogenous flat dendrite-free model and dendrite models are shown in Fig. 1. In addition, we have chosen to use considerably wider gas channels spanning nearly the entire length of the electrodes to ensure an even distribution of lithium and oxygen in the x-direction of the electrodes.
Schematic of x–y plane of lithium–oxygen cell with (a) flat, homogeneous dendrite-free surface and (b) dendrite on lithium metal surface model (not drawn to scale).

The Fluent Fuel-Cell module solved two potential equations as the driving force for the reactions lies in the cell overpotential: the potential equation for the electron transport through the anode [Eq. (1)] and the potential equation for Li+ ionic transport [Eq. (2)] 24 :
 $$\nabla \cdot\left( {{\sigma _{{\rm{sol}}}}\nabla {\phi _{{\rm{sol}}}}} \right) + {R_{{\rm{sol}}}} = 0\quad ,$$
 $$\nabla \cdot\left( {{\sigma _{{\rm{mem}}}}\nabla {\phi _{{\rm{mem}}}}} \right) + {R_{{\rm{mem}}}} = 0\quad ,$$
where Eq. (1) solves for the electron transport through the anode and Eq. (2) solves for Li+ ionic transport; σ is the electrical conductivity (1/ohm-m), ϕ is the electric potential (volts), R sol is the volumetric transfer current (A/m3) for solid lithium anode, and R mem is the volumetric transfer current (A/m3) for the electrolyte/membrane. Further, the volumetric transfer current was computed through the Butler–Volmer equations [Eq. (3)–(4)] Reference Kulikovsky, Divisek and Kornyshev25–Reference Um, Wang and Chen27 :
 $${R_{{\rm{an}}}} = \left( {{\zeta _{{\rm{an}}}}j_{{\rm{an}}}^{{\rm{ref}}}} \right){\left( {{{\left[ A \right]} \over {{{\left[ A \right]}_{{\rm{ref}}}}}}} \right)^{{\gamma _{{\rm{an}}}}}}\left( {{{\rm{e}}^{{{{\alpha _{{\rm{an}}}}F{\eta _{{\rm{an}}}}} \mathord{\left/ {\vphantom {{{\alpha _{{\rm{an}}}}F{\eta _{{\rm{an}}}}} {RT}}} \right. \kern-\nulldelimiterspace} {RT}}}} - {{\rm{e}}^{{{ - {\alpha _{{\rm{cat}}}}F{\eta _{{\rm{an}}}}} \mathord{\left/ {\vphantom {{ - {\alpha _{{\rm{cat}}}}F{\eta _{{\rm{an}}}}} {RT}}} \right. \kern-\nulldelimiterspace} {RT}}}}} \right)\quad ,$$
 $${R_{{\rm{cat}}}} = \left( {{\zeta _{{\rm{cat}}}}j_{{\rm{cat}}}^{{\rm{ref}}}} \right){\left( {{{\left[ C \right]} \over {{{\left[ C \right]}_{{\rm{ref}}}}}}} \right)^{{\gamma _{{\rm{cat}}}}}}\left( { - {{\rm{e}}^{ + {{{\alpha _{{\rm{an}}}}F{\eta _{{\rm{cat}}}}} \mathord{\left/ {\vphantom {{{\alpha _{{\rm{an}}}}F{\eta _{{\rm{cat}}}}} {RT}}} \right. \kern-\nulldelimiterspace} {RT}}}} + {{\rm{e}}^{{{ - {\alpha _{{\rm{cat}}}}F{\eta _{{\rm{cat}}}}} \mathord{\left/ {\vphantom {{ - {\alpha _{{\rm{cat}}}}F{\eta _{{\rm{cat}}}}} {RT}}} \right. \kern-\nulldelimiterspace} {RT}}}}} \right)\quad ,$$
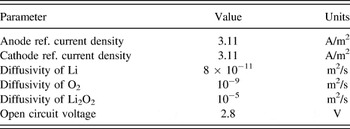
where R an is the volumetric transfer current (A/m3) for anode, R cat is the volumetric transfer current (A/m3) for cathode, j ref is reference exchange current density per active surface area (A/m2), ζ is specific active surface area (1/m), [], []ref = local species concentration, reference value (kmol/m3), γ is concentration dependence, α is transfer coefficient, η is surface overpotential, R is gas constant, T is temperature, and F is Faraday constant. Equations (1)–(4) were calculated via the ANSYS Fluent Fuel-Cell module and specifically, the module allowed users to input material properties of reactant chemical species, and these parameters included thermal conductivities, viscosities, and electrical conductivities of Li, O2 and Li2O2, as listed in Table I. In addition, operating parameters of reactant chemical species were also required, including anode reference current density, cathode reference current density, diffusivity of Li, diffusivity of O2, diffusivity of Li2O2, and open circuit voltage, as listed in Table II. It is important to note that the molecular weight of lithium in Table I is the actual molecular weight of 6.94 kg/kmol. Our model used a molecular weight of 13.88 kg/kmol to represent Li2 rather than a single Li. With the 13.88 kg/kmol we could use an accurate molecular weight for Li2O2. Many of these values were taken from the values given by Li et al. Reference Li and Faghri23 to ensure realistic battery behaviors.
Material properties of lithium–oxygen battery reactants.

Default operating parameters of lithium–oxygen model. Reference Li and Faghri23

The porosities of the cathode were adjusted to investigate the effects of decreasing electrode porosity on the discharge characteristics of the lithium–oxygen cell. As discussed by Tran et al., Reference Ryan, Ferris and Tartakovsky18,Reference Tran, Yang and Qu28 the porosity of the cathode can greatly affect the performance of the cell. Reference Ryan, Ferris and Tartakovsky18,Reference Tran, Yang and Qu28 Porosities of 0.75, 0.5, and 0.25 were investigated for the flat and small dendrite models, and the polarization curves (i.e., I–V curves), normalized concentration of Li2O2 formation, and contour plots were generated. The mass fraction of O2 moving through the cathode was adjusted from 100% O2 to 75% O2 to investigate the effects of limited oxygen available for reaction on the cell performance for the flat and dendrite models.
Potentiostatic discharging were simulated, where the discharge voltage was set for each separate calculation and the discharge current, contour plots for Li2O2 formation, and kmol of Li2O2 precipitate formation were recorded before another calculation at a different discharge voltage was carried out. With the open circuit voltage of the cell being 2.8 V, the cell was discharged from 2.75 V and decreased until cellular failure, typically around 2.6 V. Reference Xia, Waletzko, Chen, Peppler, Klar and Janek29
III. RESULTS AND DISCUSSION
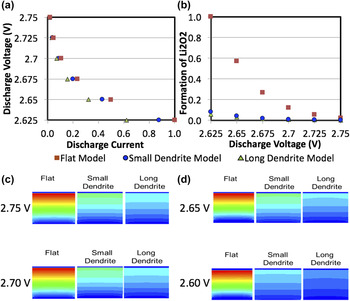
Several cell parameters were adjusted and the discharge properties were compared. The polarization curves, i.e., current versus voltage curves (I–V curves) of the various cells as well as contour plots of the Li2O2 precipitate concentrations within the cathode were all compared. We first compared the flat anode model (dendrite-free) with two different lengths of dendrites, i.e., 4 and 12.5 µm. The long dendrite model (12.5 μm) resembles a battery cell that has been cycled to grow dendrite structures that protrude halfway through the separator of the anode and cathode structures. All models were discharged with a cathode porosity of 0.75 with 100% O2 mass fraction, which was suggested from the literature. Reference Li and Faghri23 In general, a relatively flat I–V curve of cell represents a more stable system. As shown in Fig. 2(a), the flat dendrite-free model portrayed a better performing cell as the discharge current did not drop as quickly as the dendrite models when the discharge voltage was lowered from 2.75 V to 2.625 V. It was noted that the long dendrite model's trends fall in line with the decrease in performance compared to both the small dendrite model and the dendrite-free model by carefully observing the I–V curves of the three models. That is, as the discharge voltage was decreased at 2.625 V, the long dendrite model experienced nearly a 40% decrease in discharge current when compared to the flat dendrite-free model.
(a) I–V curve of flat dendrite-free, small, and long dendrite models at a cathode porosity of 0.75. As the dendrites grew to represent a cell that had been continuously cycled, the discharge current of the cell greatly decreased. (b) Normalized Li2O2 formation of flat dendrite-free, small, and long dendrite models at cathode porosity of 0.75. The lower the discharge voltage, the greater the Li2O2 formed. (c)–(d) Concentration contour plots of the formation of Li2O2 from the cathode section (i.e., denoted by a red-box) in Fig. 1 at different discharge voltages. Color legend: high Li2O2 concentration is in red and low Li2O2 concentration is in blue.

The normalized amount of discharge product (Li2O2) within the cathode [Fig. 2(b)] and 2D concentration contour plots of Li2O2 formation from the cathode section (i.e., denoted by a red-box) in Fig. 1 were also compared, as shown in Figs. 2(c) and 2(d). At the conclusion of discharge at 2.625 V, the flat dendrite-free model demonstrated nearly 4 times the amount of Li2O2 formation within the cathode as the small dendrite model. Moreover, the amount of Li2O2 of the long dendrite model appears slightly smaller than the small dendrite model [Fig. 2(b)]. It was suggested that when compared to the flat dendrite-free model, the battery cells that had theoretically been cycled enough for dendrites to grow on the anode portrayed a significant decrease in discharge product within the cathode [Fig. 2(b)].
From Figs. 2(c) and 2(d), the results showed that as all cells were with the decreased voltage, the amount of discharge product Li2O2 increases and the highest concentration of Li2O2 forming were close to the separator. Reference Shui, Okasinski and Chen20 It was apparent that the Li2O2 formation utilized more of the cathode with the flat dendrite-free model when compared to the two dendrite models. It was suggested the flat dendrite-free model displayed a better performing cell with a higher capacity (where the amount of discharge product formed was assumed to be analogous to cell capacity). The theoretical capacity of the lithium–oxygen models and the associated loss of capacity with dendrite growth can be compared to the experimental work published by Orsini et al. Reference Orsini, Du Pasquier, Beaudoin, Tarascon, Trentin, Langenhuizen, De Beer and Notten30 Orsini found that as their lithium metal cells continuously cycled, dendrite growth occurred on the surface of their metal anodes. Reference Orsini, Du Pasquier, Beaudoin, Tarascon, Trentin, Langenhuizen, De Beer and Notten30 As their cells were continuously cycled, the bush-like dendrites grew and the capacity of their cells greatly decreased. The decrease in capacity was amplified as the discharge current density increased. Reference Orsini, Du Pasquier, Beaudoin, Tarascon, Trentin, Langenhuizen, De Beer and Notten30 As reported by Orsini et al., Reference Orsini, Du Pasquier, Beaudoin, Tarascon, Trentin, Langenhuizen, De Beer and Notten30 the capacity of the lithium metal cells (C/2.5 and C/5 cells) decreased by 80–90% when cycled only 25 times. The decrease in cell capacity started to flatten out after the initial steep decrease in cell capacity. Reference Orsini, Du Pasquier, Beaudoin, Tarascon, Trentin, Langenhuizen, De Beer and Notten30 The results from our computational models presented in Fig. 2 have a similar quantitative decrease in the capacity as reported experimentally from Orsini et al. Reference Orsini, Du Pasquier, Beaudoin, Tarascon, Trentin, Langenhuizen, De Beer and Notten30 Our flat dendrite-free model represents a fresh lithium–oxygen cell that has yet to be cycled with 100% capacity. Our small dendrite model with dendrites that have grown to a length of 4 μm, found that the total amount of Li2O2 formed within the cathode had decreased by about 90%. Next, our cell with long dendrite structures with a length of 12.5 μm showed a decrease of about 30% in Li2O2 formation from the small dendrite model and 93% compare to the flat dendrite-free model [Fig. 2(b)]. Our computational results fall in line with the decrease in capacity presented by Orsini et al., Reference Orsini, Du Pasquier, Beaudoin, Tarascon, Trentin, Langenhuizen, De Beer and Notten30 where the onset of dendrite growth sparks a large decrease in cell capacity and the continuous cycling of the cells results in a more gradual decrease in capacity. Finally, the dendrite structures in our models represent the bush-like dendrites that are commonly seen in cells with a greater discharge current density, where these effects are again amplified. However, our study limitations lie on modeling dendrites by varying anode surface roughness, whereas the changes in the chemical composition of dendrites were not considered, nor associated chemical reactions, or phase transitions were included. To extend the pilot study as described in the current work, we are in the process of incorporating composition-dependent of dendrites, associated chemical reactions, and phase transition effects in our finite element simulations. In addition, the current study was a purely computational one, whereas we utilized computational simulation because computational approaches allow us to isolate independent and coupled factors governing experimentally measured phenomenon. The goal was to identify some key factors determining the changes of I–V curves in lithium–oxygen batteries. As such, our approach was first to develop multiphysics finite element models of a lithium–oxygen system in which we varied several cell parameters, including both O2 cathode and lithium anode.
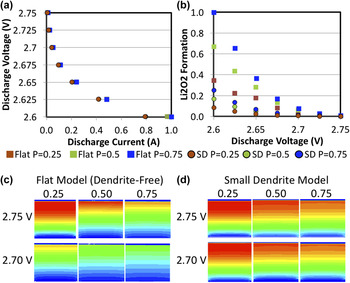
When examining the effects of cathode porosity (0.75, 0.5, and 0.25), the polarization curves (i.e., I–V curves) demonstrated similar phenomenon that the flat dendrite-free models portrayed a better performing cell than the small dendrite models [Fig. 3(a)]. It is interesting to point out all of the simulations for the flat dendrite-free and small dendrite models revealed the same I–V plots at different cathode porosities. It could be due to the fact that the porosity of the cathode has little to no effect on the discharge current of the cells. Our results are different from what Ryan et al. Reference Ryan, Ferris and Tartakovsky18 have reported, however, it could due to that Ryan et al. Reference Ryan, Ferris and Tartakovsky18 only conducted either a cathode model or an anode model (e.g., a half-cell model), without a complete battery cells which included all constituent of a lithium–oxygen battery as shown in the current study. Figure 3(b) portrayed the amount of discharge product as the discharge voltage dropped from 2.75 V to 2.6 V. It was observed that as the porosity of the cathode decreases from 0.75 to 0.5 (by 33.3%) the amount of Li2O2 formed also decreases by 33.3%, suggesting that when the porosity of the cathode decreases, the surface area for lithium and oxygen to react decreases, resulting in a reduction of Li2O2 formed within the cathode. It is interesting to note that the model with the flat dendrite-free model at the lowest porosity (0.25) still portrayed a greater amount of Li2O2 than the small dendrite model with the greatest porosity (0.75) [Fig. 3(b)]. Results in this study show how detrimental the formation of dendrite structures can be on the performance of a lithium–oxygen battery. Figure 3(c) displayed the Li2O2 concentration contour plots of flat dendrite-free model with discharged voltages of 2.75 and 2.70 V at three different porosities, respectively. While it was apparent that the smaller the porosity the greater the depth of discharge of the Li2O2 within the cathode, it is important to remember that the greater porosities reveal a greater amount of discharge product within the entire cathode. It is likely due to the higher porosities revealing a higher amount of Li2O2 along the entire z-axis of the cell (out of plane direction). The Li2O2 concentration contour plots were observed at a depth of 11 mm in the z-direction of the cell. Similar to the flat dendrite-free model, the small dendrite model exemplified a greater depth of discharge at the smaller discharge voltage [Fig. 3(d)].
(a) I–V curve of flat dendrite-free and small dendrite models at varying cathode porosities. Varying porosities had little effect on polarization curves of cells. (b) Normalized Li2O2 formation of flat dendrite-free and small dendrite models at cathode porosities of 0.25, 0.5, and 0.75. The lower the discharge voltage, the greater the Li2O2 formed. (c) Concentration contour plots of flat dendrite-free model at 2.75 and 2.70 V. (d) Concentration contour plots of small dendrite model at 2.75 and 2.70 V. Color legend: high Li2O2 concentration is in red and low Li2O2 concentration is in blue.

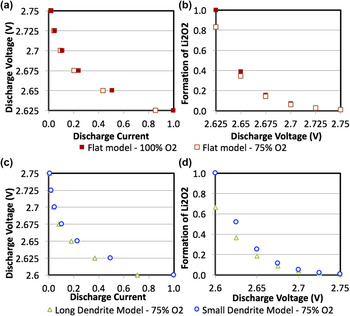
In the current study, we also compared mass fraction of O2 (100% O2 versus 75% O2) on discharge properties. It was observed that as we reduced the amount of oxygen within the cell from 100% to 75%, the I–V curves from the flat dendrite-free model exhibited different characteristics [Fig. 4(a)]. The cell with limited oxygen showed an I–V curve where the discharge current of the cell was dropping more quickly as the discharge voltage of the cell was decreased from 2.75 V to 2.625 V. Figure 4(b) demonstrated the amount of Li2O2 formed within the cathode of the cells with different mass fractions of O2 available for reaction. It was found that by decreasing the mass fraction of oxygen available to react with lithium by as much as 25% resulted in the discharge current dropping quickly and a decrease in the amount of Li2O2 formed within the cathode, suggesting that the decrease in reactants (O2) in the electrochemical reaction (Li2O2) would clearly negatively affect the performance of the lithium–oxygen cell. Additionally, our unpublished data Reference Ayers31 showed that the models with a higher amount of O2 showed a much higher Li2O2 concentration close to the separator barrier with a slightly better depth of discharge compared to the oxygen restricted model. This could be due to the pore clogging effect disrupting the formation of additional Li2O2 and preventing the already limited oxygen from reacting with the lithium.
(a) I–V curve of flat dendrite-free model with 100% versus 75% O2 mass fractions. Decreasing the amount of oxygen to react in cell decreases the discharge current faster than the cell with more oxygen. (b) Normalized Li2O2 formation of flat dendrite-free models with 100% versus 75% O2 mass fractions. The lower the discharge voltage, the greater the Li2O2 formed. (c) I–V curves of small and long dendrite models with a 25% reduction in mass fraction of O2 available in cathode. (d) Normalized Li2O2 formation within cathode of cells with a 25% reduction in mass fraction of O2 available in cathode.

Figure 4(c) showed the I–V curves of the long and small dendrite models with a 25% reduction in oxygen mass fraction and it was observed that lithium–oxygen cells suffered a decrease in performance from the lack of oxygen available. Figure 4(d) displayed the amounts of discharge product Li2O2 forming within the cathodes of the small and long dendrite models as the mass fraction of oxygen was reduced. It was observed that the difference in magnitude of discharge product Li2O2 forming within the cathode was the same between the two models at each discharging voltage [Fig. 4(d)], despite both models experiencing a decrease in battery cell performance.
IV. CONCLUSION
A better understanding of the operating mechanisms of the lithium–oxygen cell can be obtained by studying the effects of the anode and cathode together through a finite element model. In the current study, we constructed three different models within ANSYS Fluent with different anode surface structures. The results showed that the lithium–oxygen cell with a perfectly homogeneous anode surface performs much better than the cell that has theoretically been cycled enough times to begin lithium dendrite growth. It was also observed that the change in cathode porosity (from 0.75, 0.5, to 0.25) of lithium–oxygen cells has a positive, linear relationship with the amount of Li2O2 forming within the cathode. All of the simulations for the flat dendrite-free and small dendrite models revealed the same I–V plots at different cathode porosities, suggesting that the porosity of the cathode has no effect within the range of porosities modeled in the current study. As for the effects of mass fraction of O2, the results of decreasing the mass fraction of O2 from 100% to 75% decreased the performance of the battery cells. Our results suggest that further work and research must be done to mitigate lithium dendrite growth in lithium–oxygen batteries, and it could be couple steps closer to developing a commercially viable lithium–oxygen battery.