
I. INTRODUCTION
As new kinds of the functional materials, due to the gradual varying properties or the microstructure, the Functionally Graded Materials (FGMs) have been explored for the continuously increasing engineering applications including the structure optimization, fission and fusion reactors, thermally resistant materials, the aerospace industry, optical and electronic materials, nuclear power plants, as well as the cryogenic installations. Reference Koizumi1,Reference Skoczen2
Shape memory materials, such as the shape memory alloy (SMA) Reference Sittner, Heller, Pilch, Curfs, Alonso and Favier3–Reference Haberland, Elahinia, Walker, Meier and Frenzel6 and shape memory polymer, Reference Lu, Lu, Huang and Leng7,Reference Lu, Leng and Du8 as well as SMA hybrid material consisting of SMA materials and other materials, Reference Samadpour, Sadighi, Shakeri and Zamani9,Reference Asadi, Kiani, Shakeri and Eslami10 have been studied and discussed in a number of research papers. SMA is featured by the shape memory effect and pseudo-elasticity due to martensitic transformation and reorientation. Reference Lagoudas11 Due to these features, the SMA couplers, one of SMA actuators, show many interesting properties than the available brazed couplers. The SMA couplers can maintain a contact pressure on the surface of the pipes and it will be easier to be fitted and installed. The interesting properties including light weights and simplicity of operation make SMA actuators worthy of consideration in various industrial applications, such as robot grippers and micro-pump. Reference Zhong and Yeong12,Reference Guo, Oohira and Fukuda13
However, with the development of science and technology, the demand on the material properties (such as aerospace) becomes higher. A new research which named the Functionally Graded SMA (FG-SMA) has been proposed by the experts recently. Reference Qiu, Bian, Ji and Zhu14 As for the study of FG-SMA materials, it mainly focuses on the following three cases. The first case is the functionally gradient SMA composites with different component fractions, such as the composites which are composed of NiTi and other elastomeric materials with different component fractions of NiTi, Reference Lester, Chenisky and Lagoudas15–Reference Liu, Dui and Yang20 or the composites which is composed of Ni and Ti with different component fractions of Ni or Ti, Reference Pequegnat, Michael, Wang, Lian, Zhou and Khan21–Reference Yan, Cui and Zheng25 or the functionally graded porous SMA materials with gradient porosity. Reference Zhang, Zhang and Zhong26 The second case is the functionally gradient SMA materials with different gradient features including the gradient Young’s modulus, gradient Poisson’s ratio, gradient shear modulus, gradient critical stresses and gradient maximum transformation strain, which can be produced by different heat treatment processes or adjusting the SMA material microstructure or geometric dimensions. Reference Shariat, Liu and Rio27–Reference Shariat, Liu, Meng and Rio30 The third case is the temperature gradient SMA materials which can be produced through different temperature aging processes. Reference Razali and Mahmud31 The literature studies on these materials are focused on material preparation, experimental testing, and characterization. Reference Belyaev, Rubanik, Resnina, Rinamol, Rubanik and Borisov17–Reference Zheng, Xu and Qi19,Reference Belyaev, Rubanik, Resnina, Rinamol and Lomakin22–Reference Zhang, Zhang and Zhong26,Reference Shariat, Liu and Rio28,Reference Razali and Mahmud31 Nowadays, the FG-SMA has shown more broad application prospects in the field of high-tech and intelligent materials. Reference Hartl and Lagoudas32 However, it is still a preliminary exploration stage to describe the mechanism of phase transformation and the evolution of microstructures. Reference Liu, Dui and Yang20,Reference Shariat, Liu and Rio27,Reference Shariat, Liu and Rio28,Reference Shariat, Liu, Meng and Rio30 It is necessary to further study how to establish the mechanical constitutive relation including phase transformation, which has certain influences on its further practical application.
The assumption of fabrication and the exploration to the advantages of FG-SMA materials had been proposed more than ten years ago, Reference Qidwai, Entchrv, Lagoudas and DeGiorgi33 while the actual materials are finally achieved up to now. FG-SMA materials have been successfully produced by the following methods: explosion welding technique, Reference Belyaev, Rubanik, Resnina, Rinamol, Rubanik and Borisov17,Reference Belyaev, Rubanik, Resnina, Rinamol and Lomakin22,Reference Yan, Cui and Zheng25 sputtering target technique, Reference Tian, Schryvers, Mohanchandra, Carman and Humbeeck18,Reference Martins, Schell, Reuther, Pereira, Mahesh, Silva and Fernandes24 magnetron sputtering technique, Reference Zheng, Xu and Qi19 diffusion bonding technique, Reference Lim, Kim, Noh, Kim and Nam23 the combination of high-temperature isostatic pressing technique and traditional sintering technique, Reference Zhang, Zhang and Zhong26 laser irradiation technique, Reference Meng, Liu, Yang, Shariat and Nam29 and temperature gradient annealing technique. Reference Razali and Mahmud31 Compared with dense SMA materials such as the couplers, the FG-SMA couplers show a lot of new excellent mechanical properties. Reference Lester, Chenisky and Lagoudas15–Reference Razali and Mahmud31,Reference Qidwai, Entchrv, Lagoudas and DeGiorgi33–Reference Birman35 Firstly, the material component can be designed according to necessary need of structure for meeting the needs of different parts of the material. Reference Qidwai, Entchrv, Lagoudas and DeGiorgi33 Secondly, due to the continuity of the distribution of material components, the mutation of stress caused by the mismatch of thermal expansion can be eased. Reference Liu, Dui and Yang20 Furthermore, due to the SMA phase transformation induced by change of temperature and stress under the thermal coupling effects, the maximum stress and maximum stress intensity factor of the materials are significantly reduced. Reference Lester, Chenisky and Lagoudas15 Moreover, hardness of the structural member, Reference Fu, Du and Zhang16 anti-friction properties, Reference Fu, Du and Zhang16 anti-high temperature, Reference Mahmud, Liu and Nam34 stability, Reference Birman35 and other excellent mechanical properties Reference Han, Xu, Wang and Zhang36 of the composite component of SMA material and another material will also increase. Thus, if the FGMs combined with the SMA materials, it will bring a new revolution to materials science.
In this work, the theoretical analysis for an FG-SMA cylinder subjected to an internal pressure will be carried out. The recent researches of FG-SMA cylinder are mainly focused on theoretical analysis. Reference Asadi, Akbarzadeh, Chen and Aghdam37–Reference Leng, Yan, Zhang, Huang and Gao41 Due to the different fabrication techniques and synthetic methods, laboratory prepared FG-SMA materials are difficult to obtain a uniform gradient distribution function, and the gradient distribution functions of the different production process were not completely the same. Thus, experimental research is still very few. A theoretical research on FG-SMA cylinder is presented in this work to discuss the influence on behaviors of the FG-SMA cylinder by the different gradient parameters. Once the FG-SMA sample was manufactured, the different gradient features including the gradient Young’s modulus, gradient Poisson’s ratio, gradient shear modulus, gradient critical stresses, and gradient maximum transformation strain exist at the same time in the material. And then the graded distribution function of the sample for different properties should be measured. While, the real graded function of the sample always show a complex form, and it is hard to achieve the theoretical result for such a sample by using the complex graded function or considering all the gradient properties. To get the theoretical solution, the graded function is usually assumed to be the case with ideal graded distribution such as some of the parameters gradient along the radius of the cylinder. In the similar way, some of the properties are usually assumed to be non-gradient such as the critical transformation stresses, and the max transformation strain for getting the theoretical solutions. So, in this work, to simplify the theoretical analysis, a special example is presented with the critical phase transformation stresses, and the maximum transformation strain are assumed to be non-gradient, and the Young’s modulus and Poisson’s ratio are assumed to be varied by an exponential function through the thickness. The problem is then reduced to solve an ordinary differential equation numerically. Using the ideal elastic–plastic theory of SMA, some interesting results for such materials are finally given. The present work can provide a theoretical guidance for the design optimization and further engineering application of FG-SMA materials.
II. ANALYTICAL MODELING OF FG-SMA CYLINDER
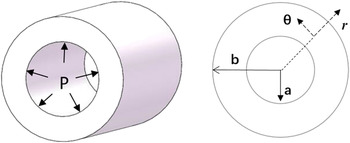
A state of axial symmetry is considered in the problem of the functionally graded NiTi SMA cylinder under internal pressure (as shown in Fig. 1). The boundary conditions for the cylinder is σr = −P, r = a and σr = 0, r = b. It is assumed that the radial displacement, u (and therefore the radial strain εrr), does not change through the length. Accordingly, the kinematic (strain-displacement) relations, assuming small displacement gradient in polar coordinates system, can be simplified. From the geometric equation, the strains in polar coordinates (r, θ) can be expressed as follows:
 $${\varepsilon _{\rm{r}}} = {{{\rm{d}}u} \over {{\rm{d}}r}},\;{\varepsilon _{\rm{\theta }}} = {u \over r}\quad ,$$
where εr, εθ are the radial and tangential strains of the material. Then the displacement u will be got by u = rεθ. So, the relation between two strains is
 $${\varepsilon _{\rm{r}}} = {{{\rm{d}}(r{\varepsilon _\theta })} \over {{\rm{d}}r}}{\rm{\ or\ }}{\varepsilon _{\rm{r}}} = {\varepsilon _\theta } + r{{{\rm{d}}{\varepsilon _\theta }} \over {{\rm{d}}r}}\quad .$$
FG-SMA cylinder under internal pressure.

Defined σθ as circumferential/tangential stress, here we take the equilibrium equation between σr and σθ as
 $${{{\rm{d}}{\sigma _{\rm{r}}}} \over {{\rm{d}}r}} = {{{\sigma _\theta } - {\sigma _{\rm{r}}}} \over r}\quad .$$
Then we can obtain that
 $${1 \over r}{{{\rm{d}}(r{\sigma _{\rm{r}}})} \over {{\rm{d}}r}} = {{{\sigma _\theta }} \over r}\quad .$$
The function F(r) = rσr is introduced which satisfies Eq. (4)
 $${\sigma _\theta } = {{{\rm{d}}F(r)} \over {{\rm{d}}r}}{\rm{\ and\ }}{\sigma _{\rm{r}}} = {{F(r)} \over r}\quad .$$
As for the FG-SMA cylinder, there are many different cases of gradient features which can be embodied in different functions of r, such as Young’s modulus, Poisson’s ratio, shear modulus, the critical phase transformation stress, and the maximum transformation strain of the material. Different phase transformations will be shown with different gradient features.
To simplify this theoretical analysis, a special example will be presented in this work with the critical phase transformation stresses and the maximum transformation strain are assumed to be non-gradient, and the Young’s modulus and the Poisson’s ratio are assumed to be varied by an exponential function through its thickness. Taking this gradient distribution function as an example, other gradient cases can be studied by the reader. The Young’s modulus can be assumed as
 $$E(r) = {E_0}\exp \left( {{{\beta (r - a)} \over {b - a}}} \right){\rm{\ with\ }}E(r){|_{r = a}} = {E_0},{\rm{\ }}E(r){|_{r = b}} = {E_0}\exp (\beta )\quad .$$
By considering that the Poisson’s ratio is less than 0.5 in practical situations, here the Poisson’s ratio can be assumed as
 $$\nu (r) = {\nu _0}\exp \left( {{\beta \over 4}{{(r - a)} \over {b - a}}} \right){\rm{\ with\ }}\nu (r){|_{r = a}} = {\nu _0},\;\nu (r){|_{r = b}} = {\nu _0}\exp (\beta )\quad ,$$
where β is the material parameter, and it can be either positive or negative, which represents the different functionally graded properties. Assuming that the cylinder is initially in elastic austenite state, with the increasing loadings, the FG-SMA material may transform from austenite to martensite. Where E 0 is different for the austenite and the martensite.
 $${E_0} = (1 - \xi ){E_{\rm{A}}} + \xi {E_{\rm{M}}}\quad ,$$
where E A and E M are the Young’s modules of austenite and martensite phase for SMA phase, respectively. ξ is the volume fraction of martensite. And assume that ν0 is the same for the austenite and the martensite. To get the theoretical result, here we assumed that the material is in elastic austenite state initially (then E 0 = E A). For different plane case, the relations of stress–strain can be expressed as
 $$\eqalign{ & {\varepsilon _{\rm{r}}} = {1 \over {E(r)}}\left( {{\sigma _{\rm{r}}} - \nu (r){\sigma _\theta }} \right),\quad {\varepsilon _\theta } = {1 \over {E(r)}}\left( {{\sigma _\theta } - \nu (r){\sigma _{\rm{r}}}} \right),\quad {\rm{for\ plane\ stress\ case}} \cr & {\varepsilon _{\rm{r}}} = {{1 - \nu {{(r)}^2}} \over {E(r)}}\left( {{\sigma _{\rm{r}}} - {{\nu (r)} \over {1 - \nu (r)}}{\sigma _\theta }} \right),\quad {\rm{\ }}{\varepsilon _\theta } = {{1 - \nu {{(r)}^2}} \over {E(r)}}\left( {{\sigma _\theta } - {{\nu (r)} \over {1 - \nu (r)}}{\sigma _{\rm{r}}}} \right),\quad {\rm{for\ plane\ strain\ case}}\quad {\rm{.}} \cr}$$
The plane strain case is taken as an example in this paper, and the plane stress case can be considered the same way.
Take Eq. (5) into Eq. (9), we can obtain
 $${\varepsilon _{\rm{r}}} = {{1 - \nu {{(r)}^2}} \over {E(r)}}\left( {{F \over r} - {{\nu (r)} \over {1 - \nu (r)}}{{{\rm{d}}F} \over {{\rm{d}}r}}} \right),\quad {\varepsilon _\theta } = {{1 - \nu {{(r)}^2}} \over {E(r)}}\left( {{{{\rm{d}}F} \over {{\rm{d}}r}} - {{\nu (r)} \over {1 - \nu (r)}}{F \over r}} \right)\quad .$$
Then take Eq. (10) into Eq. (2), the equation will be
 $${{{{\rm{d}}^2}F(r)} \over {{\rm{d}}{r^2}}} + {1 \over r}{{{\rm{d}}F(r)} \over {{\rm{d}}r}} - {{F(r)} \over {{r^2}}} - \left( {{{{\rm{d}}F(r)} \over {{\rm{d}}r}} - {{\nu (r)} \over {1 - \nu (r)}}{{F(r)} \over r}} \right){1 \over {E(r)}}{{{\rm{d}}E(r)} \over {{\rm{d}}r}} = 0\quad .$$
To simplify Eq. (11) and from the function (6), we can certainly have
 $${{{\rm{d}}E(r)} \over {{\rm{d}}r}} = {\beta \over {b - a}}E(r)\quad .$$
Then,
 $${1 \over {E(r)}}{{{\rm{d}}E(r)} \over {{\rm{d}}r}} = {\beta \over {b - a}}\quad .$$
Take Eq. (13) into Eq. (11), then it can be expressed compactly as
 $${{{{\rm{d}}^2}F(r)} \over {{\rm{d}}{r^2}}} + {1 \over r}{{{\rm{d}}F(r)} \over {{\rm{d}}r}} - {{F(r)} \over {{r^2}}} - {\beta \over {b - a}}\left( {{{{\rm{d}}F(r)} \over {{\rm{d}}r}} - {{\nu (r)} \over {1 - \nu (r)}}{{F(r)} \over r}} \right) = 0\quad .$$
Considering the boundary conditions
 $${\sigma _{\rm{r}}}{|_{r = a}} = - {p_{\rm{a}}},\quad {\sigma _{\rm{r}}}{|_{r = b}} = 0\quad .$$
From Eq. (5), we can have
 $${\rm{\ }}F{|_{r = a}} = - {p_{\rm{a}}}a,\quad F{|_{r = b}} = 0\quad .$$
When the condition (16) is satisfied, the solution of Eq. (14) can be expressed as
 $$F(r) = {F_1}(r) + c{F_2}(r)\quad ,$$
where c is a constant which is not dependent on its radius.
And F 1(r), F 2(r) should satisfy Eq. (14), respectively, so we can get that
 $${F_1}{|_{r = a}} = - {p_{\rm{a}}}a,\quad {{{\rm{d}}{F_1}} \over {{\rm{d}}r}}{|_{r = a}} = 0\quad ,$$
 $${F_2}{|_{r = a}} = 0,\quad {{{\rm{d}}{F_2}} \over {{\rm{d}}r}}{|_{r = a}} = 1\quad .$$
The condition (16) shows
 $F{|_{r = b}} = 0$
, so we have
 $$F(b) = {F_1}(b) + c{F_2}(b) = 0\quad .$$
Then
 $$c = {{ - {F_1}(b)} \mathord{\left/ {\vphantom {{ - {F_1}(b)} {{F_2}(b)}}} \right. \kern-\nulldelimiterspace} {{F_2}(b)}}\quad .$$
The Runge–Kutta method is used here to solve Eq. (14), and the numerical solution of F 1(r) and F 2(r) can be obtained, respectively, with the boundary conditions (18) and (19). Reference Hildebrand42 Then, the solution of F(r) can be obtained from Eq. (17). To simplify the expression, the calculated results for stresses can be expressed as
 $$\eqalign{ & {\sigma _{\rm{r}}} = - {f_1}(a,b,\beta ,r){p_{\rm{a}}}\quad , \cr & {\sigma _\theta } = {f_2}(a,b,\beta ,r){p_{\rm{a}}}\quad . \cr}$$
From the physical equation, the relation between (σr, σθ, σz) can be got by
 $${\sigma _{\rm{z}}} = E(r){\varepsilon _{\rm{z}}} + \nu (r)({\sigma _{\rm{r}}} + {\sigma _\theta })\quad .$$
And for the plane strain case, εz = 0, the relation will be
 $${\sigma _{\rm{z}}} = \nu (r)({\sigma _{\rm{r}}} + {\sigma _\theta })\quad .$$
Take Eq. (22) into Eq. (24), the relation can be expressed as
 $${\sigma _{\rm{z}}} = \nu (r){p_{\rm{a}}}( - {f_1} + {\rm{\ }}{f_2})\quad .$$
To get the strain in θ-direction, take Eq. (22) into Eq. (9)
 $${\varepsilon _{\rm{r}}} = - {{{p_{\rm{a}}}} \over {E(r)}}\left[ {\left( {1 - \nu {{(r)}^2}} \right){f_1} + \left( {\nu (r) + \nu {{(r)}^2}} \right){f_2}} \right],\quad {\varepsilon _\theta } = {{{p_{\rm{a}}}} \over {E(r)}}\left[ {\left( {1 - \nu {{(r)}^2}} \right){f_2} + \left( {\nu (r) + \nu {{(r)}^2}} \right){f_1}} \right]\quad .$$
So the displacement in r-direction can be expressed as
 $$u = r{\varepsilon _\theta } = {{r{p_{\rm{a}}}} \over {E(r)}}\left[ {\left( {1 - \nu {{(r)}^2}} \right){f_2} + \left( {\nu (r) + \nu {{(r)}^2}} \right){f_1}} \right]\quad .$$
Because the Young’s modulus and the Poisson’s ratio are assumed as gradient changing, the theoretical solution of the model is too complex to be obtained. To get the analytical solution, an ideal elasto-plastic constitutive model is selected to simulate the phase transformation of the SMAs.
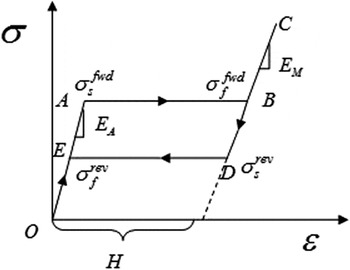
To illustrate the basic features of the FG-SMA material, the loading–unloading curve is schematized in Fig. 2. During loading, including three states: elasticity (OA: complete austenite), transformation from austenitic to the martensitic phase (AB), post-transformational elasticity (BC: complete martensite). The unloading responses include three regimes too, corresponding to CD, DE, and EO.
Stress–strain relation of FG-SMA.

Define H denotes the maximum transformation strain.
 $\sigma _{\rm{s}}^{{\rm{fwd}}}$
is the initial phase transformation critical stress, and
 $\sigma _{\rm{s}}^{{\rm{rev}}}$
is the initial reverse phase transformation critical stress.
 $\sigma _{\rm{f}}^{{\rm{fwd}}}$
is the finish phase transformation critical stress, and
 $\sigma _{\rm{f}}^{{\rm{rev}}}$
is the finish reverse phase transformation critical stress. And for the ideal elasto-plastic constitutive model, it is assumed that
 $\sigma _{\rm{s}}^{{\rm{fwd}}} = \sigma _{\rm{f}}^{{\rm{fwd}}},\quad \sigma _{\rm{s}}^{{\rm{rev}}} = \sigma _{\rm{f}}^{{\rm{rev}}}$
.
The Tresca yield criterion is chosen as the criterion of phase transformation, as
 $${\sigma _\theta } - {\sigma _{\rm{r}}}{|_{r = a}} = \sigma _{\rm{s}}^{{\rm{fwd(rev)}}}\quad .$$
Take Eq. (22) into Tresca yield criterion, Eq. (28), the relation between critical press p
cr and
 $\sigma _{\rm{s}}^{{\rm{fwd(rev)}}}$
can be obtained:
 $${p_{{\rm{cr}}}}\left( {{f_2} + {f_1}} \right) = \sigma _{\rm{s}}^{{\rm{fwd(rev)}}}\quad .$$
Then when the internal pressure p a get to critical press p cr, the phase transformation happen and finish at the same time. Then the whole material is in the pure martensite elastic state (then E 0 = E M).
After the phase transformation, the strain in r-direction can be decomposed as
 $${\varepsilon _{\rm{r}}} = {\varepsilon _{\rm{e}}} + {\varepsilon _{{\rm{tr}}}}\quad ,$$
where the transformation strain εtr = H. Then the strain can be expressed as
 $${\varepsilon _{\rm{r}}} = {1 \over {E(r)}}\left( {\left( {(1 - \nu {{(r)}^2}} \right){\sigma _{\rm{r}}} - \left( {\nu (r) + \nu {{(r)}^2}} \right){\sigma _\theta }} \right) + H\quad .$$
Because Eq. (14) is independent of E 0, the numerical results of (f 1, f 2) can be got in both austenite elastic state and martensite elastic state. So the strain in r-direction after the phase transformation can be also expressed as
 $${\varepsilon _{\rm{r}}} = {{{p_{\rm{a}}}} \over {E(r)}}\left( { - \left( {1 - \nu {{(r)}^2}} \right){f_1} - \left( {\nu (r) + \nu {{(r)}^2}} \right){f_2}} \right) + H\quad .$$
Based on the theory above, for the different gradient function, the stress, strain, and displacement distributions of FG-SMA cylinder under internal pressure are finally obtained.
III. NUMERICAL RESULTS
Based on the elastic analysis for a cylinder made of FG-SMA, the differential equation will be solved numerically to illustrate the application of the above modeling. For the different engineering applications, the type of the cylinder is defined as thin walled cylinders and thick walled cylinder by different ratio of b/a. For the case with the condition b/a < 1.2, the materials are defined as thin walled cylinder, and for the case with the condition b/a ≥ 1.2, the materials are defined as thick walled cylinders.
As an example of the thin walled cylinder, we chose a = 0.035 m, b = 0.040 m. The material parameters controlling the response of the structure plotted in this section are given in Table I, and some of the parameters come from Liu’s work. Reference Liu, Dui and Zhu43
Parameters used in calculation for FG-SMA. Reference Liu, Dui and Zhu43

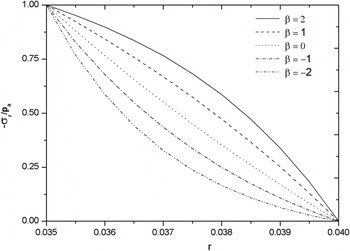
Figure 3 shows the distributions of −σr/p a through the thickness of the thin cylinder with different β. As seen in Fig. 3, it’s obvious that −σr/p a is significantly affected by β. For any part of the cylinder, −σr/p a is increasing with the increasing values of β. Besides, all the curves are monotonically decreasing from 1 to 0 with the increasing radius r, which shows that the radial stresses show a bigger value at the internal radius and equal to zero in the external one. And when β = 0, the curve is similar to a straight line, for the case β = 1, 2, the curves are convex while the other cases are concave.
Distributions of −σr/p a through the thickness of the thin walled cylinder with different β.

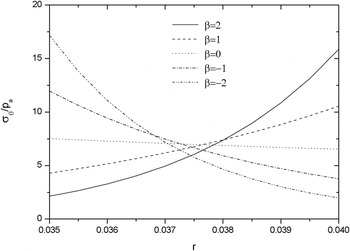
Figure 4 shows the distributions of σθ/p a through the thickness of thin cylinder with different β. As seen in Fig. 4, the curves are monotonically decreasing for the cases with β = 0, −1, −2 and monotonically increasing for the cases with β = 1, 2. At r = a, σθ/p a increase with the decreasing β, while at r = b, σθ/p a decrease with the decreasing β. The maximum values for cases with β = 2, 1, −1, −2 are bigger than the case with β = 0. And the case β = 0, σθ/p a is nearly to a uniform distribution through the thickness of SMA cylinder.
Distributions of σθ/p a through the thickness of the thin walled cylinder with different β.

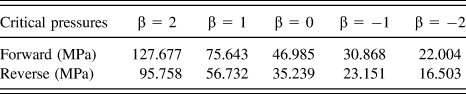
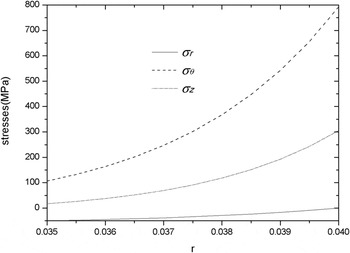
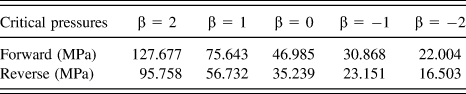
The critical internal pressure for the thin walled cylinder can be obtained by Eq. (29), and for different β, the critical internal pressure for the thin walled cylinder with a = 0.035 m, b = 0.040 m can be given in Table II. As seen in Table II, for different values of β, the critical pressures are different. Here we take β = 2, and the critical internal press for the forward phase transformation is p cr = 127.677 MPa. Then when the internal pressures are lower than p cr = 127.677 MPa, no transformation happens. So p a = 50 MPa is chosen to be used in calculating the real elastic stress distributions. The stress distributions through the thickness of SMA cylinder with β = 2 under the internal pressure p a = 50 MPa can be shown in Fig. 5. As seen in Fig. 5, the curves of (σr, σθ, σz) are monotonically increasing through the thickness of SMA cylinder.
The critical pressures for the thin walled cylinder with a = 0.035 m, b = 0.040 m.
Stress distributions through the thickness of the thin walled cylinder with β = 2 under the internal pressure p a = 50 MPa (without phase transformation).

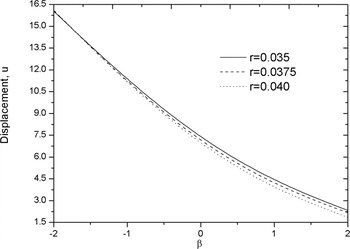
According to Table II, when the internal pressures are lower than p cr = 22.004 MPa, for different cases with β = 2, 1, 0, −1, −2, the materials are in the elastic state. Then the internal pressure p a = 20 MPa is chosen, and the displacement distributions through β at different r of SMA cylinder can be shown in Fig. 6. As seen in Fig. 6, all the curves are monotonically decreasing through material parameter β of SMA cylinder.
Displacement distributions through β at different r of the thin walled cylinder under the internal pressure p a = 20 MPa (without phase transformation).

As an example of the thick walled cylinder, we chose a = 0.025 m, b = 0.040 m. And the material parameters controlling the response of the structure plotted in this section are given in Table I.
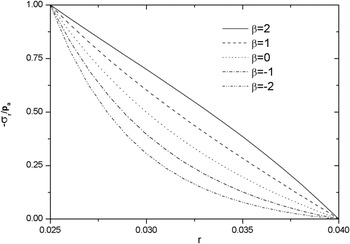
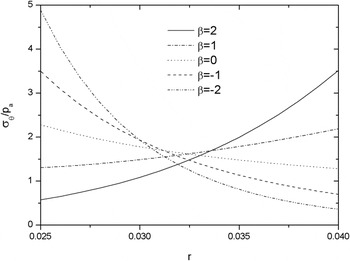
The distributions of −σr/p a and σθ/p a through the thickness of SMA cylinder with different β can be shown in Figs. 7 and 8. As seen in Fig. 7, the similar results with the thin walled cylinder can be obtained. The only difference is for the case β = 2, the curve is convex while the other curves are concave. As seen in Fig. 8, the similar results with the thin walled cylinder can be obtained. The only difference is the values of σθ/p a are lower than the thin walled cylinder.
Distributions of −σr/p a through the thickness of the thick walled cylinder with different β.

Distributions of σθ/p a through the thickness of the thick walled cylinder with different β.

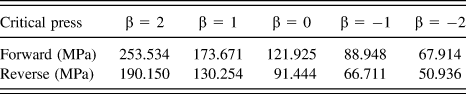
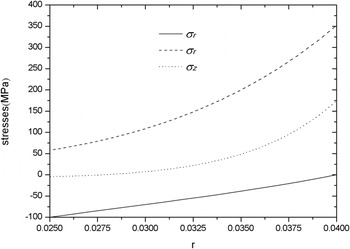
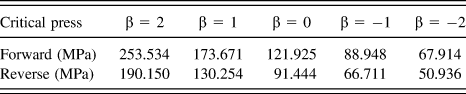
The critical internal press for the thick walled cylinder can be obtained by Eq. (29), and for different β, the critical internal pressure for the thick walled cylinder with a = 0.025 m, b = 0.040 m can be given in Table III. As seen in Table III, for different values of β, the critical pressures are different. Here, we take β = 2, and the critical internal press for the forward phase transformation is p cr = 253.534 MPa. Then when the internal pressures are lower than p cr = 253.534 MPa, no transformation happens. So p a = 100 MPa is chosen to be used in calculating the real stress distributions. The stress distributions through the thickness of the SMA cylinder with β = 2 under the internal pressure p a = 100 MPa can be shown in Fig. 9. As seen in Fig. 9, the similar results with the thin walled cylinder can be obtained. The only difference is the values of the stresses are lower than the thin walled case.
The critical pressures for the thick walled cylinder with a = 0.025 m, b = 0.040 m.
Stress distributions through the thickness of the thick walled cylinder with β = 2 under the internal pressure p a = 100 MPa (without phase transformation).

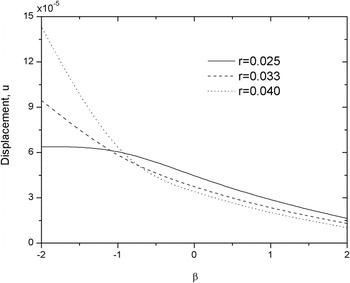
According to Table III, when the internal pressures are lower than p cr = 67.914 MPa, with different β = 2, 1, 0, −1, −2, all the cases are in elastic state. Then we choose the internal pressure p a = 50 MPa, and the displacement distributions through β at different r of the thick cylinder can be shown in Fig. 10. As seen in Fig. 10, all the curves are monotonically decreasing through the material parameter β of SMA cylinder. The displacement shows a lower value than the thin case.
Displacement distributions through β at different r of the thick walled cylinder under the internal pressure p a = 50 MPa (without phase transformation).

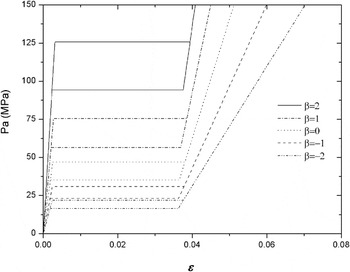
The ideal elasto-plastic constitutive model is used to express the macroscopic behaviors of SMA. For more suitable, here only the result of thin walled cylinder after the transformation happened will be discussed. And the similar result may be obtained in a similar way. According to Eq. (32), the relationship between the internal pressures and strain with at the inner radius with different β can be shown in Fig. 11. As seen in Fig. 11, with the changing values of β, the hysteretic curves are different.
The relationship between strain at inner radius and the internal pressures.

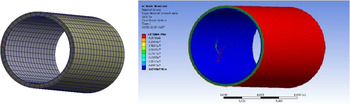
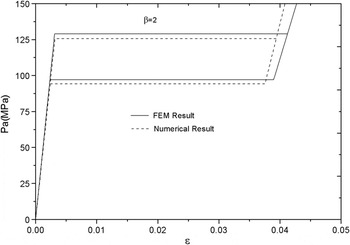
The numerical result by finite element (FE) program (ANSYS) is present in this part to verify the validity of the theoretical model. For simplifying the calculation of the model, consider that the Young’s modulus and Poisson’s ratio are continuously varying in r-direction, the layered method is used in the FE. As an example of the thin walled cylinder, here we chose a = 0.035 m, b = 0.040 m, L = 0.2 m. The material parameter is chosen as β = 2 in this model. The FE model here is established in software CATIA, and the cylinder is divided into 6 layers along r-direction, and the Young’s modulus and the Poisson’s ratio of each layer are determined by functions (6) and (7). Then the geometry model is imported into ANSYS Workbench 14.0. “Bonded” is chosen as the contact type to make it a whole. Automatic mesh is used here as the geometry model is simple and regular [seen in Fig. 12(a)]. The FE model is under inner pressure p a = 50 MPa. The stress field under pressure p a = 50 MPa is shown in Fig. 12(b). The relationship between strain at inner radius and internal pressures is shown a good agreement with the theoretical result in Fig. 13. As for the discrepancy in Fig. 13, different layers and mesh densities can bring out different results, so the FE results and theoretical results have some differences.
The FE model of thin walled cylinder with a = 0.035 m, b = 0.04 m, L = 0.2 m, β = 2.

Comparison of FE result and theoretical result at inner radius.

IV. CONCLUSION
The mechanical behaviors of FG-SMA cylinder under internal pressure were obtained in this work. It is found that the stress distribution in the SMA cylinder is significantly changed if the FGM theory is used. According to the comparisons of the influence by the different gradient parameters β, it’s obvious that the mechanical properties including the stress distributions, strain distributions and displacement distributions of the FG-SMA show a big effect by the different gradient parameters β or different gradient functions. The calculated results will help the engineer to design a pressure actuator made of FG-SMA with a reasonable distribution of stress, strain or displacement.
ACKNOWLEDGMENTS
The authors acknowledge the financial support of National Natural Science Foundation of China (Nos. 11502284; U1533103; 51505483; and 11272136) and it is also supported by the Fundamental Research Funds for the Central Universities (3122016C006) of China.