


Introduction
The recently discovered mineral heimite, PbCu2(AsO4)(OH)3·2H2O, has been suggested to form as a metastable precursor of duftite, PbCu(AsO4)(OH) (Malcherek et al., Reference Malcherek, Mihailova, Schlüter, Roth and Meisser2024). In addition to its type locality at the Grosses Chalttal deposit and other localities in the Swiss Alps (Malcherek et al., Reference Malcherek, Mihailova, Schlüter, Roth and Meisser2024), heimite has also been reported from the Laurion mining district, Greece (Branko Rieck, personal communication). Zanelliite, PbCu9[AsO3.5(OH)0.5]2(AsO4)2(OH)9(H2O)3 (Biagioni et al., Reference Biagioni, Roth, Reynes, Robyr and Meisser2024), is another new hydrous lead-copper-arsenate that occurs in association with heimite at the Grosses Chalttal deposit.
It was previously conjectured that the partial dehydration of heimite would inevitably lead to some of the Cu2+ cations in the heimite structure to become 5-fold coordinated by oxygen atoms (Malcherek et al., Reference Malcherek, Mihailova, Schlüter, Roth and Meisser2024). The new mineral presented here is a derivative of heimite, in which the Cu2+ ion is exclusively [4+1] coordinated, owing to the complete absence of molecular H2O. The layered crystal structure of metaheimite differs from the heimite structure by a relative shift of layers otherwise similar to those occurring in the heimite crystal structure.
The name metaheimite recognizes its similarity to heimite as well as the lack of water molecules coordinating the Cu-cations. The new mineral, its name and abbreviation, Mhim, have been approved by the Commission on New Minerals, Nomenclature and Classification of the International Mineralogical Association (IMA 2023-020a, Malcherek et al. Reference Malcherek, Mihailova, Schlüter, Roth and Meisser2025) and the holotype is deposited at the Museum der Natur Hamburg – Mineralogie, Leibniz-Institut zur Analyse des Biodiversitätswandels (LIB), Grindelallee 48, 20146 Hamburg, Germany, catalogue number ro-3702. Author-collected and studied samples of metaheimite and its associated mineral paragenesis are housed at the Département de géologie of Muséum cantonal des sciences naturelles (Naturéum), UNIL, 1015-Lausanne, Switzerland, catalogue numbers MGL 087051 to 087057.
Occurrence
As was the case with heimite, metaheimite was discovered on the dump of the Grosses Chalttal deposit, Mürtschenalp district, Glarus, Switzerland (47°04’09.9”N 9°11’26.5”E). The Grosses Chalttal deposit, like all the mines and small deposits that make up the Mürtschenalp district (Bächtiger, Reference Bächtiger1963), is located in the Helvetic nappes of eastern Switzerland, within the up-to-1000-m-thick Permian Verrucano formation, which consists of layered volcanic rocks, sandstones and conglomerates. During Oligocene–Miocene times, the Verrucano was pushed northwards at least 40 km along the famous Glarus Thrust above younger Cretaceous carbonates and Tertiary Flysh sediments (Badertscher et al., Reference Badertscher, Beaudoin, Therrien and Burkhard2001; Pfiffner, Reference Pfiffner2014). At Grosses Chalttal, the rock appears in its coarse fanglomeratic Sernifite facies (Letsch et al., Reference Letsch2014), as a pale grey to greenish breccia.
The Grosses Chalttal Cu and partly U mineralization has a sedimentary origin with at least two phases of later remobilization (Bächtiger, Reference Bächtiger1963). The primary ore assemblage is made mainly of bornite, tennantite and the uraninite variety pitchblende. A broad suite of secondary minerals, primarily arsenates and sulfates, with only rare carbonates, has been described (Meisser, Reference Meisser1999; Roth et al., Reference Roth, Zanelli and Meisser2025). Noteworthy is the presence of the rare Cu-arsenate euchroite. Malachite, brochantite, tyrolite, mimetite and chrysocolla are mineral species commonly associated with metaheimite. Because of the discovery of the type material in the form of a small sample on the mine dumps, a contextualization of the occurrence of the new mineral species in the ore body is not possible.
Appearance and physical properties
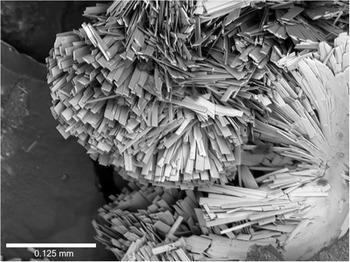
Metaheimite occurs as radial aggregates of up to 500 μm radius, composed of light blue to blue or turquoise blue, blade like crystals (Fig. 1 and 2). Single-crystal X-ray diffraction (XRD) analysis showed that metaheimite exhibits monoclinic symmetry and that the crystals are elongated along [100] and flattened normal to (001). Individual crystals measure up to 200 μm in length and 20 μm in width, with {001}, {100} and {010} being most prominent (Fig. 2).
Sheafs of radially grown metaheimite. Cotype sample, Museum of Nature - Mineralogy, Hamburg.

Scanning Electron Microscope (SEM) image of metaheimite.

Metaheimite exhibits a light blue streak and vitreous to silky lustre. Due to the small size and the extreme brittleness of the crystals no Mohs- or micro-indentation hardness could be determined. Fluorescence was not observed. Crystals of metaheimite show perfect cleavage on {001} and uneven fracture. The calculated density is 5.47 g cm–3, based on the empirical formula of grain1 (see below) and the cell volume obtained from single-crystal X-ray diffraction. Metaheimite is optically biaxial. The calculated average refractive index nav(calc) = 1.894 is based on an ideal formula with three hydrogen atoms. Based on the empirical formula for grain 1, nav(calc) = 1.885. The a:b:c ratios calculated from the single crystal unit-cell parameters are 0.753: 1: 1.792.
Experimental details
Infrared spectroscopy
Fourier-transform infrared (FTIR) spectra of heimite and metaheimite were measured in a transmission mode from single-crystal specimens that had been previously analysed by XRD, using a Bruker Invenio FTIR spectrometer equipped with a Hyperion 2000 microscope and LN2-cooled MCT detector. The crystals, ∼0.01 mm thick, were deposited on a KBr window and orientated with (001) perpendicular to the IR beam. Spectra in the range 620–7000 cm–1 were collected with a 15× objective, scanner velocity 20.0 kHz, an instrumental spectral resolution of 2 cm–1 and averaged over 512 scans. The as-measured spectra were corrected only for the contribution from atmospheric H2O and CO2, using the corresponding option implemented in the OPUS software package. The lateral beam size was restricted by a rectangular aperture that equals the respective size of the crystal. Resolved 1st-order IR absorption signals of metaheimite occur at 673, 773, 837, 1015, 1090, 2851, 2925, 3450 and 3612 cm–1.
Raman spectroscopy
The same single crystals of heimite and metaheimite were further subjected to polarized Raman spectroscopy in back-scattering experimental geometry, using a Horiba Jobin-Yvon T64000 triple-monochromator spectrometer equipped with an Olympus BX41 microscope and an LN2-cooled Symphony CCD detector. For measurements in  $\bar z\!\left({xx}\right)\!z$,
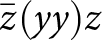 $\bar z\!\left({yy}\right)\!z$, and
 $\bar z\!\left({yx}\right)\!z$ geometries with x || a, z || c, y ⟂ to x and z, crystals were placed on gold wafers on their (001) face [experimental geometry given in Porto’s notations, ki(EiEs)ks, in which ki and ks are the wave vectors of incident and scattered light, while Ei and Es are the polarization vectors of incident and scattered light, Damen et al. (Reference Damen, Porto and Tell1966)], Measurements in
 $\bar y\!\left({zz}\right)\!y$ and
 $\bar y\!\left({xz}\right)\!y$ geometries were performed on crystals glued to a glass fibre, so that [001] could be orientated normal to the incident light. The spectra were excited with the green line (λ = 514.532 nm) of an Ar+ laser (Coherent Innova 90C FreD). In order to prevent sample overheating during the measurements, a low laser power of 735 μW on the sample surface and laser-spot diameter of 2 μm was used. The instrumental accuracy in determining the peak position was ∼0.35 cm–1, while the spectral resolution was ∼1.9 cm–1. The as-measured spectra were baseline corrected for the weak continuum photoluminescence background, using a spline interpolation, and then temperature reduced, to account for the Bose-Einstein distribution of phonons. The range 2600–3800 cm–1 of the Raman spectra, generated by stretching modes of OH– and H2O, was fitted with pseudo-Voigt functions to determine the peak positions, full widths at half maximum and relative intensities. Additional Raman spectra were collected from several spatial points to verify the repeatability of the data. Test measurements conducted with the 488.0-nm laser line confirmed that all observed peaks in the range 15–3300 cm–1 are Raman-scattering signals, i.e. originate from inelastic light scattering by atomic vibrations, and none are sharp photoluminescence signals from plausible impurities of ppm concentrations.
Electron microprobe analysis
Two small grains of metaheimite were embedded in epoxy and carbon coated. Small size and brittleness of the crystals prevented the sample surface from being perfectly planar and crack free, which may account for slightly low oxide sums. Wavelength dispersive spectra were measured using a Cameca SX 100 with 15 kV, 20 nA and a beam diameter of ∼5 µm. H2O was not directly determined due to the small amount of material available, but the presence of OH-groups and the absence of significant molecular H2O is confirmed by infrared and Raman spectroscopy. H2O content estimated by difference to 100% was included in the ZAF matrix correction. Wollastonite (34.5 Ca, 24.18 Si, 41.32 O), olivenite (44.91 Cu, 0.36 H, 26.47 As, 28.26 O) and a Pb-glass (51.63 Pb, 13.52 Si, 0.16 Al, 0.05 Fe, 0.05 Mg, 11.2 Zn, 0.02 Na, 0.02 K, 22.36 O) were used as standards (compositions in wt.%).
X-ray diffraction
Single-crystal and powder XRD studies were carried out using a Nonius KappaCCD single crystal diffractometer with graphite monochromated MoKα radiation (λ = 0.71075 Å). Pixel integration and data reduction were performed with the Eval15 program suite (Schreurs et al., Reference Schreurs, Xian and Kroon-Batenburg2010). A numerical absorption correction based on crystal morphology was calculated using Sadabs (SADABS-2008/1).
Powder XRD data were collected using Gandolfi-type motion of a polycrystalline aggregate of metaheimite mounted on a glass fibre at 60 mm detector distance. Powder rings up to 2θ = 30° were integrated using the program Fit2d (Hammersley, Reference Hammersley2016). Unit cell parameters were obtained by Rietveld refinement, with all atomic parameters and the β-angle fixed at values obtained by single-crystal XRD. Appropriate profile parameters were obtained by LeBail refinement of a similarly measured Si powder standard.
Results
Chemical composition
Results of electron microprobe analyses of metaheimite are reported in Table 1. Assuming 3 H atoms and normalizing to 7 anions, empirical formulas of (Pb0.96Ca0.03)Σ0.99Cu1.98(As1.01O4)(OH)3 and Pb0.99Cu1.99(AsO4)(OH)3 can be obtained for grain 1 and grain 2 respectively. The simplified formula of metaheimite is (Pb,Ca)Cu2(AsO4)(OH)3. The ideal formula is PbCu2(AsO4)(OH)3, which requires CuO 30.36, PbO 42.56, As2O5 21.93, H2O 5.15, total 100 wt.%.
Chemical composition of metaheimite in oxides (wt.%)

Table 1 Long description
The table reports oxide weight percent compositions for two analysed grains, giving mean values plus ranges and standard deviations for measured oxides, and listing probe standards. In Grain 1, lead oxide averages 40.85 wt.% and copper oxide averages 29.96 wt.%, with arsenic oxide at 22.10 wt.% and calcium oxide low at 0.30 wt.%. In Grain 2, lead oxide averages 41.38 wt.% and copper oxide 29.51 wt.%, with arsenic oxide 21.53 wt.% and calcium oxide 0.05 wt.%. Calculated water is about five wt.% in both grains, and totals are 98.34 wt.% for Grain 1 and 97.50 wt.% for Grain 2. Grain 1 shows wider variability than Grain 2 for copper oxide, arsenic oxide, and calcium oxide, reflected in larger ranges and standard deviations. The main difference between grains is slightly higher lead oxide and lower calcium oxide in Grain 2, while copper and arsenic oxides are broadly similar. Water values are calculated rather than directly measured, and totals below one hundred percent indicate minor unmeasured components and analytical uncertainty.
Notes: S.D. – standard deviation; *H2Ocalc based on structure refinement with 3 H atoms.
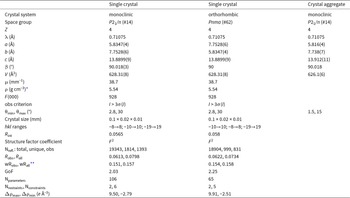
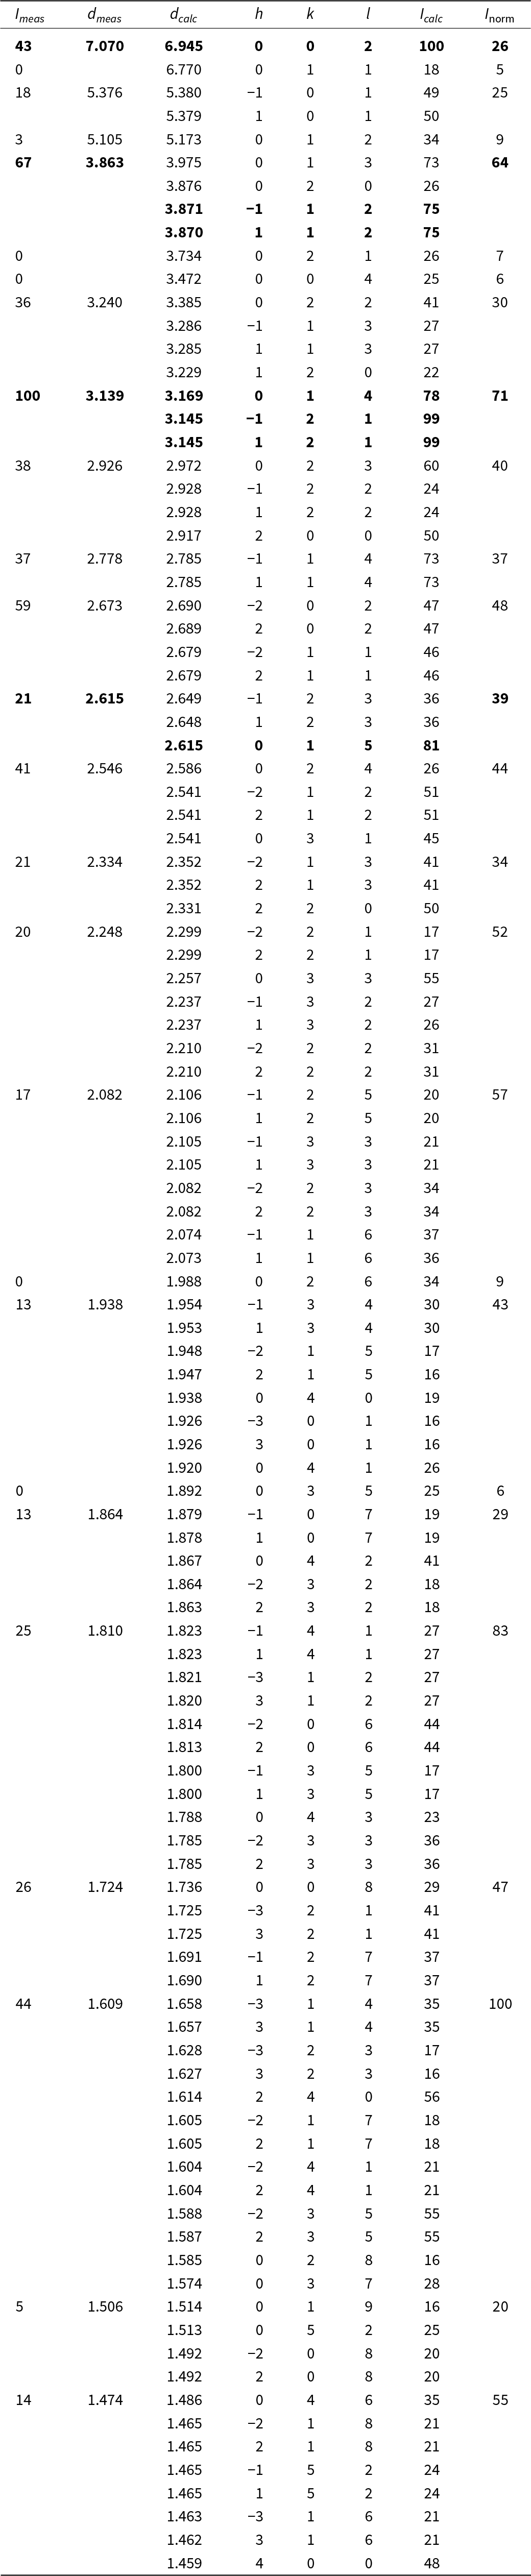
The results of the XRD measurements are summarized in Table 2. Powder XRD data for metaheimite are compiled in Table 3. The values d calc and I calc have been calculated from single-crystal diffraction data using the program JANA2006 (Petříček et al., Reference Petříček, Dušek and Palatinus2014). Peak positions d meas and intensities, I meas, have been obtained using Gaussian profile fitting of the observed powder diffraction profile. Only those lines with calculated relative intensity I calc > 15% are included in Table 3. Inorm has been normalized to the sum of overlapping reflection intensities I calc, providing a better match for the intensities I meas of the observed, broad reflections in the powder diffraction profile.
Crystal properties of metaheimite

Table 2 Long description
The table reports crystallographic and refinement parameters for metaheimite from a single-crystal dataset, an orthorhombic setting of the same metrics, and a crystal-aggregate dataset. The single-crystal and aggregate entries are monoclinic with space group P21/n, while the alternate setting is orthorhombic with space group Pnma. Unit-cell edges are very similar across columns: a and b swap between the monoclinic and orthorhombic settings (about 5.83 and 7.75 angstroms), c is about 13.89 to 13.91 angstroms, and the beta angle is essentially 90 degrees. Cell volume is consistent at about 628 cubic angstroms for the single-crystal and orthorhombic setting and about 626 cubic angstroms for the aggregate. Single-crystal-only metadata include Z of 4, wavelength 0.71075 angstrom, absorption coefficient 38.7 per millimeter, density 5.54 grams per cubic centimeter, and F zero zero zero of 928. Data collection and refinement quality indicators are comparable between the two refined datasets: Rint about 0.056 to 0.058, Robs about 0.061 to 0.062, weighted R about 0.151 to 0.154, and goodness of fit about 2.03 to 2.25. The single-crystal refinement used more reflections and more parameters than the alternate setting, and both show sizable residual electron-density extremes, so comparisons should consider differences in data completeness and refinement model size.
* Density based on ideal formula, PbCu2(AsO4)(OH)3
** Weighting scheme w = 1/(σ2(I)+0.025 I 2)
Powder X-ray diffraction data (d in Å) for metaheimite. The seven strongest calculated lines are given in bold

Table 3 Long description
Powder X-ray diffraction peak list for metaheimite, reporting measured and calculated d spacings in angstroms, Miller indices, and calculated intensities with a normalized scale. The highest measured intensity is 100 at dmeas 3.139 Å, close to dcalc 3.169 Å, indexed to 0 1 4, with additional calculated contributions at about 3.145 Å. Other strong measured peaks include 67 at dmeas 3.863 Å (near dcalc 3.975 Å, 0 1 3) and 43 at dmeas 7.070 Å (near dcalc 6.945 Å, 0 0 2). Mid-strength measured peaks occur at dmeas 3.240 Å with intensity 36, 2.926 Å with intensity 38, 2.778 Å with intensity 37, 2.673 Å with intensity 59, 2.546 Å with intensity 41, and 1.609 Å with intensity 44. Several rows list multiple calculated reflections at nearly the same d spacing, indicating overlapping peaks that may contribute to a single measured line. Some calculated lines have no measured intensity reported, so absence in the measured columns may reflect detection limits or reporting choices rather than true absence. Overall, measured and calculated d spacings generally agree closely, supporting the indexing assignments across the listed peaks.
Crystal structure
The crystal of metaheimite used for this study was a blade extending along [100], ∼0.1 mm long, 0.01 mm thick and 0.02 mm wide. It consists of at least three fragments, each tilted by ∼9° around approximately the direction of crystal elongation. The main domain accounts for 64% of the crystal volume. The structure was solved using Superflip (Palatinus and Chapuis, Reference Palatinus and Chapuis2007) and refined using JANA2006 based on 19343 non-overlapping reflections of the main domain, averaged to 1814 unique reflections. Scattering factors of the uncharged atoms were used for the refinement, which converged to R obs = 6.1%, with the largest residual electron density Δρmax (Table 2) occurring at 1.39 Å distance from the position of the Pb atom. Probable causes of this and other residual maxima as well as the high R-factor are absorption artifacts and crystal fragmentation.
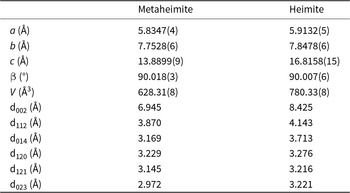
The crystal structure of metaheimite is closely related to that of heimite (Malcherek et al., Reference Malcherek, Mihailova, Schlüter, Roth and Meisser2024). It results from different stacking of structural layers similar to those observed in heimite. Unit cell parameters and selected d-spacings of the two minerals are compared in Table 4.
Cell parameters and calculated positions of strong powder diffraction lines of heimite compared to those of metaheimite

Table 4 Long description
The table compares crystallographic cell parameters and selected strong powder diffraction line spacings for metaheimite and heimite. Unit-cell edges are larger for heimite: a 5.9132 versus 5.8347 angstroms, b 7.8478 versus 7.7528 angstroms, and c 16.8158 versus 13.8899 angstroms. The beta angle is near 90 degrees for both, with only very small differences. Cell volume is higher for heimite at 780.33 cubic angstroms compared with 628.31 cubic angstroms for metaheimite. Diffraction spacings are generally longer for heimite, including d002 8.425 versus 6.945 angstroms, d112 4.143 versus 3.870 angstroms, and d014 3.713 versus 3.169 angstroms. Several other listed spacings also increase slightly, such as d120 3.276 versus 3.229 angstroms and d121 3.216 versus 3.145 angstroms, while d023 rises to 3.221 from 2.972 angstroms. Values in parentheses indicate measurement uncertainty in the last digits, so small differences should be interpreted with that precision in mind.
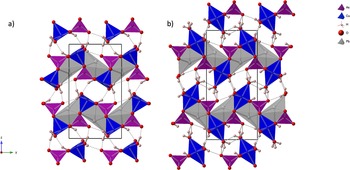
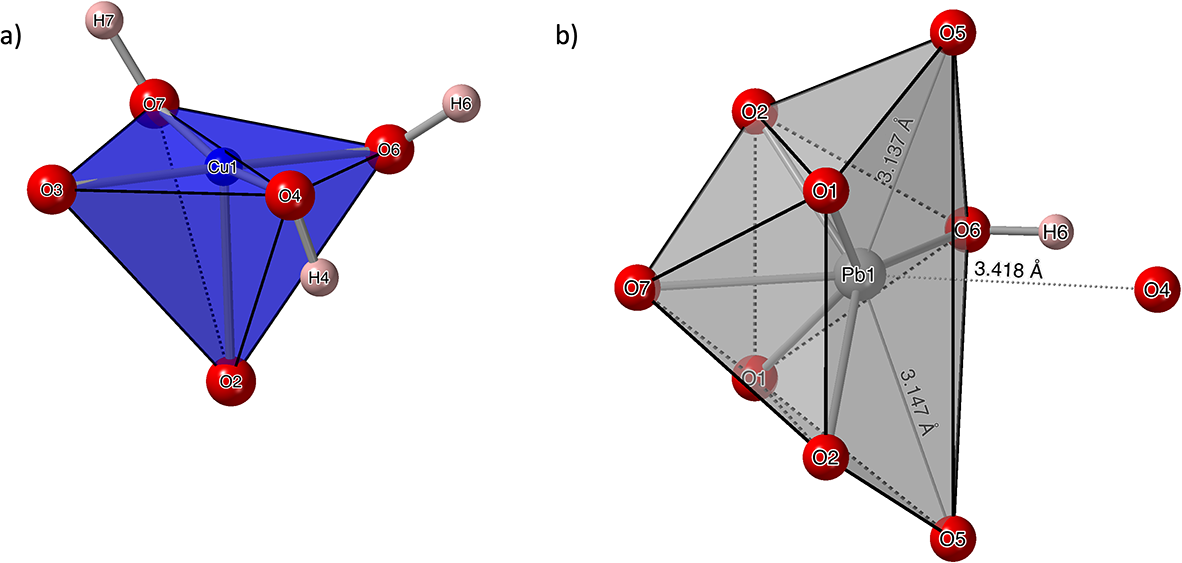
The two crystal structures in projection along [100] are compared in Fig. 3. Crystal structure drawings have been prepared using CrystalMaker X (Palmer, Reference Palmer2015). As no molecular H2O could be located in metaheimite, Cu2+ is only [4+1], rather than [4+2]-coordinated as in heimite (Malcherek et al., Reference Malcherek, Mihailova, Schlüter, Roth and Meisser2024), forming tetragonally elongated and edge-sharing CuO5-square pyramids (Fig. 4a), with their tips pointing along [011] and [0 $\bar 1$1]. The resulting [100] chains of square pyramids are laterally connected by AsO4-tetrahedra and by [6+2]-coordinated Pb2+-cations (Fig. 4b), thus forming layers parallel to (001). These layers are mutually connected by hydrogen bonding (Table 5).
Crystal structure of metaheimite (a) and of heimite (b) in projection along [100]. Dashed lines indicate hydrogen bonding.

Figure 3 Long description
Image a of copper, arsenic and lead polygons in metaheimite has no interlayer H2O. Image b of heimite has interlayer H2O. The different hydrogen bonding scheme has shifted the layers of polygons so the unit cell is larger in heimite.
Hydrogen bonding of metaheimite. Calculated O–H stretching frequencies (Libowitzky, Reference Libowitzky1999) are given in the final column (D = Donor, A = Acceptor)

Table 5 Long description
The table lists three hydrogen bonds, identifying each donor oxygen, its hydrogen, and the acceptor oxygen, along with donor to hydrogen, hydrogen to acceptor, and donor to acceptor distances, the bond angle, and a calculated O to H stretching frequency. O6 donating H6 to O5 is the tightest interaction, with the shortest hydrogen to acceptor distance of 1.62 angstroms, the shortest donor to acceptor distance of 2.590 angstroms, and the largest angle at 162.2 degrees. This same O6 to O5 bond also has the lowest stretching frequency, 2663 per centimeter, consistent with a stronger hydrogen bond. The other two bonds, O4 to O5 and O7 to O4, have longer hydrogen to acceptor distances of 2.22 and 1.97 angstroms and higher frequencies of 3572 and 3513 per centimeter. Their donor to acceptor distances are also longer, 3.099 and 2.917 angstroms, and their angles are similar at about 152 to 153 degrees. Two rows report measurement uncertainty in parentheses for several distances and angles, while the O6 to O5 row provides fewer uncertainties, so precision may not be uniform across entries.
Square-pyramidal Cu-coordination polyhedron (a) and [6+2] Pb-coordination (b), also showing the more distant O4 anion.

Figure 4 Long description
Image A shows a square-pyramidal Cu-coordination polyhedron with five oxygen atoms surrounding a central copper atom. The structure is depicted with edges connecting the oxygen atoms to the copper atom, forming a square pyramid. Image B displays a [6+2] Pb-coordination polyhedron with eight oxygen atoms surrounding a central lead atom. The structure is shown with edges connecting the oxygen atoms to the lead atom, forming a complex polyhedral shape. Distances between certain oxygen atoms are labeled, such as 2.419 angstroms and 3.214 angstroms, indicating spatial relationships within the structure.
Each Cu2+ cation shares two of its oxygen ligands with neighbouring As5+ cations. The remaining oxygen ligands form OH-groups. Positions of hydrogen atoms were either obtained from difference-Fourier maxima (atoms H4, H7) or inferred from tetrahedral coordination of the donor oxygen atom (atom H6). Bond length restraints (O4–H4, O7–H7) and constraints (O6–H6) of 1 Å were imposed for the OH-groups and isotropic H displacement factors were coupled to the donor oxygen displacements by a factor of 1.2.
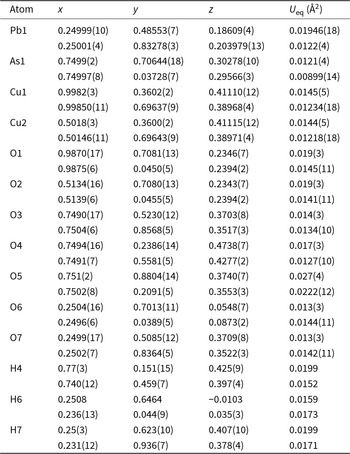
As can be seen in Fig. 3, the absence of interlayer H2O molecules in metaheimite requires the layers to shift relative to each other, resulting in a different hydrogen bonding scheme compared to heimite and in smaller Cu–Cu distances between adjacent layers (Fig. 3). The layer-shift manifests itself by a change in the y-coordinate of approximately –⅓ for all atoms relative to their positions in the heimite structure (Table 6). The smaller interlayer spacing and lack of water molecules are responsible for the significantly smaller c unit-cell parameter of metaheimite in comparison to heimite (Table 4).
Atomic positions and equivalent isotropic displacement factors, U eq, of metaheimite. Corresponding parameters for heimite are given below each line

Table 6 Long description
The table lists fractional atomic positions (x, y, z) and equivalent isotropic displacement factors (Ueq, in square angstroms) for metaheimite, with the corresponding heimite values given on the line beneath each atom. Heavy atoms have low Ueq: Pb1 is about 0.0195 in metaheimite versus about 0.0122 in heimite, and As1 is about 0.0121 versus about 0.0090. Copper sites are similar between phases, with Cu1 and Cu2 near x 1.0 and 0.5 and Ueq about 0.0145 in metaheimite and about 0.0122 to 0.0123 in heimite. Oxygen atoms span Ueq from about 0.013 to 0.027 in metaheimite and about 0.0127 to 0.0222 in heimite, with O5 having the highest Ueq in both phases. Across most atoms, heimite shows lower Ueq than metaheimite, suggesting reduced apparent atomic motion or disorder in the heimite refinement. Several y coordinates differ strongly between phases while x and z are often close, indicating a shift in the y fractional position between the two structures. Values in parentheses indicate reported uncertainties, and some hydrogen entries have fewer digits, so comparisons involving hydrogen are less precise.
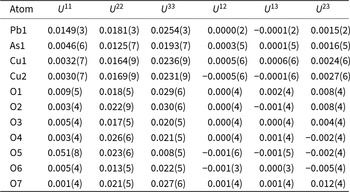
Anisotropic displacement factors are given in Table 7. Some of the oxygen atoms, O7 in particular, exhibit very small U 11 displacement factors, which are attributed to absorption effects. The displacement factors remain almost identical in the orthorhombic structure model.
Anisotropic displacement factors of metaheimite in Å2

Table 7 Long description
The table lists anisotropic displacement factors for each atom site, giving U11, U22, U33 and the cross terms U12, U13, and U23, with uncertainties in parentheses. Pb1 has moderate principal values, with U33 higher than U11 and U22, and cross terms near zero except a small positive U23. As1 and both copper sites have low U11 but noticeably higher U22 and U33, indicating stronger displacement along those directions than along the first axis. Among oxygen sites, O5 is the clear outlier with a very large U11 compared with its U22 and especially its small U33, suggesting strongly directional motion or disorder at that site. Several other oxygens show higher U33 than U11, such as O1, O2, O6, and O7, while O4 has its largest value in U22. Cross terms are generally close to zero for most atoms, but O7 has the largest positive U23 and O6 shows a small negative U23. Values should be interpreted with their reported uncertainties, and small differences may not be meaningful when uncertainties overlap.
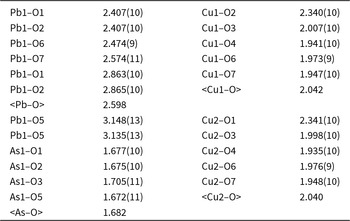
Selected bond distances are shown in Table 8. The closest oxygen atom in a neighbouring layer that could serve to complete the Cu coordination to a [4+1+1] coordination is O3 at 3.49 Å distance. This is further than the distance to the nearest Cu-atom (3.29 Å) in that same layer. Similar to heimite, intrachain Cu–Cu distances amount to 2.9 Å on average. The mean Cu–O bond lengths (Table 8) are in good agreement with the grand mean value of 2.040 Å reported by Eby and Hawthorne (Reference Eby and Hawthorne1990) for square pyramidal Cu coordination observed in nine different mineral species.
Selected bond distances in Å

Table 8 Long description
Bond distances in angstroms are listed for lead, copper, and arsenic atoms bonded to oxygen, with uncertainties given in parentheses for most entries. Lead to oxygen distances range from about 2.41 Å for Pb1 to O1 and Pb1 to O2 up to about 3.15 Å for Pb1 to O5, indicating both shorter bonds and longer contacts. The average lead to oxygen distance is 2.598 Å. Copper site Cu1 has distances from about 1.94 Å for Cu1 to O4 to about 2.34 Å for Cu1 to O2, with an average of 2.042 Å. Copper site Cu2 is similar, ranging from about 1.94 Å for Cu2 to O4 to about 2.34 Å for Cu2 to O1, averaging 2.040 Å. Arsenic to oxygen distances are tightly grouped from about 1.67 Å to 1.71 Å, averaging 1.682 Å, making them the shortest set in the table. Comparisons should note that some atom pairs repeat and that uncertainties vary slightly across measurements.
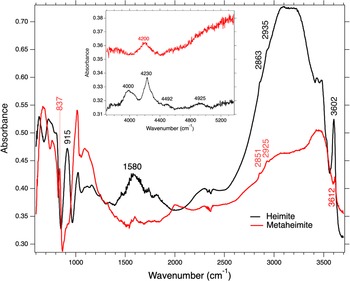
The presence of hydrogen bonds is confirmed by the infrared absorption spectrum (Fig. 5) and by polarized Raman spectra (Fig. 6). Due to the difference in the thickness of measured specimens, the IR spectrum of heimite presented in Fig. 5 is of better quality than that previously published (Malcherek et al., Reference Malcherek, Mihailova, Schlüter, Roth and Meisser2024). The comparison with the metaheimite IR spectrum clearly demonstrates the presence of H2O in heimite by much stronger IR absorption in the range 3100–3230 cm–1 and near 1580 cm–1, corresponding to water stretching and bending modes respectively.
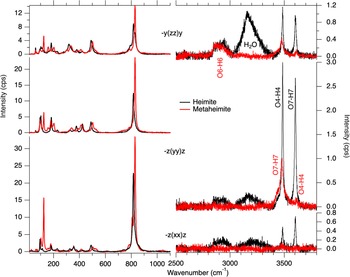
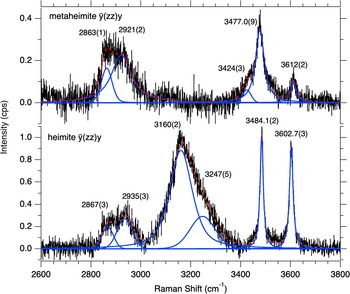
The sharp OH-stretching peak at 3612 cm–1 is close to that observed at 3602 cm–1 in heimite (Fig. 5). The corresponding Raman signals (Fig. 6) occur at 3612.7(3) cm–1 and 3602(2) cm–1 respectively, but the Raman intensity is much weaker in metaheimite compared to heimite. For both minerals the intensity of this OH-stretching mode is stronger in  $\bar z\!\left( {yy} \right)\!z$ and
 $\bar y\!\left({zz}\right)\!y$ than in
 $\bar z\!\left({xx}\right)\!z$ spectra, indicating that the hydroxyl bonds generating this mode are oriented predominantly to be within the (100) plane. Considering the longest hydrogen bond O4–O5 (Table 5) and the O4–H4 bond orientation from structure refinement, the 3612 cm–1 signal is assigned to O4–H4 stretching in metaheimite, while the assignment of the 3602 cm–1 signal to O7–H7 bond stretching in heimite is confirmed. Figure 7 shows details in the range between 2600 and 3800 cm–1, with peaks fitted to the Raman signals in the
 $\bar y\!\left({zz}\right)\!y$ spectra of heimite and metaheimite.
The Raman spectra of heimite in Fig. 6 show another very sharp OH-stretching mode at 3484.1(2) cm–1. This can be assigned to O4–H4 bond stretching. In metaheimite, a comparable, but broader signal appears at 3477 cm–1. This is assigned to O7–H7 bond stretching, with an O7–O4 hydrogen bond length of 2.917 Å (Table 5). Both Raman signals in heimite as well as in metaheimite have shoulders at their low frequency side, most evident in the  $\bar z\!\left( {yy} \right)\!z$ spectrum. The relative intensity of this shoulder is higher in metaheimite, where it can also be observed in the
 $\bar y\!\left( {zz} \right)\!y$ spectrum at 3424(3) cm–1 (Fig. 6). It may be attributable to static or dynamic H-disorder along the chain of hydrogen bonds O5—H4–O4—H7–O7.
Only heimite shows a broad H2O stretching signal in the frequency range 3020–3400 cm–1 (Fig. 6). The signal is most prominent in the  $\bar y\!\left( {zz} \right)\!y$ polarized spectrum and consists of a stronger peak at 3160(2) and a weaker peak at 3247(5) cm–1 (Fig. 7), related to the stretching modes of H2O. The absence of this signal in metaheimite clearly indicates the absence of H2O molecules in this mineral.
Infrared absorption spectrum of metaheimite (red) and heimite (black). The inset shows the near infrared range between 3800 and 5500 cm–1, generated by combinational modes of hydrous species.

Figure 5 Long description
The x-axis is labeled Wavenumber (cm superscript -1), ranging from 0 to 3800. The y-axis is labeled Absorbance, ranging from 0.30 to 0.70. Two line series are shown with a legend: Heimite and Metaheimite. Heimite: The curve starts near 0.50 at low wavenumber, shows multiple narrow features below about 1000, then rises and forms a broad high region between about 2700 and 3300. Labeled values on this curve are 2863 and 2985 near the high region and 3602 near the right side where the curve drops steeply toward about 0.30 by 3800. A labeled feature at 1580 appears near mid-range. Metaheimite: The curve starts near about 0.35 at low wavenumber, shows narrow features below about 1000, then stays near about 0.33 to 0.40 through much of the mid-range. It rises between about 2500 and 3500, reaching around 0.50 to 0.55, then drops sharply near the far right. Labeled values on this curve are 837, 2851, 2925 and 3612. An inset plot appears in the upper left. The inset x-axis is labeled Wavenumber (cm superscript -1), spanning approximately 3800 to 5200. The inset y-axis is labeled Absorbance, spanning approximately 0.31 to 0.38. Two curves are shown in the inset with labeled positions 4000, 4200, 4230, 4482 and 4895.
Parallel polarized Raman spectra of metaheimite (red) and of heimite (black) with the incident-light polarization parallel to [100] ( $\bar z\!\left( {xx} \right)\!z$), [010] (
 $\bar z\!\left( {yy} \right)\!z$) and [001] (
 $\bar y\!\left( {zz} \right)\!y$).

Figure 6 Long description
Three stacked line graphs with two overlaid spectra in each graph. Top graph: The y-axis is labeled Intensity (cps), ranging from 0 to 12. The x-axis is labeled Wavenumber (cm superscript minus 1), ranging from 0 to 4000 with labeled ticks at 200, 400, 600, 800, 1000, 1200, 1400, 1600, 1800, 2000, 2200, 2400, 2600, 2800, 3000, 3200, 3400, 3600, 3800 and 4000. A legend shows Heimite and Metaheimite. The spectra show multiple narrow peaks below about 1200, including a very tall narrow peak near about 800 to 900. From about 1200 to 2800 the traces are near baseline with small fluctuations. From about 3000 to 3800 there is a broad band in the Heimite trace with a peak near the mid 3000s, while the Metaheimite trace shows smaller features in the same region. Middle graph: The y-axis is labeled Intensity (cps), ranging from 0 to 20. The x-axis is labeled Wavenumber (cm superscript minus 1), ranging from 0 to 4000 with the same labeled ticks as the top graph. The legend again shows Heimite and Metaheimite. The spectra show several narrow peaks below about 1200, including a very tall narrow peak near about 800 to 900. Between about 1200 and 2800 the traces remain close to baseline with small fluctuations. In the region from about 3000 to 3800, the Heimite trace shows a broad band with a prominent maximum in the mid 3000s, while the Metaheimite trace shows a lower-amplitude rise and smaller peaks. Bottom graph: The y-axis is labeled Intensity (cps), ranging from 0 to 30. The x-axis is labeled Wavenumber (cm superscript minus 1), ranging from 0 to 4000 with the same labeled ticks as the other graphs. The legend shows Heimite and Metaheimite. The spectra show narrow peaks below about 1200, including a very tall narrow peak near about 800 to 900. From about 1200 to 2800 the traces are near baseline with small fluctuations. From about 3000 to 3800, the Heimite trace rises into a broad band with a peak in the mid 3000s, while the Metaheimite trace shows a smaller rise and smaller peaks in the same region.
Enlarged and peak deconvoluted section of the  $\bar y\!\left( {zz} \right)\!y$ Raman spectra of metaheimite (top) and of heimite (bottom).

Figure 7 Long description
Two stacked line plots labeled metaheimite y(zz)y and heimite -y(zz)y. Metaheimite plot: The y-axis is labeled Intensity (a.u.), with tick labels 0.0, 0.2 and 0.4. The x-axis is labeled Raman Shift (cm superscript minus 1), ranging from 2600 to 3800 with tick labels at 2600, 2800, 3000, 3200, 3400, 3600 and 3800. A black spectrum trace is overlaid with multiple blue fitted curves and a red fitted line. Peak labels shown are 2863(1), 2921(2), 3160(2), 3424(3), 3477.0(9) and 3612(2). Heimite plot: The y-axis is labeled Intensity (a.u.), with tick labels 0.0, 0.4 and 0.8. The x-axis is labeled Raman Shift (cm superscript minus 1), ranging from 2600 to 3800 with tick labels at 2600, 2800, 3000, 3200, 3400, 3600 and 3800. A black spectrum trace is overlaid with multiple blue fitted curves and a red fitted line. Peak labels shown are 2867(3), 2935(3), 3160(2), 3247(5), 3484.1(2) and 3602.7(3).
Between 2820 and 3010 cm–1 another broad signal is evident in the Raman spectra of both heimite and metaheimite. In metaheimite this can be decomposed into two broad peaks located at 2863(1) and 2921(2) cm–1, while in heimite the respective peaks are located at 2867(3) and 2935(3) cm–1 (Fig. 6). While this doublet is present in all three parallel polarized spectra  $\bar z\!\left({xx}\right)\!z$,
 $\bar z\!\left({yy}\right)\!z$ and
 $\bar y\!(zz)y$ for heimite, it is only present in the
 $\bar y\!\left( {zz} \right)\!y$ spectrum for metaheimite (Fig. 6), indicating nearly perfect orientation of the corresponding hydrogen bond along [001] in the latter. Comparing with Table 5, these signals would best match the O6–H6 bond stretching. In heimite, O6–H6 participates in significantly longer, but similarly aligned hydrogen bonds with O4 instead, while similarly short hydrogen bonds (2.68 Å) towards O5 would involve the water molecules. The reason for the similar splitting of this O-H bond stretching signal by about 60 cm–1 in both minerals is not fully understood. A possible explanation may be anharmonic oscillation or splitting of the O5 ligand of the AsO4 tetrahedron. The relatively large U 11 anisotropic displacement parameter (Table 7), which is similarly observed in heimite, might be indicative of this.
The above OH- and H2O-stretching modes can also be observed in the respective IR absorption spectra (Fig. 5), but the details are more obvious in the polarized Raman spectra. Combination modes observed in the near infrared part of the spectra (Fig. 5, inset) further support the absence of H2O in metaheimite: in the range 4000–5400 cm–1, only a single peak at 4200 cm–1 is observed, which originates from a combination of stretching and libration modes of hydroxyl groups (e.g. Della Ventura et al., Reference Della Ventura, Hawthorne, Mihailova and Sodo2021). In strong contrast, heimite exhibits multiple 2nd-order infrared absorption signals in the same range, indicating the co-presence of different types of hydrous species. The peak near 4230 cm–1 corresponds to stretching and libration of hydroxyl groups, whereas the peaks at 3985–4040, ∼4492 and ∼4925 cm–1 most probably involve fundamental modes of H2O. For example, the two-component IR band at 3985–4040 cm–1 could be due to a combination of the IR-active stretching of water molecules near 3105–3232 cm–1 and Raman-active AsO4 stretching at 810 cm–1; note that according to group theory, for centrosymmetric crystals like heimite, 2nd-order IR activity requires a combination of one Raman-active and one IR-active mode (Della Ventura et al., Reference Della Ventura, Hawthorne, Mihailova and Sodo2021). The peaks near 4492 and 4925 cm–1 could arise from combinational modes of water bending and hydroxyl stretching or higher-order combinational modes of hydroxyl stretching and librations; the unambiguous assignment is hindered by the complexity of hydrous species existing in heimite.
The low-frequency part of the spectra in Figs 5 and 6 shows many similarities between heimite and metaheimite. An intense Raman peak at 125 cm–1 is unique to metaheimite, however, with highest intensity observed in the  $\bar z\!\left({xx} \right)\!z$ spectrum. This might be attributable to the different Cu-coordination in both minerals.
Another apparent difference in the IR spectra measured in the experimental geometry described above (the IR beam perpendicular to the natural plate-like surface) can be seen in the AsO4 stretching range, as metaheimite exhibits a strong IR absorption peak at 837 cm–1, which is not observed in heimite, while the IR absorption peak at 915 cm–1 in the spectrum of heimite is much weaker for metaheimite and appears as a shoulder of the IR absorption signal near 1012 cm–1 (Fig. 5). The strongest Raman-active phonon mode related to AsO4 stretching vibration appears at 828 cm–1 for metaheimite and at 816 cm–1 for heimite (Fig. 6).
Discussion
Similarly to heimite, metaheimite is pseudo-orthorhombic with a parent symmetry of Pnma. While the monoclinic symmetry of heimite was inferred from the necessity of neighbouring H2O molecules to be non-equivalent, these molecules are absent in metaheimite. The small metric distortion is nevertheless more pronounced than in heimite and probably caused by strong and asymmetric hydrogen bonding between the layers. Table 2 compares the refinement results for the monoclinic and the orthorhombic structure models. The structure data of the orthorhombic refinement are made available in the cif (see supplementary data below). The monoclinic symmetry renders adjacent Cu atoms along the [100] chains inequivalent. At least for heimite, the monoclinic distortion is confirmed by the polarized Raman spectra (Fig. 6), as in the orthorhombic structure, O–H-bonds would have to reside on mirror planes normal to the elongation direction of the crystals and O–H stretching would not be expected to have any component in this direction. As the observed Raman scattering in metaheimite is generally weaker, similar signals in its  $\bar z\!\left( {xx} \right)\!z$ spectrum are not so obvious.
Metaheimite represents a new structure type. Chemically similar minerals are heimite, PbCu2(AsO4)(OH)3·2H2O, bayldonite, PbCu3(AsO4)2(OH)2, duftite, PbCu(AsO4)(OH), plumboagardite, (Pb,REE,Ca)Cu6(AsO4)3(OH)6·3H2O and thometzekite, PbCu2(AsO4)2·2H2O. With the exception of heimite, the crystal structures of all these minerals differ significantly from the metaheimite structure.
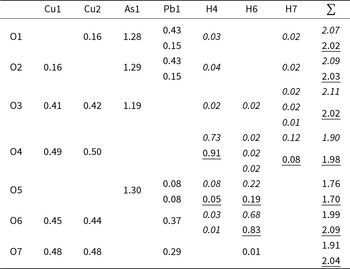
Bond valence sums (BVS) at the cation positions (Table 9) agree well with their formal charges. As in heimite, O5, the ‘free’ corner atom of the AsO4 tetrahedron, is underbonded, despite its slightly shorter distance to Pb in metaheimite (3.14 Å; Table 7) compared to heimite (3.27 Å).
Bond valences of metaheimite. Bond valence parameters are taken from Gagné and Hawthorne (Reference Gagné and Hawthorne2015) and from Malcherek and Schlüter (Reference Malcherek and Schlüter2007) (for H–O only). Values in italics represent the soft bond valences and related BVS based on the parameters of Malcherek and Schlüter (Reference Malcherek and Schlüter2007) with a 3.5 Å distance cut-off. Alternative, underlined values have been calculated using the H–O parameters of Gagné and Hawthorne (Reference Gagné and Hawthorne2015), based on only the two shortest O–H distances per hydrogen atom

Table 9 Long description
The table lists bond valence contributions from Cu1, Cu2, As1, Pb1, and three hydrogen sites (H4, H6, H7) to each oxygen atom O1 through O7, plus a row total for each oxygen. Oxygen totals cluster close to 2, spanning roughly 1.76 at O5 up to about 2.11 at O3, indicating generally well balanced oxygen valences. Arsenic dominates O1, O2, and O5 with values around 1.28 to 1.30, while lead contributes moderately where present, reaching about 0.43 at O1 and O2 and about 0.37 at O6. Copper contributions are strongest at O4, O6, and O7, with Cu1 and Cu2 each near one half at O4 and O7 and near 0.45 at O6, and smaller at O3. Hydrogen bonding is concentrated at O4 and O6, with H4 near 0.73 at O4 and H6 near 0.68 at O6; other hydrogen contributions are small, typically a few hundredths. Some cells include alternative or softened hydrogen related values based on different parameter choices and distance cutoffs, so hydrogen contributions and the affected oxygen totals may vary slightly depending on the method used.
The shorter Pb-O5 distances in metaheimite indicate that the Pb atom can be considered as 6+2 coordinated, rather than 6-coordinated as in heimite. This interpretation is supported by the two bond valence contributions of 0.08 valence units (vu) (Table 9) being just at the threshold of contributing nearest neighbour bonds, i.e. 4% of the formal valence of the central cation (Brown, Reference Brown2002). Together with the smaller lattice parameter c and the absence of water molecules, metaheimite can thus be considered a transitional phase between heimite and the condensation of the layers that would lead to the formation of the duftite structure, with its 8-coordinated Pb-atoms and a higher Pb/Cu ratio (Malcherek et al., Reference Malcherek, Mihailova, Schlüter, Roth and Meisser2024).
For the O–H bond distances and their related bond strengths, it has to be kept in mind in the following that they are heavily influenced by the applied constraints or restraints and may only represent a poor approximation of the true O–H distances. Bond valences associated with O–H bond pairs have been calculated based on two sets of parameters. The parameters obtained by Malcherek and Schlüter (Reference Malcherek and Schlüter2007), R 0 = 0.781 Å and B = 0.56 Å, involve all H–O distances up to a cut-off distance of 3.5 Å, going beyond the nearest neighbour coordination (cf. Adams, Reference Adams2001). This approach appears to be particularly adequate for the calculation of H–O bond valences, considering the small coordination number (CN) and generally asymmetric coordination of the hydrogen atom. It should be noted that in analogy to the Pb-coordination described above, only bond valences larger than 0.04 vu indicate nearest neighbour bonds. Hence the consideration of longer distances and smaller bond valences does not increase the CN of the hydrogen atoms beyond two for metaheimite.
The second model (underlined numbers) involves the parameters determined by Gagné and Hawthorne (Reference Gagné and Hawthorne2015), R 0 = 0.918 Å and B = 0.427 Å. Here only the nearest neighbour bonds (Table 5) are considered for the calculation of the BVS.
By the results shown in Table 9 it can be concluded that the cationic BVS deviate very little between the two models. Stronger deviations occur for the anionic BVS. The BVS of O4 and O7 improve when using the newer parameters of Gagné and Hawthorne (Reference Gagné and Hawthorne2015). Also, the calculated overbonding is smaller for atoms O1, O2 and O3. On the other hand, this approach yields an even larger underbonding of O5 and an overbonded O6 compared to the values obtained with the parameters of Malcherek and Schlüter (Reference Malcherek and Schlüter2007).
The structural similarity of the layers forming the heimite and the metaheimite structure would allow for stacking of H2O-bearing and H2O-free layers. Interjection of few heimite-layers or layer packets into the metaheimite structure would give rise to stacking faults and would cause residual H2O content of the metaheimite crystal bulk.
The colour variations across the two minerals may be related to their water content and the resulting changes in Cu coordination. For heimite, green, but also faint blue colours have been observed (Malcherek et al., Reference Malcherek, Mihailova, Schlüter, Roth and Meisser2024). The blue colour of heimite has also been obtained for some samples exposed to the conditions in the SEM (Roth, Reference Roth2022). So far only blue coloured metaheimite has been observed, which would suggest that blue colour in these minerals can serve as an indicator of at least partially vacant H2O sites and the related presence of [4+1]-coordinated Cu-atoms.
Supplementary material
The supplementary material for this article can be found at https://doi.org/10.1180/mgm.2025.10157.
Acknowledgements
Sample preparation and microprobe analysis were kindly carried out by Peter Stutz and Stefanie Heidrich, respectively. The characterization and preservation of the mineral paragenesis of metaheimite have benefited from funding by the Swiss Academy of Sciences (SCNAT) through SwissCollNet project no. SCN201-VD to Nicolas Meisser. Comments by Peter Leverett, Herta Effenberger and an anonymous reviewer helped to improve the manuscript.
Competing interests
The authors declare none.








 Open access

