
Introduction
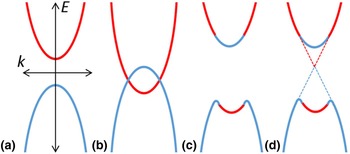
Topological insulators (TIs) such as Bi2Se3, Bi2Te3, Sb2Te3, and their alloys, have been known as good thermoelectrics for decades. However, it was only within the past 10 years that these materials were discovered to be three-dimensional (3D) TIs.[Reference Chen, Analytis, Chu, Liu, Mo, Qi, Zhang, Lu, Dai, Fang, Zhang, Fisher, Hussain and Shen1, Reference Xia, Qian, Hsieh, Wray, Pal, Lin, Bansil, Grauer, Hor, Cava and Hasan2] The unique behaviors of these materials stem from the inverted band structure at the Γ point.[Reference Bansil, Lin and Das3] As an example, take a material whose valence band comprises states with p-type symmetry and whose conduction band comprises states with s-type symmetry, as shown schematically in Fig. 1(a). If the material has a substantial spin-orbit coupling, a band inversion can occur at high-symmetry points in the Brillouin zone as shown in Fig. 1(b). This leads to a band structure renormalization, as shown in Fig. 1(c). At the Γ point, the conduction band will now have p-type symmetry while the valence band will have s-type symmetry. At an interface between this inverted material and a topologically trivial material, topological surface states (TSS) will form in a Dirac cone, shown as dashed lines in Fig. 1(d). These surface states exhibit spin-momentum locking, meaning that the momentum of the electron determines the spin. This leads to topological protection of the electrons occupying the TSS since the electrons cannot backscatter into other TSS without also undergoing a spin flip. The linear dispersion of these TSS results in small electron masses and large Fermi velocities, similar to electrons found in graphene. Due to their unique band structure, TIs are proposed for applications in spintronics and other next-generation electronic devices.[Reference Pesin and MacDonald4] In this paper, we will discuss the prospect to use TIs as novel plasmonic materials for optoelectronic applications in the far-infrared and THz. The rest of the paper is organized as follows: we first describe how to synthesize TI thin films, followed by a discussion on the theory behind TI plasmons. We then describe a variety of experimental investigations of TI plasmons, ending with a discussion of future directions. 2D topological insulators and other varieties of topological materials such as Weyl semimetals are beyond the scope of this review and will not be discussed.
Schematic of the formation of TSS (a) normal band structure, (b) band inversion due to strong spin-orbit coupling, (c) band renormalization, and (d) formation of the TSS.

TI fabrication
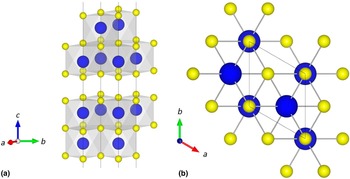
Bi2Se3, Bi2Te3, and Sb2Te3 and their alloys share a tetradymite structure with space group  $D_{3{\rm d}}^5 (R\bar 3m)$, as shown in Fig. 2. The crystal is made up of unit cells comprising five alternating layers of Se/Te and Bi/Sb. These quintuple layers (QLs) are only weakly bonded to each other through van der Waals forces along the c-axis. Taking advantage of the van der Waals bonding allows TI thin films to be either exfoliated from bulk crystals or directly grown on a variety of substrates even with a large film/substrate lattice mismatch. Historically, TI materials suffered from material quality problems regardless of the fabrication method. These include aging when exposed to the atmosphere as well as substantial background doping. Bulk crystals and thin films of Bi2Se3 usually show substantial n-type doping, while Bi2Te3 is either strongly n-type or p-type, depending on fabrication method. These doping levels have been attributed to various structural defects within the bulk of the sample, including chalcogen vacancies and antisite defects.[Reference Tumelero, Faccio and Pasa5] The significant density of trivial carriers occupying bulk states makes it difficult to observe properties associated with the smaller density of electrons occupying the TSS. Ternary or quaternary alloys of Bi2Se3, Bi2Te3, and Sb2Te3 have shown improved electrical properties including Fermi levels within the bulk band gap, but growth tends to be more complex than for the binary compounds. A great deal of research has been done to improve the quality of film growth for plasmonic applications, where the most desirable films are generally those with Fermi energies in the band gap leading to low carrier densities and high mobilities. It is worth noting that a plethora of other materials has been investigated for TI properties with varying degrees of success; see Ando 2013 for an in-depth discussion on the search for TI materials.[Reference Ando6] While Bix-Sbx−1 was the first experimentally demonstrated TI, the V2–VI3 family of TIs quickly became the favored materials for TI research. In this section, we will describe various methods used to fabricate TI thin films, including exfoliation from bulk crystals, vapor deposition, and recent progress in the growth of bulk insulating TI films by molecular beam epitaxy (MBE).
Crystal structure of tetradymite Bi2Se3 (other TI materials are similar). Bi atoms are large and shown in blue while Se atoms are smaller and shown in yellow. (a) Crystal structure along the a–b plane showing two quintuple layers with the van der Waals gap between them. (b) Crystal structure along the c-axis. Reproduced with permission from Ref. Reference Ginley, Wang and Law19. Crystals, 2016. (CC by 4.0 – https://creativecommons.org/licenses/by/4.0/legalcode).

Exfoliation
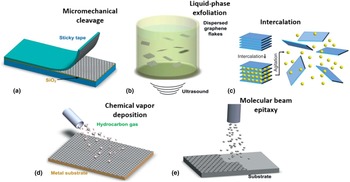
Mechanical or chemical exfoliation are universal top-down approaches used to obtain thin layers of 2D materials from their bulk form. Intensive studies have been carried out on the exfoliation of graphene,[Reference Novoselov, Geim, Morozov, Jiang, Zhang, Dubonos, Grigorieva and Firsov7] h-BN, transition metal dichalcogenides,[Reference Novoselov, Jiang, Schedin, Booth, Khotkevich, Morozov and Geim8] and other advanced 2D van der Waals materials. These commonly-used exfoliation methods rely on breaking apart the weak van der Waals bonds between single layers of these materials. The van der Waals bonding in TI materials makes exfoliation a viable method to obtain thin layers of TIs as well. To create samples with relatively large surface areas the “Scotch tape method”, also known as micromechanical cleavage or exfoliation, is usually preferred. In this method, a flexible adhesive material such as thermal release tape is used to peel layers off a bulk crystal or a substrate, as seen in Fig. 3(a). These layers are then transferred to the substrate of interest. Teweldebrhan et al.[Reference Teweldebrhan, Goyal and Balandin9] reported using mechanical exfoliation to acquire atomically-thin quasi-2D crystalline films of Bi2Te3 and observed the enhanced thermoelectric effect. The same method was applied to obtain a few layers of Bi2Se3 and Sb2Te3 to study their electronic properties[Reference Hossain, Rumyantsev, Shahil, Teweldebrhan, Shur and Balandin10, Reference Teweldebrhan, Goyal, Rahman and Balandin11] and Raman scattering.[Reference Shahil, Hossain, Goyal and Balandin12] In addition to micromechanical exfoliation, liquid phase exfoliation has also generated few-layer Bi2Se3 sheets by using sonication to break apart the van der Waal bonds while in a liquid medium,[Reference Sun, Lin, Peng, Weng, Huang and Luo13] as seen in Fig. 3(b). Finally, intercalated ions can be inserted in the van der Waals gaps. Upon agitation, the sample easily breaks apart leading to nanosheets,[Reference Ren, Qi, Liu, Hao, Huang, Zou, Yang, Li and Zhong14] as seen in Fig. 3(c). These exfoliated TIs layers often provide pristine material for characterization of transport properties. However, exfoliation methods are plagued by low yield, poor controllability, and irregular shapes. While this method is useful for fundamental research studies, it is not scalable for long-term device production.
Schematic illustration of common van der Waal materials production techniques. (a) Micromechanical cleavage, (b) liquid phase exfoliation, (c) intercalation, (d) chemical vapor deposition, and (e) molecular beam epitaxy. Adapted with permission from Ref. Reference Bonaccorso, Lombardo, Hasan, Sun, Colombo and Ferrari97. Mater. Today, 2012, (a, b, d, and e) and Ref. Reference Nicolosi, Chhowalla, Kanatzidis, Strano and Coleman98. Science, 2013, (c).

Colloidal synthesis
Colloidal synthesis methods have been used to produce nanoparticles with control over particle morphology. The researchers demonstrated that changing the synthesis temperature allowed for control of both particle size and crystallinity. A temperature of 20 °C produced polycrystalline particles 4 nm thick and 200 nm wide while 170 °C produced single crystal particles 16 nm thick and 60 nm wide.[Reference Sokolikova, Sherrell, Palczynski, Bemmer and Mattevi15] While the low-temperature particles may not be thick enough for TI applications, the higher temperature particles are certainly within useful TI dimensions.
Chemical vapor deposition
Chemical vapor deposition (CVD) and metal organic CVD(MOCVD) bottom-up fabrication methods have been used to grow bismuth chalcogenide samples.[Reference Kong, Dang, Cha, Li, Meister, Peng, Liu and Cui16, Reference Cao, Venkatasubramanian, Liu, Pierce, Yang, Zahid Hasan, Wu and Chen17] In this material system, however, they are best suited to generating nanoplates or flakes rather than large area TI films. Small area samples are difficult to use for studying the properties of Dirac plasmons since their interaction with light tends to be weak. Since the focus of this paper is on Dirac plasmons in TSS, we will turn our focus to large-area production methods.
Molecular beam epitaxy
For increased control and scalability, researchers turn to MBE to synthesize high-purity wafer-scale TI thin films. Control over the growth rate, alloy composition, and external doping level, as well as the capability to grow sharp interfaces and create heterostructures make MBE ideal for exploring the full range of TI materials. Due to the van der Waals bonds between layers, the growth parameters tend to be similar for different substrates, allowing researchers to tailor substrate choice to their desired characterization technique or application. Lattice constants of common substrates and TIs are presented in Fig. 4. Among all these substrate choices, sapphire (Al2O3) is commonly used due to its low cost, high surface quality, and chemical inertness. In addition to concerns about cost and characterization or device compatibility, some substrates may pose extra challenges for growth. For example, InP and GaAs are good substrate choices for the eventual goal of integrating TIs with III–V optoelectronic structures. However, both substrates form a native oxide that must be removed before growth. This is frequently done in a thermal desorption process with a compensating flux of the group V element supplied. Since most TI MBEs do not have group V sources, a chalcogenide overpressure must be used instead, which can change the interface character and complicate the growth of TI materials.[Reference Guo, Xu, Liu, Zhao, Dai, He, Wang, Liu, Ho and Xie18] For other choices of substrates, like silicon, passivation of surface dangling bonds is required[Reference Ginley, Wang and Law19] leading to complex surface mechanics.
Lattice constants of prototypical topological insulators and common substrates for MBE growth [Reference Ginley, Wang and Law19]. Reproduced with permission from Ref. Reference Ginley, Wang and Law19. Crystals, 2016. (CC by 4.0 – https://creativecommons.org/licenses/by/4.0/legalcode).

Even after optimizing substrate choice and preparation, it has been discovered that the majority of defects in MBE-grown TI films occur at the film/substrate interface, rather than within the bulk of the material. Despite the weak interactions of van der Waals epitaxy, it is evident that interactions with the substrate can result in a disordered crystal structure for the first few layers of the TI film. Even though the majority of the TI film is of good crystal quality, these first few disordered layers cause substantial trivial carrier doping throughout the rest of the film. By using trivially-insulating lattice-matched buffer layers, such as (InxBi1−x)2Se3, the density of trivial electrons can be drastically reduced. Films grown using buffer layers show low electron densities as well as high mobilities both at low and room temperatures.[Reference Koirala, Brahlek, Salehi, Wu, Dai, Waugh, Nummy, Han, Moon, Zhu, Dessau, Wu, Armitage and Oh20, Reference Wang, Ginley and Law21] Additional bulk doping in Bi2Se3 caused by the previously mentioned selenium vacancies or antisite defects must be addressed via the choice of growth parameters. Selenium tends to evaporate as a series of large molecules (Se6, Se7, Se8…) which must break apart at the growth surface to incorporate into the film, a predictably inefficient process. An overpressure of selenium (Bi : Se = 1 : 15–20) is required to reduce selenium vacancy defects. However, the typical selenium Knudsen cell can be replaced with a cracking source which thermally breaks apart the selenium into smaller molecules for better incorporation. Films grown with a selenium cracking source at a Se : Bi ratio of 4 : 1 were demonstrated to have excellent electrical properties that were stable in the air over a period of 60 days.[Reference Ginley and Law22] While there is always room to improve growth methods, the quality of TI thin films has improved dramatically in recent years thanks to these new growth techniques. Further improvements are expected as growth is refined. These new high-quality films open the door to experiments that were previously impossible to perform with the high density of trivial carriers. In addition, we can now begin to explore real plasmonic, spintronic, and other optoelectronic device applications with these low carrier density films.
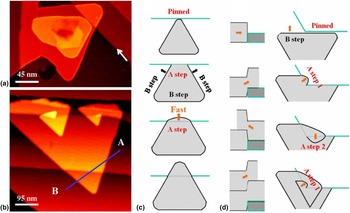
In addition to the electrical properties of TI films, we must also consider their structural properties. Most TI films show multiple twin domains as well as spiral growth. Twinning is caused by the triangular structure of the TI unit cell. For TI films, there are therefore two equivalent rotations, one with the triangle pointing “up” and the other “down”. These twin domains will always appear unless particular care is taken to suppress them through substrate patterning or by using intentionally off-cut substrates. Spiral growth has been observed for TI films grown on a variety of substrates including Al2O3,[Reference Ginley and Law22] Si(111)[Reference Li, Wang, Kan, Guo, He, Wang, Wang, Wong, Wang and Xie23] and graphene/SiC[Reference Liu, Weinert and Li24] (see Fig. 5 for an example). In traditional heteroepitaxial growth, spiral structures are dislocations that thread the film due to a lattice mismatch between the film and substrate. In TI films, however, the spiral structures remain evident even after the use of a buffer layer to reduce surface dislocations.[Reference Wang, Ginley and Law21] Their formation can alternatively be explained by a non-dislocation-mediated spiral growth mechanism. In this case, the spirals form as a result of pinning of the growth front when it encounters domain boundaries formed by the coalescence of 2D islands or jagged step edges of the substrate, as shown in Fig. 5(d). This has been confirmed by the first principle calculation using the full potential linearized augmented plane wave (FLAPW) method and generalized gradient approximation.[Reference Liu, Weinert and Li24] By studying the growth mechanism, it was also confirmed that these spiral steps will scatter the surface states and lead to standing waves. Ultra-smooth substrates, in combination with a buffer layer, may therefore lead to the highest structural and transport quality films.
(a) STM image of a Bi2Se3 island 2 QLs high with the arrow marking a SiC step (I t = 0.10 nA, V s = −0.48 V). (b) STM image of two spirals originating at a SiC step edge (I t = 0.28 nA, V s = −0.27 V), with line profile AB crossing a 1 QL Bi2Se3 island overlaid on top of a double bilayer SiC step. (c) Schematic diagrams showing a Bi2Se3 island leaping over a straight upper SiC step. (d) Schematic diagrams (side and top views) illustrating the formation of a clockwise spiral. Adapted with permission from Ref. Reference Liu, Weinert and Li24. Phys. Rev. Lett., 2012. (https://doi.org/10.1103/PhysRevLett.108.115501).

Finally, one of the major advantages of the growth of traditional semiconductors by MBE is the ability to controllably dope the materials. Doping is required to create optoelectronic devices like lasers and light emitting diodes. In order to use TIs for plasmonic or other optoelectronic device applications, we need to be able to controllably dope the materials. This research is still relatively sparse, but some success has been achieved. In particular, a recent result shows that calcium can function as a p-type dopant in Bi2Se3 to tune the Fermi level to the Dirac point.[Reference Hor, Checkelsky, Qu, Ong and Cava25] Manganese doping can also be used to sweep the Fermi level across the Dirac point, transitioning from p-type to n-type for doping levels about 5%.[Reference Choi, Jo, Lee, Lee, Jo, Kajino, Takabatake, Ko, Park and Jung26] One advantage of calcium doping over manganese is that the magnetic behavior of manganese atoms can change the behavior of the TI, adding functionality while also increasing complexity. Doping can also unlock additional exotic behaviors in these materials. Bi2Se3 doped with copper or strontium has demonstrated superconductivity below 3.8 K[Reference Hor, Williams, Checkelsky, Roushan, Seo, Xu, Zandbergen, Yazdani, Ong and Cava27] or 2.5 K,[Reference Liu, Yao, Shao, Zuo, Pi, Tan, Zhang and Zhang28] respectively, and palladium-doped Bi2Te3 was found to have superconductivity at about 5.5 K.[Reference Hor, Checkelsky, Qu, Ong and Cava25] In addition, the quantum anomalous Hall effect has been observed in chromium[Reference Chang, Zhang, Feng, Shen, Zhang, Guo, Li, Ou, Wei, Wang, Ji, Feng, Ji, Chen, Jia, Dai, Fang, Zhang, He, Wang, Lu, Ma and Xue29] and vanadium doped[Reference Chang, Zhao, Kim, Zhang, Assaf, Heiman, Zhang, Liu, Chan and Moodera30] (Bi,Sb)2Te3 at an extremely low temperature of 0.1 K.
As previously mentioned, MBE can produce sharp interfaces, thus it is well suited to growing TI heterostructures and superlattices. The most promising material for superlattice formation is In2Se3, a common band insulator material with a large optical bandgap of ~1.3 eV, whose lattice constant and crystal structure are similar to that of Bi2Se3. It was proven that by tuning the thickness of TIs or insulator interlayer, the transport properties can be modified for the designed application.[Reference Zhao, Liu, Guo, Jiang, Sun, Wang, Wang, Li, Xie, Xie and Wang31, Reference Wang, Guo, Li, Wong, Wang and Xie32] Other semiconductor materials and newer 2D materials have also been combined with TIs to engineer the band structures.[Reference Chang, Tang, Feng, Li, Ma, Duan, He and Xue33, Reference Chen, Garcia, Hernandez-Mainet, Zhao, Deng, Krusin-Elbaum and Tamargo34]
A core principle of material science is that to do good research, you must first create high-quality materials. Researchers are fortunate that the TI materials discussed above lend themselves well to a variety of growth and fabrications techniques, each with its own benefits. Over the past 10 years, the quality of TI thin films has improved dramatically, especially in MBE grown films. Researchers are now able to tailor growth methods, substrate choices, doping, and heterostructure formation to produce high-quality materials with their desired optical, electronic, magnetic, and physical parameters. This extensive control over sample fabrication will play a key role in unlocking the unique plasmonic behaviors in TSS.
2D plasmonics theory
One of the things that set TI materials apart from traditional materials is the existence of the 2D topologically-protected surface states. Although there are many applications for the TSS, we will focus here on plasmonic devices. When light is shined on the TSS, 2D plasmons can be created. 2D plasmons have a very different dispersion relationship than 3D plasmons. In Eq. (1), we show the dispersion relationship for 2D massive plasmons, such as those found in semiconductor 2D electron gasses (2DEGs) or in ultra-thin metal films. Here, ω 0 is the plasmon frequency, e is the charge on the electron, ε0 the permittivity of free space, εr the average permittivity of the materials surrounding the metal, n M the 2D density of massive carriers, m* the carrier effective mass, and q the plasmon wavevector. The frequency goes as  $\sqrt {n_{\rm M}} $, which is only observed for massive plasmons and as
 $\sqrt q $, a feature common to all 2D plasmons and distinct from their 3D counterparts. Equation (2) shows the plasmon dispersion relationship for 2D massless (Dirac) plasmons, such as those found in graphene.[Reference Stauber and Gómez-Santos35] Here, v F is the Fermi velocity of the carriers, n D the density of Dirac carriers, and h Planck's constant. We can see that for Dirac carriers, the frequency goes as
 $n_{\rm D}^{1/4} $. This equation would also be valid for plasmons excited from a single TSS. For TI thin films, however, the film is generally much thinner than the wavelength of light. In this case, plasmons can be excited on the top and bottom surfaces simultaneously. These plasmons can couple to each other, leading to an acoustic plasmon mode and an optical plasmon mode, similar to what happens for two coupled harmonic oscillators.[Reference Stauber, Gómez-Santos and Brey36]
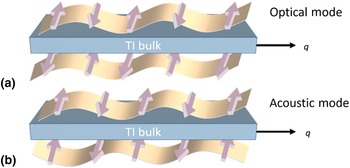
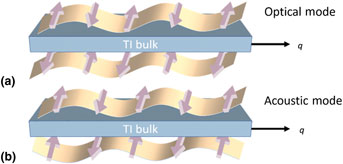
For the optical mode, the electron density waves are in phase, while for the acoustic mode, they are out of phase. This leads to a large electric field outside of the TI for the optical mode, while the acoustic mode has a large electric field within the TI film. Unlike traditional materials, in TIs these modes have an additional unique property due to the spin-momentum locking of the electrons in the TSS. The Dirac cone on the bottom surface is inverted compared with the one on the top surface since the Fermi velocity has the opposite sign for the same momentum. Because the acoustic plasmon mode has the electron density waves out of phase, it has spin waves in phase. The optical mode, therefore, has spin waves out-of-phase.[Reference Stauber, Gómez-Santos and Brey36, Reference Poyli, Hrtoň, Nechaev, Nikitin, Echenique, Silkin, Aizpurua and Esteban37] Schematics of these modes are shown in Fig. 6. Fundamentally, the optical mode is a pure charge-like mode, while the acoustic mode is purely spin-like. The dispersion relationship for the optical mode is given in Eq. (3), while the acoustic mode is shown in Eq. (4).[Reference Stauber, Gómez-Santos and Brey38–Reference Deshko, Krusin-Elbaum, Menon, Khanikaev and Trevino40] In traditional optical experiments (including Fourier transform infrared spectroscopy and pump-probe measurements described in the section TI stripe arrays), only the optical mode can be excited, since the acoustic mode has no optical dipole matrix element. The acoustic mode can be probed by electron energy loss spectroscopy, as described further in the section Electron energy loss spectroscopy measurements.
 $$\omega _{{\rm massive}}^2 = \displaystyle{{e^2} \over {4\varepsilon _0\varepsilon _{\rm r}}}\displaystyle{{n_{\rm M}} \over {m^*}}q$$
 $$\omega _{{\rm Dirac}}^2 = \displaystyle{{e^2} \over {4\varepsilon _0\varepsilon _{\rm r}}}\displaystyle{{v_{\rm F}\sqrt {2\pi n_{\rm D}}} \over h}q$$
 $$\; \omega _ + ^2 = \displaystyle{{e^2} \over {\varepsilon _0}}\displaystyle{{v_{\rm F}\sqrt {2\pi n_{\rm D}}} \over h}\displaystyle{q \over {\varepsilon _{\rm T} + \varepsilon _{\rm B} + qd\varepsilon _{{\rm TI}}}}$$
 $$\; \omega _ - ^2 = \displaystyle{{2\varepsilon _0\varepsilon _{{\rm TI}}hv_{\rm F} + e^2\sqrt {2\pi n_{\rm D}} d} \over {\sqrt {4\varepsilon _0^2 \varepsilon _{{\rm TI}}^2 h^2v_{\rm F}^2 + 2\varepsilon _0\varepsilon _{{\rm TI}}e^2\sqrt {2\pi n_{\rm D}} d}}} q^2$$
Schematics of the (a) optical and (b) acoustic modes for coupled Dirac plasmons in topological insulator thin films. The optical mode is a pure charge – like mode, while the acoustic mode is a pure spin-like mode.

In addition to the TSS, TI films can also contain massive carriers either in the bulk states or occupying a surface band bending 2DEG. These carrier populations can potentially also support plasmon modes. Both carrier populations can be described as 2D massive plasmons, with dispersion relationships given by Eq. (1). The potential bulk carrier plasmon can be considered to be 2D because the film is much thinner than the wavelength of light. Whether these electron populations need to be considered when describing plasmons in TI films is currently inconsistent across the literature. Some groups have reported that a small massive electron contribution is needed to correctly model their experimental data,[Reference Stauber, Gómez-Santos and Brey38, Reference Wu, Tse, Brahlek, Morris, Aguilar, Koirala, Oh and Armitage41–Reference Sim, Jang, Koirala, Brahlek, Moon, Sung, Park, Cha, Oh, Jo, Ahn and Choi43] while others have reported good agreement between experiment and theory without the inclusion of a massive component.[Reference Ginley and Law44, Reference Di Pietro, Ortolani, Limaj, Di Gaspare, Giliberti, Giorgianni, Brahlek, Bansal, Koirala, Oh, Calvani and Lupi45] This variation in behavior may be explained by differences in film growth and fabrication techniques which could have a substantial impact on the film band structure and therefore on the massive and Dirac carrier densities. For this reason, the possible contribution of massive carriers must be determined on a case by case basis. As long as Dirac carriers dominate the behavior of the sample in the wavelength range of interest, valuable insight into these unique plasmonic systems may be gained. As stated in the section TI stripe arrays, the ability to combine multiple carrier types in one location can provide increased control over the resulting plasmon behavior. Due to the complexities of 2D coupled Dirac plasmons and the possibility of multiple interacting plasmonic resonances, it is paramount to have a firm grasp on the theory before undertaking any experimentation. Studying the simpler yet comparable plasmonics in graphene is a useful tool for understanding Dirac behavior in TSS.
2D plasmonics experiment
Graphene
Much of the work done in TI plasmonics is related to work done previously on graphene. It is therefore pertinent to briefly discuss graphene plasmonics before delving into current TI research. Since its experimental realization in 2004, graphene has served as the foundation for much of the experimental research into 2D plasmonics. Due to their shared low dimensionality, the understanding gained from studying graphene could be applied to gain an initial understanding of other 2D systems such as transition metal dichalcogenides, BN, and the surface states of topological insulators.[Reference Grigorenko, Polini and Novoselov46] Like the TSS band structure in TIs, graphene exhibits a Dirac cone band structure. It can therefore host Dirac plasmons that comprised massless electrons with large confinement and long propagation lengths. Many methods of exciting Dirac plasmons in graphene have been experimentally demonstrated. These include nanostructured graphene (such as stripe or disk arrays),[Reference Brar, Jang, Sherrott, Lopez and Atwater47, Reference Ju, Geng, Horng, Girit, Martin, Hao, Bechtel, Liang, Zettl, Shen and Wang48] infrared nanoscopy,[Reference Fei, Gregory, Andreev, Bao, Zhang, Mcleod, Wang, Stewart, Zhao, Dominguez, Thiemens, Fogler, Tauber, Castro-Neto, Lau, Keilmann and Basov49] surface acoustic waves,[Reference Schiefele, Pedrós, Sols, Calle and Guinea50] and subwavelength dielectric gratings[Reference Zhan, Zhao, Hu, Liu and Zi51] among others. The plasmons excited in graphene have resonances that are gate- and dopant-tunable through the infrared and THz ranges. Additionally, the unusual dispersion relation of these materials leads to surface plasmons with increased sensitivity to refractive index changes. This makes them more efficient sensors than their noble metal counterparts and allows them to reach previously unobtainable wavelengths.[Reference Vicarelli, Vitiello, Coquillat, Lombardo, Ferrari, Knap, Polini, Pellegrini and Tredicucci52] The relative ease of applying a graphene layer to the surface of other materials has allowed for the creation of numerous heterostructures[Reference Brar, Jang, Sherrott, Lopez and Atwater47] and metamaterials,[Reference Iorsh, Mukhin, Shadrivov, Belov and Kivshar53] as well as the ability to use graphene to modulate the optical responsivity of substrate materials.[Reference Zeng, Baillargeat, Ho and Yong54, Reference Liu, Cheng, Liao, Zhou, Bai, Liu, Liu, Huang and Duan55] Finally, graphene allowed the first experimental observation of Dirac plasmons.[Reference Ju, Geng, Horng, Girit, Martin, Hao, Bechtel, Liang, Zettl, Shen and Wang48] For a review of theory and experimental results in graphene plasmonics see Grigorenko et al.[Reference Grigorenko, Polini and Novoselov46] and Stauber et al.[Reference Stauber39] The extensive work done on graphene plasmonics provides an excellent foundation for researchers interested in TI plasmonic systems.
TI stripe arrays
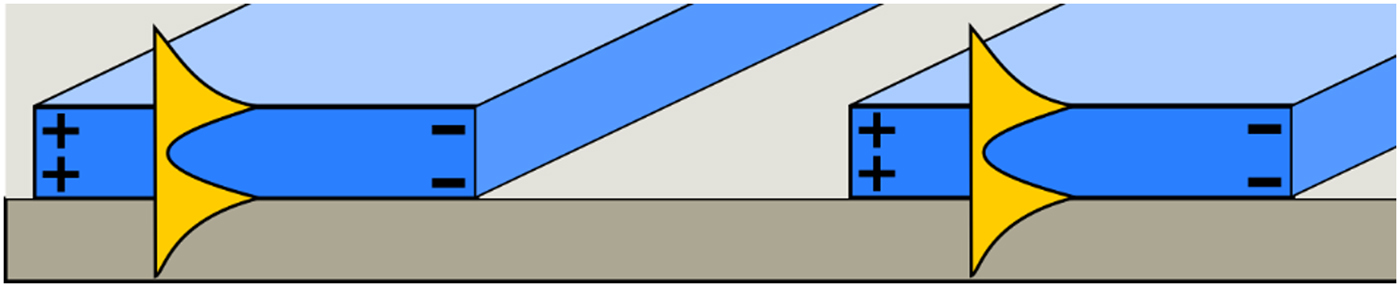
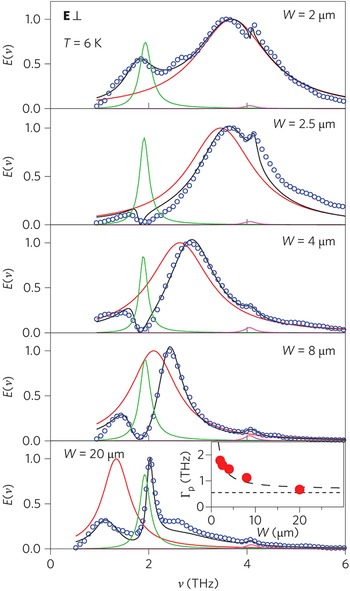
The first experimental evidence for Dirac plasmons in topological insulators was found using TI stripe arrays. These confined structures enable long-wavelength photons to gain momentum  $q = \displaystyle{\pi \over W}$, where W is the width of the stripe, allowing for a plasmon to be excited on both the top and bottom surface of the film. As discussed in the section 2D plasmonics theory and shown in Fig. 7, this results in a coupled 2D Dirac plasmon excitation. Usually, Fourier transform infrared spectroscopy is used to measure the transmission through the films with light polarized parallel to the stripes (TE) or perpendicular to the stripes (TM). Under the TE-polarized light, the plasmon will not be excited; the resulting spectra show a strong α-phonon around 2 THz and a weaker β-phonon around 4 THz. Under TM-polarized light, the plasmon (a broad excitation) will be excited and couple to the α-phonon (a discrete excitation) resulting in a characteristic Fano line shape,[Reference Giannini, Francescato, Amrania, Phillips and Maier56] as seen in Fig. 8. Should the plasmon be pushed to sufficiently high frequencies, the plasmon may instead interact with the β-phonon. However, since the β-phonon is so weak, the resulting Fano interaction will also be much weaker. The asymmetrical line shape found in Fano resonances is due to the close proximity of constructive and destructive interference between the broad and discrete excitations. The exact profile of the asymmetry is determined by the shape parameter, q, which is the excitation probability ratio between the two states. Fano interactions can generally be fit to experimental data without the use of fitting parameters, allowing for accurate extraction of the plasmon frequency and line width directly from the data. By varying the strip width and sample thickness is it possible to experimentally map out the dispersion relation of the plasmons.
Schematic of plasmon electric field (yellow) inside TI stripe (blue) [Reference Ginley and Law44]. Reproduced with permission from Ref. Reference Ginley and Law44. Adv. Opt. Mater., 2018.

Normalized extinction coefficient of the five patterned films, with the radiation polarized perpendicularly to the ribbons, at 6 K (circles) and fits (black lines). The bare plasmon and phonon contributions, extracted through the fits, are reported by the red and the green line, respectively. The inset in the bottom panel displays the plasmon linewidth ΓP versus the ribbon width W at 6 K. The dotted line is the Drude contribution extracted from data with polarization parallel to the ribbons, the dashed line is a guide to the eye. Both in the top and bottom panel the bump at 2.6 THz is instrumental and due to a bad compensation of the Mylar beamsplitter absorption. Reproduced with permission from Ref. Reference Di Pietro, Ortolani, Limaj, Di Gaspare, Giliberti, Giorgianni, Brahlek, Bansal, Koirala, Oh, Calvani and Lupi45. Nat. Nanotechnol, 2013.

Using this method several groups have successfully demonstrated that the behavior of plasmons excited in Bi2Se3 is consistent with coupled 2D Dirac plasmons.[Reference Ginley and Law44, Reference Di Pietro, Ortolani, Limaj, Di Gaspare, Giliberti, Giorgianni, Brahlek, Bansal, Koirala, Oh, Calvani and Lupi45] The plasmons shift to higher frequencies with increasing film thicknesses or smaller stripe widths. Using stripes widths from 1 to 20 μm and film thickness between 50 and 200 nm, the plasmon frequency was swept from 1.5 to 5.42 THz (Fig. 9). This Dirac behavior was clearly observed whether measurements were taken 6 K or room temperature, demonstrating the robustness of the TSS. Additionally, the linewidths reported correspond to lifetimes of up to 540 fs, larger than graphene and much larger than traditional metallic plasmons. These stripe arrays also demonstrate the large effective mode index in these materials. TI plasmons show effective indices over 200, meaning that light is compressed by more than a factor of 200 when coupling into TI stripes. This is a record high index for a single material. It is caused by a combination of the 2D nature of the plasmons, the fact that they are coupled, and the large bulk dielectric constant in Bi2Se3. It is further possible to tune the plasmon frequency by applying a large magnetic field across the samples to create a magnetoplasmon, the interaction of a plasmon and a magnetic field. In a 60 nm thick sample with a stripe width of 8 μm, the magnetoplasmon resonance was tuned from ~1.5 to ~5 THz by varying the magnetic field from 0 to 30 T.[Reference Autore, Engelkamp, D'Apuzzo, Di Gaspare, Di Pietro, Lo Vecchio, Brahlek, Koirala, Oh and Lupi57] The long lifetime, large mode index, and relative insensitivity to temperature shows the advantage of topologically-protected coupled Dirac plasmons when compared with traditional materials. All these properties, coupled with the relative ease of fabrication of these films and stripe arrays indicate their great potential for real-world plasmonic device applications in the difficult-to-reach THz spectral range. Optical and cathodoluminescence experiments have been conducted on Bi1.5Sb0.5Te1.8Se1.2, also demonstrating behavior consistent with plasmon in the TSS; these resonances were observed in the visible and ultraviolet ranges.[Reference Ou, So, Adamo, Sulaev, Wang and Zheludev58]
Experimental plasmon frequencies and theoretical dispersion curves for coupled 2D Dirac plasmons. (a) Theoretical curves for d = 200 nm (red line), d = 120 nm (purple dotted line), d = 100 nm (black line), d = 60 nm (green dotted line), and d = 50 nm (yellow line). Experimental plasmon frequencies are shown as triangles (W = 1 µm), circles (W = 2 µm), down triangles (W = 2.5 µm), squares (W = 4 µm), pentagons (W = 8 µm), or diamonds (W = 20 µm) in the corresponding thickness color. (b) Theoretical curves for W = 1 µm (red line), W = 2 µm (black line), W = 4 µm (yellow line), W = 8 µm (purple dotted line), and W = 20 µm (green dotted line). Experimental plasmon frequencies are shown as triangles (W = 1 µm), circles (W = 2 µm), down triangles (W = 2.5 µm), squares (W = 4 µm), pentagons (W = 8 µm), or diamonds (W = 20 µm) in the corresponding stripe width color. Filled symbols are from our experiment, open symbols are from [Reference Di Pietro, Ortolani, Limaj, Di Gaspare, Giliberti, Giorgianni, Brahlek, Bansal, Koirala, Oh, Calvani and Lupi45]. Reproduced with permission from Ref. Reference Ginley and Law44. Adv. Opt. Mater., 2018, (supplement).

TI plasmonic stripe arrays have also been studied using time-resolved optical pump THz-probe spectroscopy. Sim et al. used this method to investigate 100 nm thick Bi2Se3 stripe arrays 15 μm wide.[Reference Sim, Jang, Koirala, Brahlek, Moon, Sung, Park, Cha, Oh, Jo, Ahn and Choi43] When probing the films without the optical pulse injection, the extinction spectra demonstrated the plasmon–phonon Fano interaction discussed previously, dropping to near zero at 1.5 THz. However, when the films were probed after an optical control pulse, the plasmon resonance was shifted from 1.5 THz at t = 0 ps to a maximum of 2.2 THz at t = 5 ps before dropping back to 1.7 THz at t = 15 ps (Fig. 10). The largest modulation depth (2400%) was seen at 1.5 THz due to the near-zero extinction at the frequency without the pump, by far the highest modulation depth in current literature. Researchers believe that the pump pulse excites massive carriers into the band bending 2DEG co-located with the TI surface states. The 2DEG carriers then interact with the TI carriers to shift the plasmon frequency. Though the resulting plasmons are no longer purely Dirac in nature, the ability to tune the plasmon frequency on the picosecond time scale has vast potential for device application.[Reference Sim, Jang, Koirala, Brahlek, Moon, Sung, Park, Cha, Oh, Jo, Ahn and Choi43] Pump-probe methods have also been used to show control of the electron–phonon interaction in TI by engineering plasmon frequency,[Reference In, Sim, Kim, Bae, Jung, Jang, Son, Moon, Salehi, Seo, Soon, Ham, Lee, Oh, Kim, Jo and Choi59] and colossal Kerr rotations of up to 65° in magnetically doped samples.[Reference Aguilar, Stier, Liu, Bilbro, George, Bansal, Wu, Cerne, Markelz, Oh and Armitage60]
(a) Schematic illustration of time-resolved optical pump terahertz-probe spectroscopy. Polarizations of optical modulation pump (1.55 eV, 50 fs) and THz probe are 45° and perpendicular to the ribbon axis, respectively. (b) Transient extinction spectra (black circles) are displayed for several pump-probe time delays (Δt), measured at 78 K with 45 μJ/cm2 of optical excitation fluence. Red lines and grey vertical lines indicate the bare plasmon resonance and the phonon frequency, respectively, which are extracted from the plasmon–phonon interaction model (black lines). (c, d) Time-resolved dynamics of plasmon resonance frequency (c) and linewidth (d). The error bars represent 95% confidence intervals for the fitting parameters. Reproduced with permission from Ref. Reference Sim, Jang, Koirala, Brahlek, Moon, Sung, Park, Cha, Oh, Jo, Ahn and Choi43. Nat. Commun., 2015. (CC by 4.0 – https://creativecommons.org/licenses/by/4.0/legalcode).

Stripe arrays have already proved to be a simple yet effective tool for probing the plasmonic behavior in TSS, yet they still have more to offer. Films grown on a conductive substrate with an insulating (InxBi1−x)2Se3 buffer layer could be back-gated to controllably sweep the Fermi level though to Dirac cone, and the stripe arrays lend themselves relatively easily to back gating. Not only would this be of interest scientifically, it would also be a key feature of tunable TI plasmonic devices in the THz. Finally, exploration has already begun into more complex geometries such as ring resonator arrays, in which we may observe added complexity due to coupling between resonators.[Reference Autore, D'Apuzzo, Di Gaspare, Giliberti, Limaj, Roy, Brahlek, Koirala, Oh, García de Abajo and Lupi61]
Electron energy loss spectroscopy measurements
Electron energy loss spectroscopy (EELS) has been widely used to observe 2D plasmons by measuring the energy loss of the electrons caused by the inelastic scattering from plasmon excitations.[Reference Egerton62] Evidence of 2D plasmons are found with EELS in multiple materials systems; we will focus here on TI measurements. EELS measurements on the TIs Bi2Se3[Reference Liou, Chu, Sankar, Huang, Shu, Chou and Chen63] and Sb2Te3[Reference Nechaev, Aguilera, De Renzi, di Bona, Lodi Rizzini, Mio, Nicotra, Politano, Scalese, Aliev, Babanly, Friedrich, Blügel and Chulkov64] showed a linear dispersion relation for both materials, proving the existence of 2D plasmons. However, Kogar et al. claimed that their EELS measurements on Bi2Se3 were seeing a dominant surface plasmon mode arising from massive bulk carriers rather than massless topological electrons.[Reference Kogar, Vig, Thaler, Wong, Xiao, Reig-i-Plessis, Cho, Valla, Pan, Schneeloch, Zhong, Gu, Hughes, MacDougall, Chiang and Abbamonte65] Their study suggests that the existence of bulk carriers may cause difficulties in the observation of TI plasmons by EELS. One of the most exciting applications of EELS in the TI system is studying the elusive acoustic plasmon, which cannot be excited optically. High-resolution EELS by Jia et al.[Reference Jia, Zhang, Sankar, Chou, Wang, Kempa, Plummer, Zhang, Zhu and Guo66] experimentally demonstrated the presence of the acoustic plasmon in Bi2Se3. The acoustic plasmon could be distinguished from the co-located α-phonon due to its lack of lattice symmetry. By doping the films with manganese, the surface states were destroyed and the symmetric behavior of the α-phonon was observed. Interaction with the α -phonon has also facilitated experimental observation of the acoustic plasmon via Raman[Reference Glinka, Babakiray and Lederman67] and transient reflectivity[Reference Glinka, Babakiray, Johnson, Holcomb, Lederman and Merlin68] measurements.
Future directions
The experiments described above, while impressive, have only begun to explore the possibilities of Dirac plasmons in TIs. There are many future possibilities both to understand the fundamental properties of TI plasmons as well as to move toward passive or active optical devices. One clear possibility is creating tunable TI plasmonic devices. Gate-tunable TIs have been demonstrated using both back gates and top gates.[Reference Checkelsky, Hor, Cava and Ong69–Reference Xiong, Khoo, Jia, Cava and Ong71] Some samples have shown carrier densities that can be modulated from electron-like through the Dirac point and into hole-like behavior. Gate-tunable graphene plasmonic devices have already been demonstrated.[Reference Fei, Rodin, Andreev, Bao, McLeod, Wagner, Zhang, Zhao, Thiemens, Dominguez, Fogler, Castro Neto, Lau, Keilmann and Basov72–Reference Chen, Badioli, Alonso-González, Thongrattanasiri, Huth, Osmond, Spasenovi, Centeno, Pesquera, Godignon, Elorza, Camara, Javier García De Abajo, Hillenbrand and Koppens74] The ability to gate-tune the plasmon frequency in a TI device in the THz spectral range opens the door to a variety of sensing or optical modulator devices.
Due to the van der Waals bonds between QLs, TI films can be transferred to other substrates using a variety of mechanical and chemical exfoliation techniques. This transferring ability means that high-quality TI films can be grown on the optimal substrate, then transferred to optically-appropriate substrates without film degradation. This ability dramatically widens the application space for TI plasmon devices. For example, an optoelectronic structure could be grown in the well-studied III–V material system. A TI film could be grown on a separate substrate, then transferred on top of the active device layers. Fabrication of the TI into a plasmonic structure could substantially improve the efficiency of existing THz optoelectronic structures. In addition, TIs can be integrated with lattice-matched trivially-insulating materials to form active heterostructures. Both p-type and n-type TIs can be grown, opening the door to the creation of complex active TI plasmonic devices.
The applications described above build off of work done in graphene and other 2D material systems. However, there are two directions that are unique to TIs: spin plasmons and surface topological particle (SToP) plasmons.
Spin plasmons
Unlike normal plasmons, spin plasmons involve electrons with broken spin degeneracy.[Reference Ullrich and Flatte75, Reference Magarill, Chaplik and Éntin76] Before the discovery of TIs, spin plasmons have been exclusively studied theoretically. With assumptions of heavy spin splitting and alternating electric field, the occurrence of a spin plasmon mode is predicted in a 2DEG.[Reference Magarill, Chaplik and Éntin77] Spin plasmons were also taken into account in the calculations of quantum well structures.[Reference Ullrich and Flatte75, Reference Magarill, Chaplik and Éntin76, Reference Ullrich and Flatte78] Plasmons at TI surfaces are predicted to be spin polarized due to the spin momentum locking of the electrons in the TI surface states as described in the section 2D plasmonics theory.[Reference Stauber39, Reference Raghu, Chung, Qi and Zhang79–Reference Stauber, Gómez-Santos and Brey81] To date, TIs are the only single material system in which spin plasmons can be housed and could be observed at room temperature. The general theories of spin plasmon, as well as possible experimental approaches to detect spin plasmons, were given by Raghu.[Reference Raghu, Chung, Qi and Zhang79] Then works by Efimkin et al.[Reference Efimkin, Lozovik and Sokolik80, Reference Efimkin, Lozovik and Sokolik82] described the spin plasmons in graphene and TI surface with a random phase approximation. People have proposed spin plasmons in TI as spin rectifiers for spintronic devices.[Reference Appelbaum, Drew, Fuhrer, Appelbaum, Drew and Fuhrer83] A spin plasmon would enable optical control of the spin state of a propagating wave. The nature of the spin plasmon implies that it could potentially be a perfect bridge between plasmonics and spintronics, thus giving rise to more complicated applications in the future.
So far, there are only a few reports of spin-plasmon observation. A study with angle-resolved photoemission spectroscopy (ARPES) on both intrinsic Bi2Se3 and Cu-doped Bi2Se3 revealed modes around 3 meV where spin plasmons were the primary candidate.[Reference Kondo, Nakashima, Ota, Ishida, Malaeb, Okazaki, Shin, Kriener, Sasaki, Segawa and Ando84] Unfortunately, these conclusions were challenged by a study using momentum-resolved electron energy-loss spectroscopy, which suggests that the modes shown in the ARPES measurements are possibly surface plasmon modes arising from the bulk carriers.[Reference Kogar, Vig, Thaler, Wong, Xiao, Reig-i-Plessis, Cho, Valla, Pan, Schneeloch, Zhong, Gu, Hughes, MacDougall, Chiang and Abbamonte65] To date, there has been no conclusive experimental evidence of spin plasmons in TIs, though Dirac plasmons arising from the TSS have been observed.
One possible way to generate spin-polarized plasmon waves in TIs, as proposed in theoretical works,[Reference Raghu, Chung, Qi and Zhang79] is by using a transient spin grating (TSG). TSG has been widely used to probe spin dynamics in semiconductor nanostructures.[Reference Cameron, Riblet and Miller85–Reference Weng, Wu and Cui87] By interfering two non-colinear laser beams, TSGs with alternating magnetic field domains but constant electric field intensity will be created at the surface of the TI. Due to the spin-momentum locking of TI surface states, this spin grating will generate two spin-polarized plasmon waves propagating in opposite directions, enabling us to pick up signals of spin plasmons using standard plasmon outcoupling and measurement techniques. An illustration of a TSG is shown in Fig. 11.[Reference Lai, Lin, Wu and Liu88] Several theoretical works have shown the possibility of optical spin injections,[Reference McIver, Hsieh, Steinberg, Jarillo-Herrero and Gedik89–Reference Hosur91] but there are still insufficient reports of experimental practices of optical injection.
An illustration of spin grating injection on TI. The blue wave with red arrows are spin waves with spin directions imbedded. The arrows with twisting curves on the top are incident laser beams with different polarizations. Reproduced with permission from Ref. Reference Raghu, Chung, Qi and Zhang79. Phys. Rev. Lett., 2010. (https://doi.org/10.1103/PhysRevLett.104.116401).

Overall, the study of spin plasmons in TI is still quite limited by multiple coexisting plasmonic excitations as well as the difficulty of exciting and outcoupling these excitations. New ways to generate and probe spin plasmons are still under exploration. With the significant recent advances in TI film growth and concurrent reduction in bulk carrier density, future experiments attempting to excite TI spin plasmons are more likely to be successful.
SToP plasmons
One final unique feature about TI plasmons is the ability to observe substantially new behavior in quantum particles. In topological insulator nanoparticles with radii below ~100 nm, the quantization of the energy levels in the TSS becomes important[Reference Imura, Yoshimura, Takane and Fukui92–Reference Kundu, Zazunov, Yeyati, Martin and Egger94] yet the surface states remain protected.[Reference Siroki, Haynes, Lee and Giannini95] In this regime, two new behaviors emerge that are dependent on the radius of the nanoparticles. First, a single electron is capable of making the surface perfectly conducting at specific frequencies, effectively screening the body of the nanoparticle and causing the absorption cross section to drop to zero. Second, a resonance called a SToP mode is predicted to appear due to the interaction between the α-phonon and the surface state electrons. Both these behaviors are highly tunable by changing the radii of the particles, however, the nanoparticles must have enough bulk material to support the surface states. At a radius of around 5 nm the surface states will approach the energy of the bulk and the surface states will no longer be present. First predicted in 2016 by Siroki et al.[Reference Siroki, Haynes, Lee and Giannini95, Reference Siroki, Lee, Haynes and Giannini96] the behaviors of topological insulator nanoparticles have yet to be extensively experimentally examined, however they have tremendous promise for cavity quantum electrodynamics, THz lasers, low loss waveguides, and quantum information.
Conclusion
In conclusion, the unique properties of the topologically-protected surface states in topological insulator materials hold great promise for applications ranging from electronics to optics to spintronics. In recent years, synthesis of bulk crystals and thin films of TIs has improved markedly, leading to materials with lower parasitic bulk electrons and higher mobility for electrons occupying the TSS. With these improved materials, we can begin to explore the unique plasmonic properties of the TSS. The coupled 2D Dirac plasmons in TIs have already shown tunability across the THz spectral range, with long lifetimes and large mode indices. These properties make TIs excellent candidate materials for a variety of THz sensing devices. However, the most unique properties of TI plasmons remain yet unexplored, including the sought-after spin plasmon as well as unique plasmonic excitations in nanoparticles. Now that improved materials are available, it will no doubt only be a short time until these unique plasmonic behaviors are realized.
Acknowledgments
T.G., Z.W., and S.L. acknowledge funding from the U.S. Department of Energy, Office of Science, Office of Basic Energy Sciences (DE- SC0017801). Y.W. and S.L. acknowledge funding from the U.S. Department of Energy, Office of Science, Office of Basic Energy Sciences (DE- SC0016380).