Anaemia is one of the most widespread global nutritional disorders, leading to poor health outcomes and increased disease burden. It affects 24·3 % of the world’s population across all age groups, accounting for approximately 1·6 billion people, with insufficient dietary Fe intake as the most common cause(Reference Gardner, Razo and McHugh1). About 50 % of anaemia cases worldwide are attributable to Fe deficiency anaemia (IDA). However, the non-anaemic Fe deficiency (NAID) is estimated to be two to four times higher, reflecting a substantial hidden burden(Reference Vos, Lim and Abbafati2–Reference Lopez, Cacoub and Macdougall4), particularly in low- and middle-income countries(Reference Wang, Chen and Chen5,Reference Sharma, Devanathan and Sengupta6) . Although the prevalence of anaemia in children under 5 years of age decreased from 29·7 % in 2015 to 18·1 % in 2020(Reference Wang, Huo and Wei7), rural children continue to exhibit significantly higher rates than their urban counterparts, with prevalence ranging from 59 % to 75 % in some western provinces, highlighting marked socioeconomic disparities, especially in underdeveloped regions(Reference Du, Liao and Leng8).
Fe is essential for cellular function, particularly in oxygen transport and neurodevelopment(Reference Beard9). Fe deficiency (ID) disrupts these processes, leading to delayed growth, impaired immune function and compromised brain development in children(Reference Georgieff10). For instance, children with early ID score 5–10 points lower on cognitive tests by age 19, translating into reduced educational attainment and employment potential with long-term socioeconomic consequences(Reference Lukowski, Koss and Burden11). Beyond anaemia, ID in infancy manifests as slower neural processing, reduced motor skills and heightened social dysfunction(Reference Lozoff, Beard and Connor12). Even after Fe repletion, affected individuals are at increased risk of cognitive impairment, anxiety and depression persisting into adulthood(Reference East, Doom and Blanco13).
Despite the profound impact of ID, current diagnostic methods remain inadequate for early detection. Standard approaches, such as serum ferritin and transferrin saturation, require venous blood sampling, which poses logistical challenges in clinical environments where access to specialised tests like serum ferritin is constrained(Reference Zimmermann and Hurrell14). Moreover, these markers typically identify Fe deficiency only after Fe stores are significantly depleted, thereby delaying preventive interventions(Reference Camaschella15). In pediatric care, routine screening with these tests is uncommon—fewer than 20 % of USA children under 5 years are tested annually—and the discomfort associated with venous blood collection further reduces compliance among young patients and their caregivers(Reference Powers and Buchanan16,Reference Baker and Greer17) .
In contrast, complete blood count (CBC) testing provides a practical, minimally invasive alternative, as it can be performed using finger-prick sampling and relies on widely available equipment(18). Routinely reported parameters such as mean corpuscular volume (MCV), mean corpuscular hemoglobin (MCH) and red cell distribution width (RDW) may offer early signals of ID before progression to anaemia, enabling timely intervention when developmental and societal consequences may still be prevented. This study aims to develop a predictive model using routine CBC parameters to detect NAID in a large pediatric Chinese cohort with external validation, facilitating timely intervention and improved outcomes in vulnerable populations.
Methods
Study design and participants
This retrospective study analysed medical records of children aged 2 months to 6 years who underwent regular general health checks at Fujian Provincial Maternal and Child Health Hospital between July 2022 and July 2024. Given that this hospital provides a large volume of primary and preventative care for the community, the cohort is considered representative of the local pediatric population. The regular general health checks were conducted every 3 months before the age of 1 year, every 6 months between 1 and 3 years of age and annually after 3 years of age. Eligible participants had complete data for complete blood count (CBC), C-reactive protein (CRP) and Fe metabolism assessments. The study followed the Standards for Reporting of Diagnostic Accuracy Studies (STARD) guidelines.
Eligibility criteria
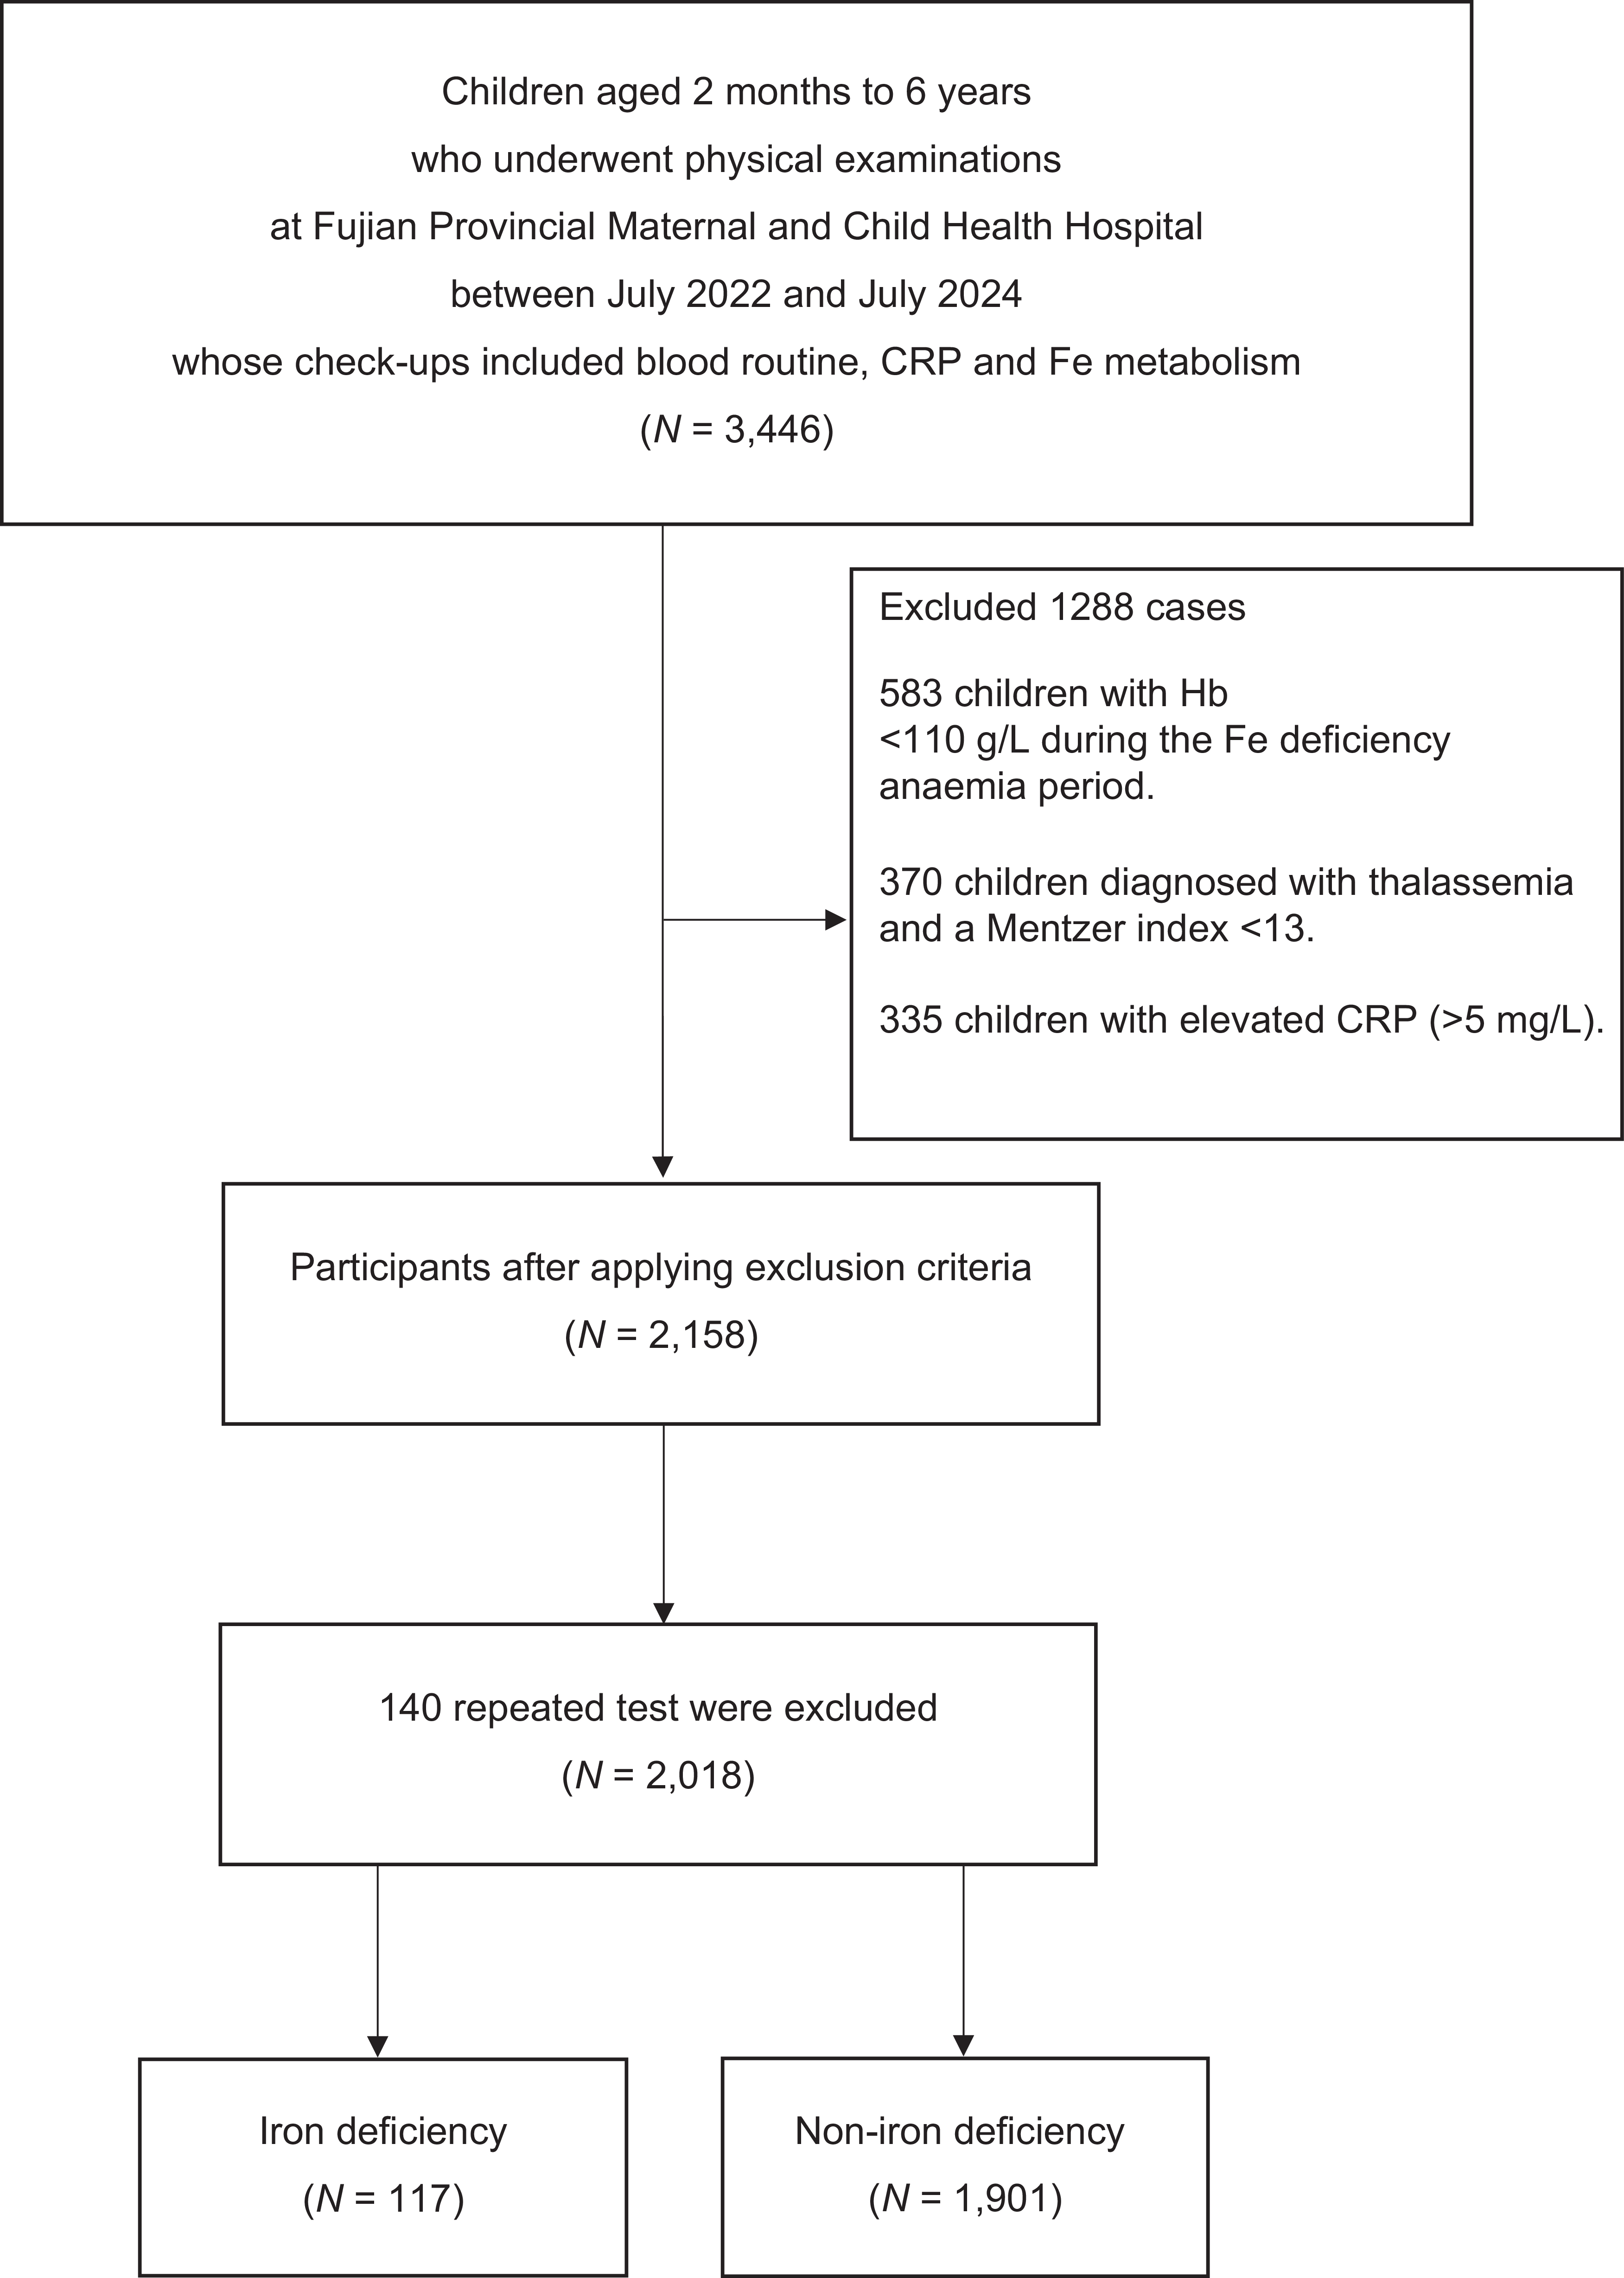
Initially, 3446 records were screened. Records were excluded for Fe deficiency anaemia (hemoglobin < 110 g/l; n 583), suspected thalassemia (Mentzer index < 13; n 370) and inflammation (CRP > 5 mg/l; n 335). After removing 140 duplicate tests from the remaining 2158 records, the final analytical cohort comprised 2018 children (Figure 1).
Case screening flowchart.

Figure 1. Long description
The flowchart illustrates the case screening process for children aged 2 months to 6 years who underwent physical examinations at Fujian Provincial Maternal and Child Health Hospital between July 2022 and July 2024. The initial pool includes 3,446 children whose check-ups included blood routine, CRP, and Fe metabolism. The process excludes 1,288 cases: 583 children with Hb less than 110 grams per liter during the Fe deficiency anaemia period, 370 children diagnosed with thalassemia and a Mentzer index less than 13, and 335 children with elevated CRP greater than 5 milligrams per liter. After applying exclusion criteria, 2,158 participants remain. An additional 140 repeated tests are excluded, resulting in 2,018 participants. These are divided into two groups: 117 cases of iron deficiency and 1,901 cases of non-iron deficiency.
Data collection and laboratory measurements
Complete blood counts were obtained using a MAIRUI automated haematology analyser BC-5390CRP from finger-prick blood samples, which applies sheath flow resistance, flow cytometry and SLS hemoglobin assays to measure Hb, mean corpuscular volume (MCV), mean corpuscular hemoglobin concentration (MCHC), red cell distribution width (RDW) and red blood cell count (RBC). C-reactive protein (CRP) was measured with a China Dewo Bio Neph-EZ EZ-400 semiautomatic specific protein meter. Fe metabolism markers were analysed on the Abbott ARCHITECT i2000SR immunoanalyser using the manufacturer’s assay kit. Anaemia was defined as Hb < 110 g/l for children aged 6 months–5 years and < 120 g/l for those aged 6–18 years, while Fe deficiency was defined as serum ferritin < 15 µg/l(Reference Qin, He and Yin19). All laboratory testing of complete blood count parameters and other indicators was performed in accordance with ISO 15189 standards
Statistical analysis
Records with repeated tests or missing values were excluded. Normality of continuous variables was assessed using the Anderson–Darling test first. Continuous variables were expressed as mean (sd) or median with quartile and were compared using the independent t test or the Mann–Whitney U test, as appropriate for the data distribution. Categorical variables were reported as frequencies and percentages and were analysed using the χ 2 test.
To identify predictors of Fe deficiency, we employed a two-stage variable selection process. First, univariable logistic regression analyses were performed to assess the association between each potential predictor (including demographic characteristics and CBC parameters) and the Fe deficiency outcome. Variables demonstrating a significant association in this initial screening, defined by a P-value < 0·05, were selected as candidate variables for the multivariable model.
In the second stage, these candidate variables were entered into a multivariable logistic regression model using a backward stepwise selection procedure. This automated process retained only the independent predictors of Fe deficiency in the final model, using a significance level of P < 0·05 for a variable to remain in the model. Odds ratios (ORs) with 95 % confidence intervals (CIs) were reported for the variables retained in the final model.
Following data preprocessing, the dataset was randomly divided into a training cohort (70 %) and a testing cohort (30 %) to develop and internally validate the predictive model, and sample size of the three cohorts was tested by GPower 3.1 with 1-β over 0·9. Model discrimination was assessed using the area under the receiver operating characteristic (ROC) curve (AUC).
To enhance external validity, the model was further validated using the National Health and Nutrition Examination Survey dataset (August 2021–August 2023, Cycle 12). Standardised laboratory parameters from the National Health and Nutrition Examination Survey database were directly mapped to the local cohort variables, verifying that the analytical methodologies were comparable (Beckman Coulter DxH-800 Analyser for CBC parameters and Standardised electrochemiluminescence immunoassay for serum ferritin) and ensuring that all units of measurement were identically aligned according to the National Health and Nutrition Examination Survey Laboratory Procedure Manual. Furthermore, the exact diagnostic criteria utilised in the local derivation cohort, including the reference standard for Fe deficiency and the exclusion threshold for concurrent inflammation (CRP < 5 mg/l), were uniformly applied to the National Health and Nutrition Examination Survey dataset. Finally, to accurately mirror the real-world clinical application of this screening tool, unweighted individual-level data were utilised, and participants with missing data for the essential model variables (CBC parameters, ferritin or CRP) were excluded to maintain a complete-case analysis consistent with the local cohort.
Furthermore, a nomogram was developed to provide a graphical representation of the final multivariable logistic regression model. The predictors included in the nomogram were those identified as independent risk factors in the final model. The nomogram was constructed using R software, allowing for the calculation of a total score and the corresponding probability of the outcome.
All statistical analyses were conducted using R (version 4.4.2 for Windows; R Foundation for Statistical Computing) and SAS (version 9.4 for Windows; SAS Institute). A two-tailed P value < 0·05 was considered statistically significant.
Results
Descriptive statistics
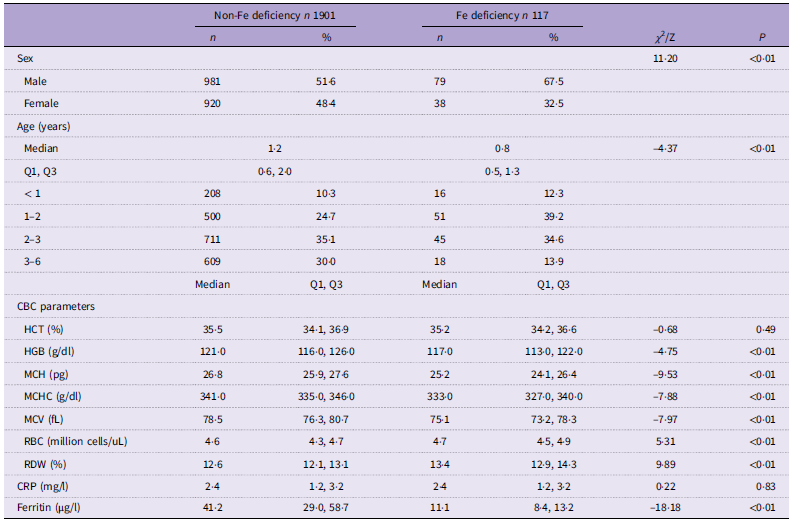
A total of 2018 children were included in the final analysis after applying eligibility criteria and excluding repeated tests. The dataset was divided into training (n 1413), testing (n 605) and external validation (n 232) cohorts. Baseline demographic and clinical characteristics are summarised in Table 1.
Characteristic statistics of patients

Table 1. Long description
The table presents a comparison of demographic and clinical characteristics between patients with non-iron deficiency and those with iron deficiency. It includes data on sex, age, and various complete blood count (CBC) parameters. The table has 12 rows and 10 columns, with columns for non-iron deficiency (n 1901) and iron deficiency (n 117) groups, along with chi-square/Z values and P values. Notable trends include higher median age in the non-iron deficiency group and significant differences in hemoglobin (HGB), mean corpuscular hemoglobin (MCH), mean corpuscular hemoglobin concentration (MCHC), mean corpuscular volume (MCV), red blood cell count (RBC), and red cell distribution width (RDW) between the two groups. Ferritin levels are also significantly lower in the iron deficiency group.
CBC, complete blood count; HCT, hematocrit; HGB, Hb; MCH, mean corpuscular Hb; MCHC, mean corpuscular Hb concentration; RDW, red cell distribution width; CRP, C-reactive protein.
In the analytical cohort, 117 children were identified with Fe deficiency. Males comprised a significantly higher proportion of the Fe deficiency group compared with the non-Fe deficiency group (67·5 % v. 51·6 %, P < 0·01). Children with Fe deficiency were also significantly younger, with a median (Q1, Q3) age of 0·8 (0·5, 1·3) years v. 1·2 (0·6, 2·0) years in those without Fe deficiency (P < 0·01).
Key CBC parameters showed significant differences between the groups; median MCH was lower in the Fe deficiency group at 25·2 (24·1, 26·4) pg compared with 26·8 (25·9, 27·6) pg in the non-Fe deficiency group (P < 0·01). Conversely, RDW was elevated among Fe-deficient children, with a median of 13·4 % (12·9, 14·3 %) v. 12·6 % (12·1, 13·1 %) (P < 0·01). As expected, median serum ferritin was markedly lower in the Fe deficiency group at 11·1 (8·4, 13·2) µg/l compared with 41·2 (29·0, 58·7) µg/l in the non-Fe deficiency group (P < 0·01).
Risk prediction based on logistic regression model
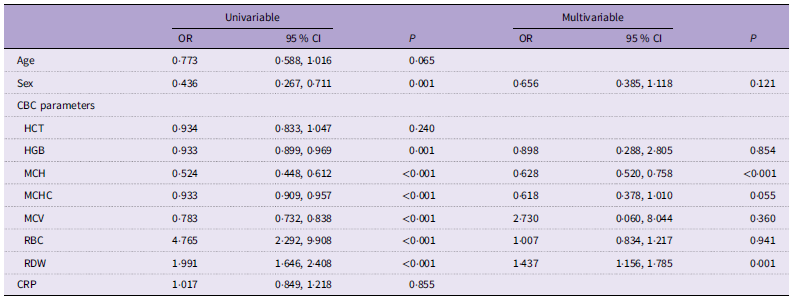
Univariable logistic regression identified sex, HGB, MCH, MCHC, MCV, RBC and RDW as significant predictors of Fe deficiency. However, when these candidates were evaluated together using stepwise multivariable logistic regression, several predictors lost their independent statistical significance (sex, P = 0·121; HGB, P = 0·854; MCHC, P = 0·055; erythrocytes P = 0·941 and MCV, P = 0·360). This elimination is primarily due to the high degree of multicollinearity among erythrocyte indices; as MCH and RDW emerged as the strongest independent predictors, they effectively captured the shared variance of the other highly correlated haematological parameters. Consequently, only MCH (OR = 0·63; 95 % CI, 0·52, 0·76; P < 0·001) and RDW (OR = 1·44; 95 % CI, 1·16, 1·79; P = 0·001) retained significant independent discriminatory ability. These two variables were subsequently incorporated into the final parsimonious predictive model, which was internally and externally validated (Table 2).
Model statistics

Table 2. Long description
The table presents a comparison of univariable and multivariable statistics for various parameters, including age, sex, and complete blood count (CBC) parameters. It consists of 13 rows and 6 columns. The columns are labeled as Univariable OR, Univariable 95% CI, Univariable P, Multivariable OR, Multivariable 95% CI, and Multivariable P. The rows are labeled with different parameters such as Age, Sex, HCT, HGB, MCH, MCHC, MCV, RBC, RDW, and CRP. Notable trends include significant P values for sex, HGB, MCH, MCHC, MCV, RBC, and RDW in the univariable analysis, and for MCH and RDW in the multivariable analysis. The boldface in the table highlights significant P values, indicating statistical relevance.
CBC, complete blood count; HCT, hematocrit; HGB, Hb; MCH, mean corpuscular Hb; MCHC, mean corpuscular Hb concentration; RDW, red cell distribution width; CRP, C-reactive protein.
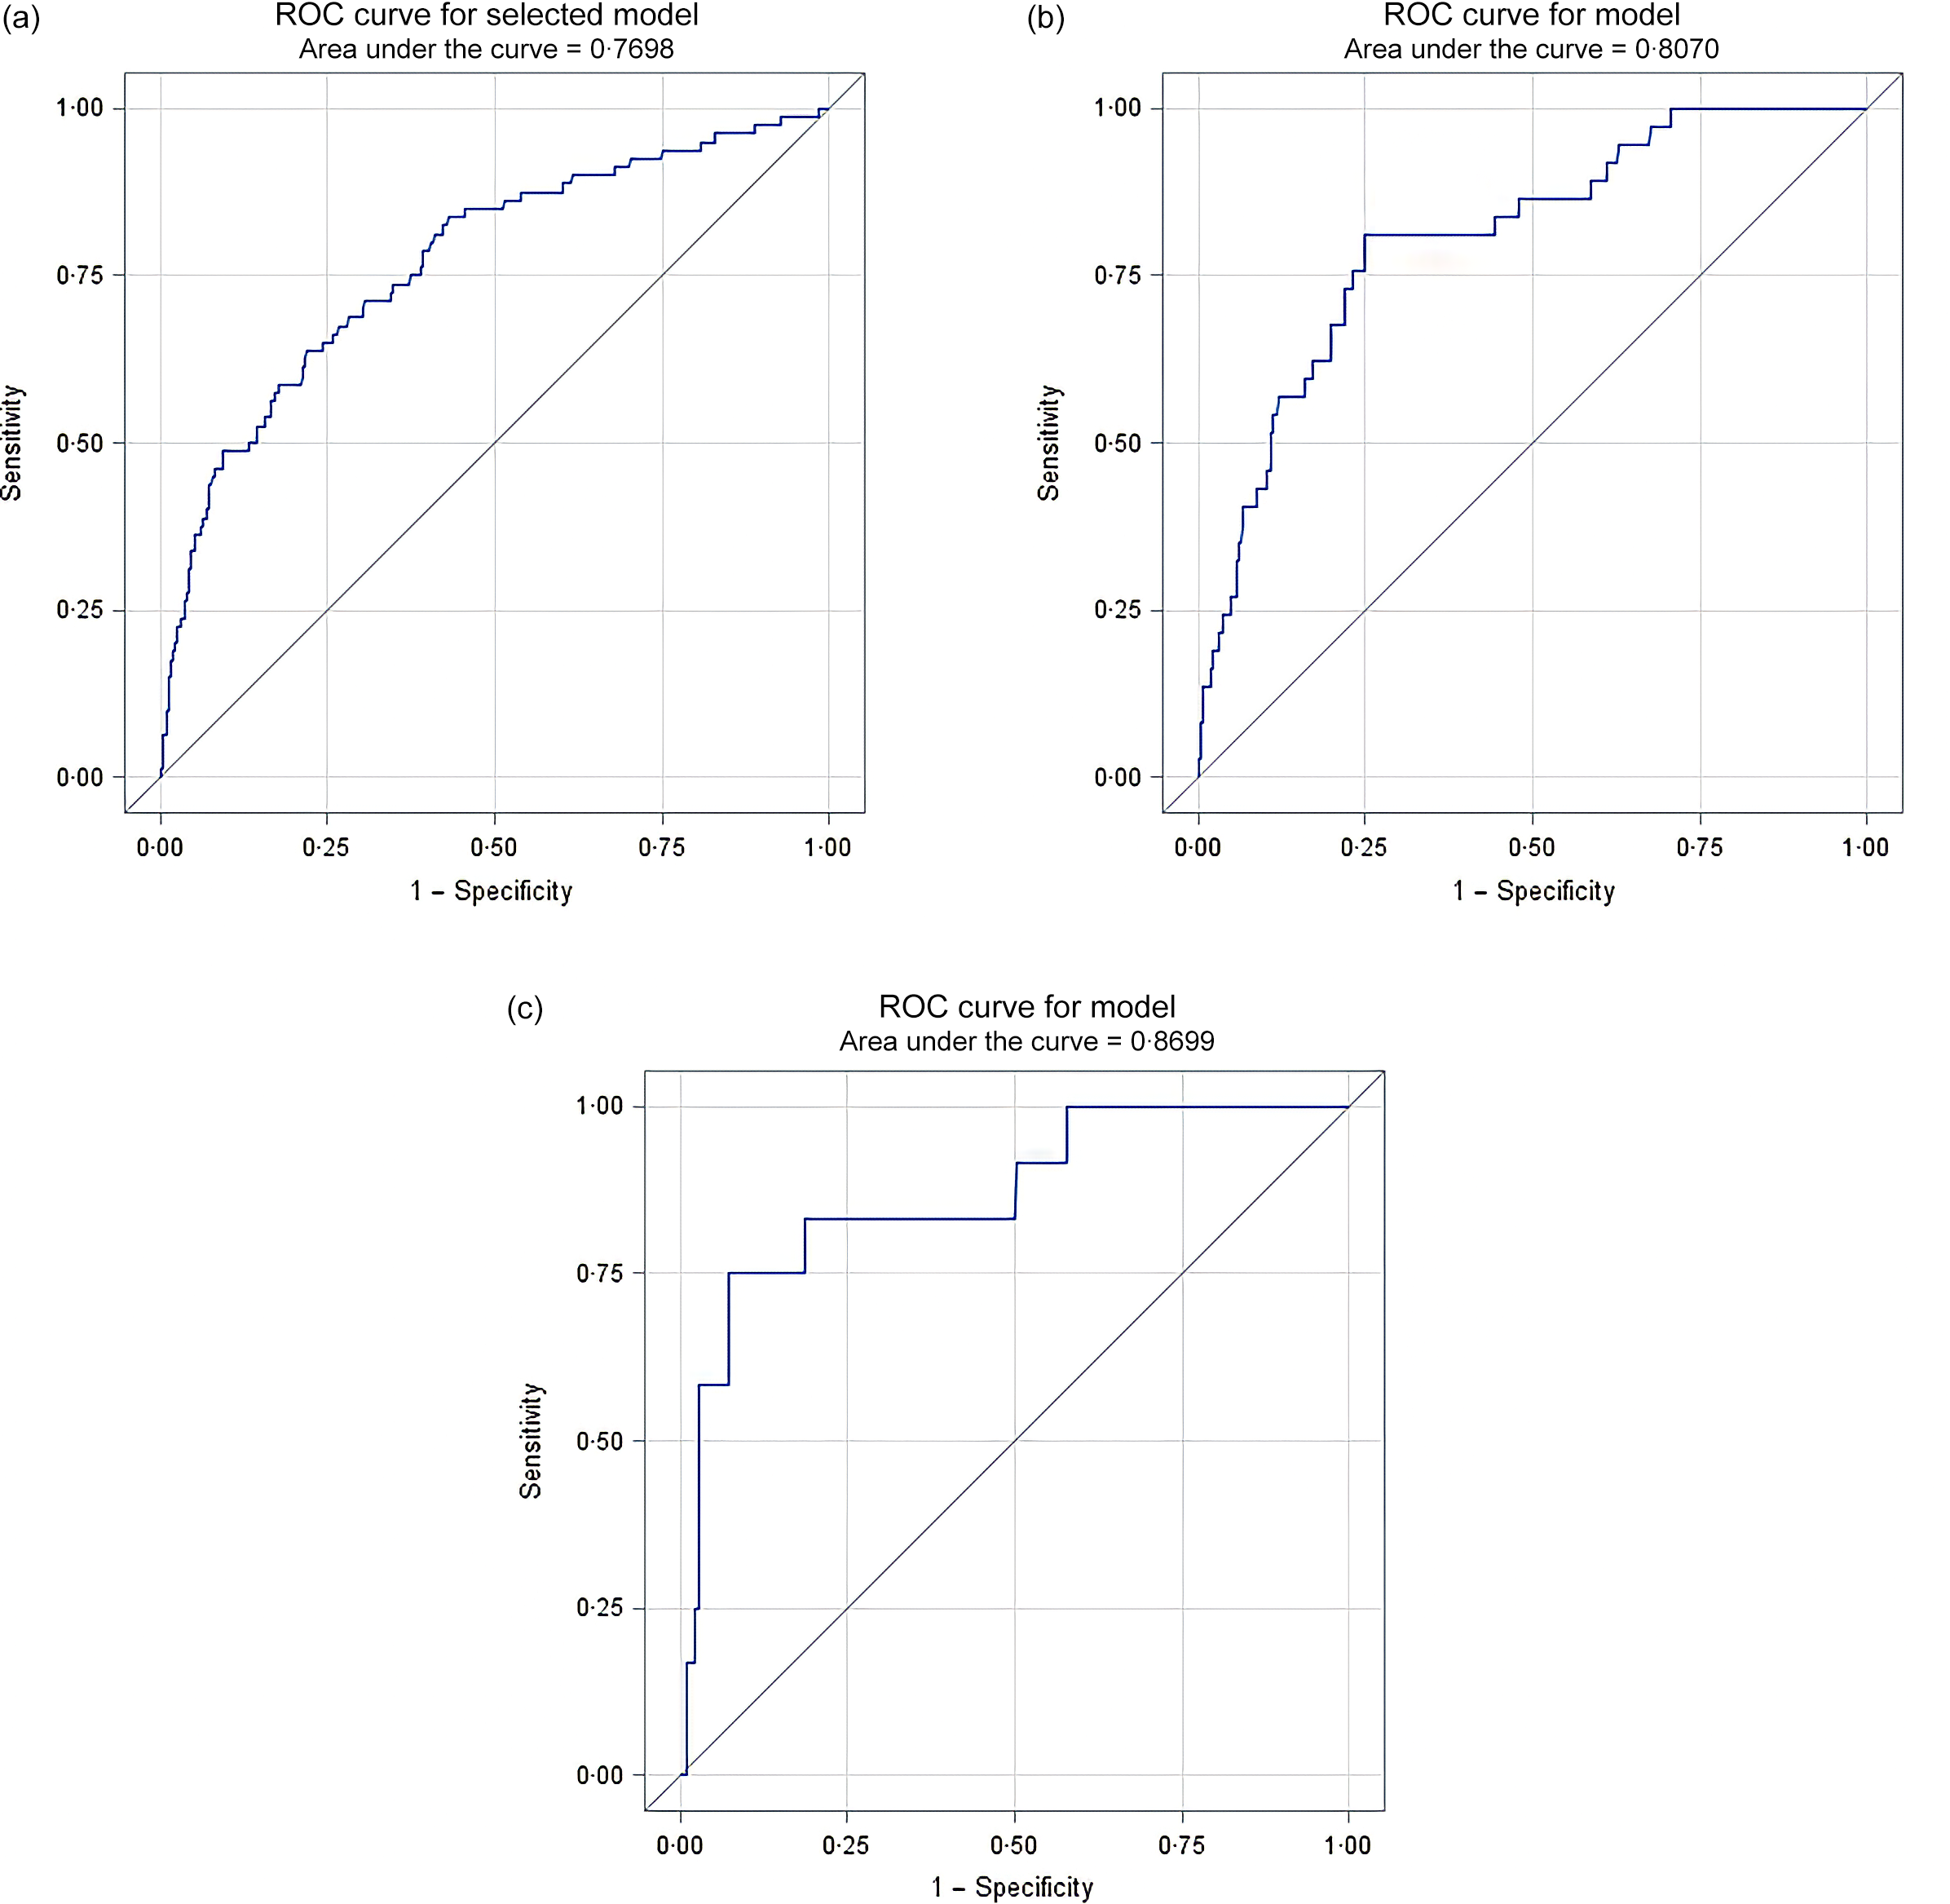
The MCH + RDW model showed strong discriminatory ability across all datasets, with AUC of 0·77 (95 % CI, 0·75, 0·79) in the training set, 0·81 (95 % CI, 0·79, 0·83) in the testing set and 0·87 (95 % CI, 0·85, 0·89) in the external validation set. Performance remained stable across populations, supporting the model’s generalisability (Figure 2(a)–(c)). The sensitivity of current screening model is 70·94 % (95 % CI, 61·83 %, 78·96 %), specificity is 75·43 % (95 % CI, 73·43 %, 77·35 %), positive predictive value 15·09 % (95 % CI, 13·07 %, 17·21 %) and negative predictive value 97·68 % (95 % CI, 97·65 %, 97·70 %). The optimal cut-off for MCH is 30(pg) and 12·9 % for RDW, which generate the optimal sensitivity and specificity.
(a) Receiver operating characteristic (ROC) curve showing the discrimination performance of the predictive model in the training set. (b) ROC curve showing the discrimination performance of the predictive model in the testing set. (c) ROC curve showing the discrimination performance of the predictive model in the validation set.

Figure 2. Long description
Three line graphs display the discrimination performance of the predictive model across different sets. The first graph, labeled (a), shows the ROC curve for the training set with an area under the curve of 0.7698. The second graph, labeled (b), presents the ROC curve for the testing set with an area under the curve of 0.8070. The third graph, labeled (c), illustrates the ROC curve for the validation set with an area under the curve of 0.8699. Each graph plots sensitivity against 1-specificity, with the diagonal line representing random chance. The curves demonstrate the model’s performance in distinguishing between classes in each respective set. All values are approximated.
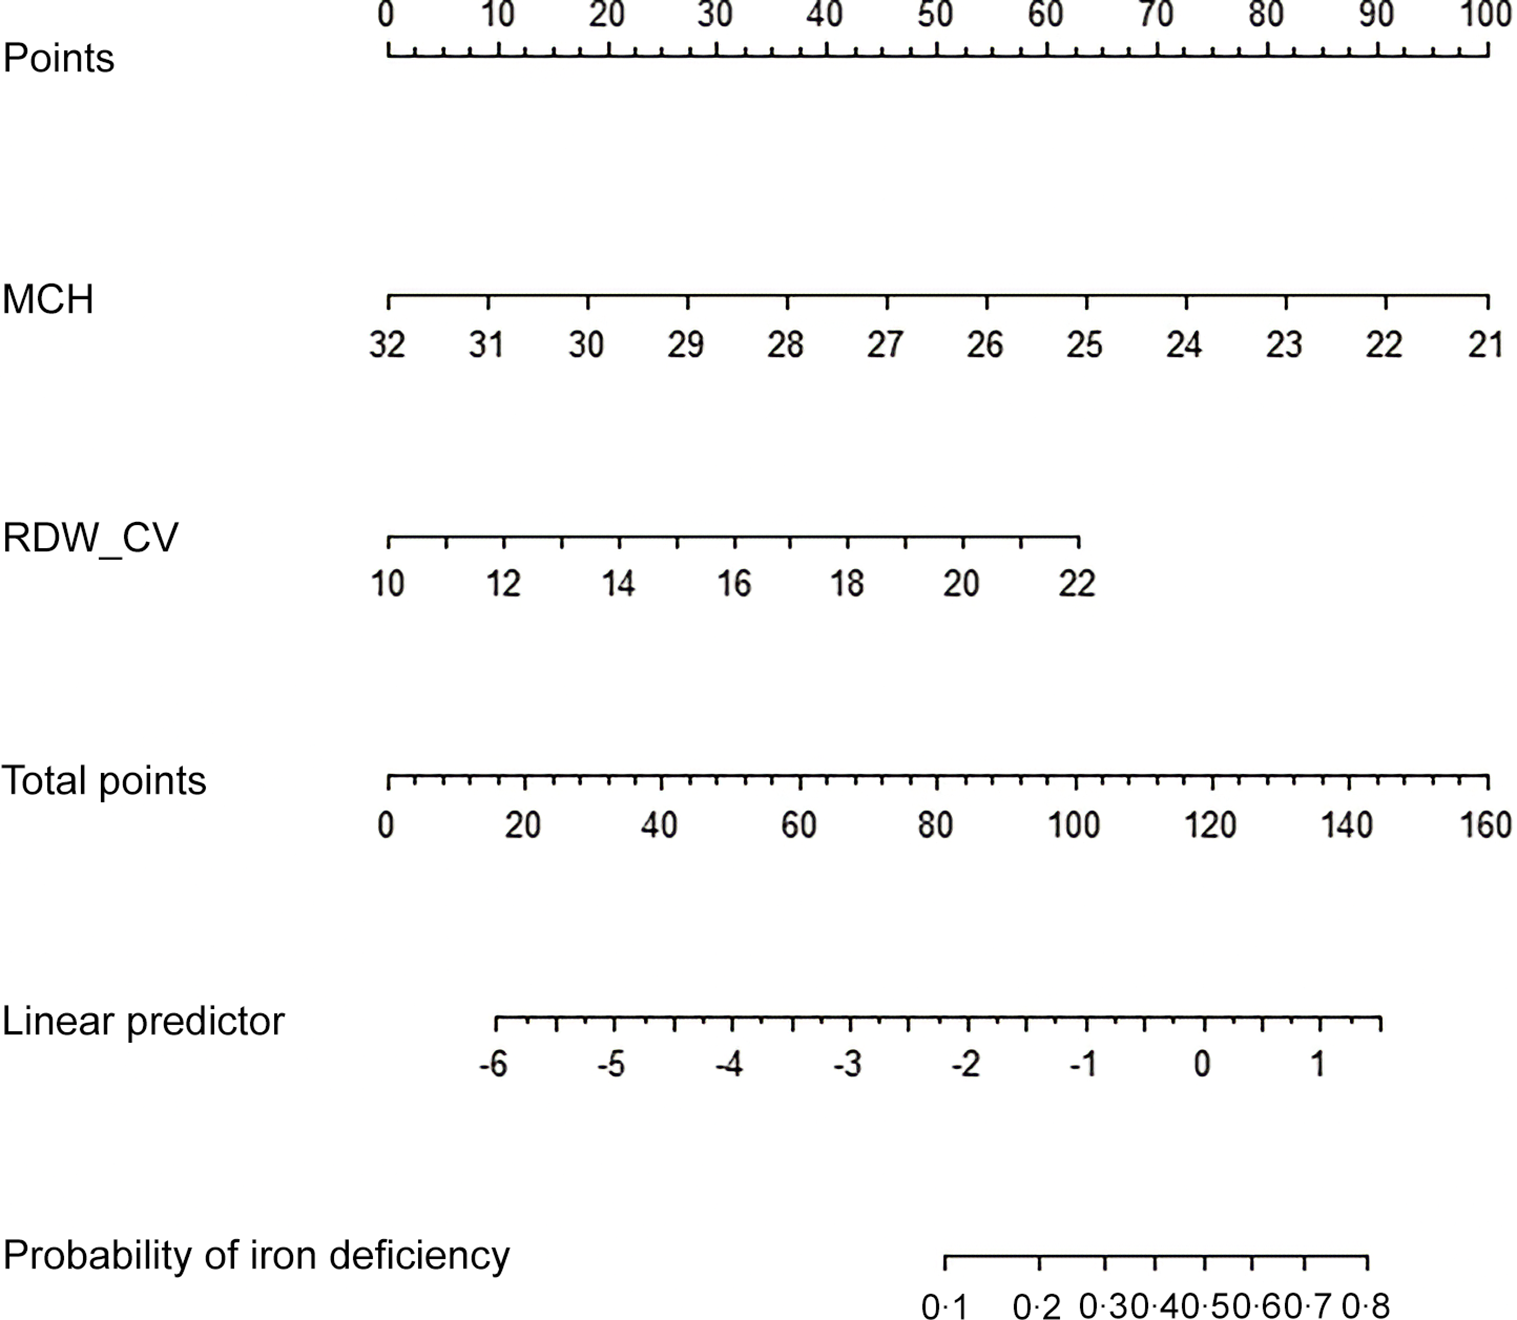
A nomogram based on MCH and RDW was developed to estimate the probability of NAID, providing a simple and clinically applicable tool for early screening in paediatric practice (Figure 3). Model performance was assessed using 10 % calibration, demonstrating good fit, which was consistent with the predictive accuracy of the nomogram.
Nomogram for predicting the probability of the event based on MCH and RDW. For each variable, draw a vertical line to the Points axis to obtain its score; sum all scores to derive total points, then project downward to obtain the predicted probability. For example, an MCH of twenty-eight and RDW of sixteen correspond to approximately forty and thirty points, respectively, yielding ∼70 total points and an estimated event probability of about 0·3.

Figure 3. Long description
The nomogram features three horizontal scales: Points, MCH, and RDW_CV. The Points scale ranges from 0 to 100, the MCH scale ranges from 21 to 32, and the RDW_CV scale ranges from 10 to 22. Below these scales, there are additional scales for Total points, Linear predictor, and Probability of iron deficiency. The Total points scale ranges from 0 to 160, the Linear predictor scale ranges from -6 to 1, and the Probability of iron deficiency scale ranges from 0.1 to 0.8. The nomogram allows users to draw vertical lines from specific MCH and RDW_CV values to the Points axis to obtain scores, sum these scores to get total points, and then project downward to determine the predicted probability of the event.
Discussion
This retrospective study shows that routine CBC parameters, particularly MCH and RDW, can predict NAID in a large paediatric cohort (n 2018). The predictive model, validated in training, testing and external datasets (AUC 0·77–0·87), together with a nomogram, provides a practical framework for early ID detection before progression to anaemia. This approach addresses a key limitation of current diagnostic practice, which relies mainly on serum ferritin and identifies ID only after substantial Fe depletion(Reference Goddard, James and McIntyre20). By shifting the focus to earlier screening, these findings support more timely intervention in a condition with major public health impact.
This study provides one of the first large-scale evaluations in a Chinese paediatric population of CBC parameters for NAID. Prior work has mainly reported RDW elevations in established IDA, with means of 14–16 %(Reference Viswanath, Hegde and Murthy21). In contrast, we observed earlier and subtler changes (12·8 % locally; 13·7 % in validation), suggesting RDW may serve as a preemptive marker of erythropoietic stress. MCH also showed predictive value beyond its conventional role as a secondary parameter, consistent with findings in Korean adults (AUC 0·75)(Reference Choi22). Our higher AUC in children may reflect age-related haematologic dynamics(Reference Powers and Buchanan16). Compared with ferritin-based diagnostics – which achieve AUC of 0·78–0·85 but rely on venous sampling and detect ID only at later stages, the CBC-based approach offers a practical, minimally invasive alternative(Reference Thompson, Block and Wang23) (Zimmermann and Hurrell 2007)(Reference Zimmermann and Hurrell14). Unlike global prevalence estimates that overlook pre-anaemic stages(Reference McLean, Cogswell and Egli24), our model leverages routine CBC data to identify this earlier, hidden burden.
Conventional diagnostic approaches relying on venous blood are invasive and difficult to implement in paediatric populations, particularly in settings where advanced Fe diagnostics are limited(Reference Baker and Greer17). Our model, potentially adaptable to finger-prick sampling, leverages the near-universal availability of CBC testing to enable earlier detection. This is especially relevant in rural China, where ID prevalence approaches 30 %(Reference Zeng, Zheng and Gao25), compared with < 10 % in high-income countries(Reference Atkins, Spence and Szymlek-Gay26). A further strength of this study is its population specificity. Haematologic reference ranges vary by ethnicity, and our lower RDW thresholds and pre-anaemic focus refine prior findings from Western cohorts(Reference Buttarello27), improving applicability to East Asian children. This enhances diagnostic precision beyond broader multi-ethnic frameworks(Reference Petry, Olofin and Hurrell28) and aligns with regional norms(Reference McLean, Cogswell and Egli24). In addition, the incorporation of a nomogram distinguishes this work from studies relying solely on ROC analysis. By translating predictive performance into an accessible tool, the nomogram supports practical clinical decision-making, achieving AUC comparable to ferritin-based tests but without the logistical challenges of venous sampling.
Beyond its clinical applications, this study highlights opportunities for further refinement. Validation across multiple datasets supports the robustness of the model and reduces concerns about overfitting, which have limited earlier RDW studies(Reference Viswanath, Hegde and Murthy21). Nonetheless, logistic regression may not capture complex variable interactions. Advanced approaches have shown promise in haematologic prediction, specifically, algorithms such as random forests, gradient boosting and artificial neural networks are adept at modelling complex, non-linear relationships in biological data and have been successfully used in haematologic prediction(Reference Tepakhan, Srisintorn and Penglong29,Reference Radakovich, Nagy and Nazha30) . Additional CBC parameters, including reticulocyte Hb content (CHr), have also been shown to improve early ID detection(Reference Brugnara, Zurakowski and DiCanzio31) and warrant exploration. These directions provide a foundation for iterative model enhancement.
The findings also have implications for health policy and resource allocation. In developing countries, where the WHO prioritises cost-effective interventions, this CBC-based model offers greater scalability than ferritin testing(Reference Kassebaum, Jasrasaria and Naghavi3). Integration into national paediatric screening programmes could support progress towards child health and nutrition targets under the sustainable development goals(Reference Stevens, Finucane and De-Regil32). Ethically, minimising invasive procedures respects patient autonomy and comfort, particularly in infants, and aligns with principles of beneficence(Reference Beauchamp33). Compared with ferritin-based protocols common in high-income settings, this approach emphasises accessibility over laboratory precision, a trade-off that merits further economic evaluation(Reference Stoltzfus34).
Several limitations should be considered. First, reliance on venous blood samples may limit comparability with thresholds derived from peripheral blood, although external validation suggests adaptability and is consistent with prior finger-prick screening studies(Reference Hinnouho, Barffour and Wessells35). Furthermore, the model was developed using data from high-precision laboratory analysers; its performance might vary when using point-of-care devices, which can exhibit different analytical precision and potential biases for certain CBC parameters(Reference Shean and Bennett36). Second, the focus on Chinese and US cohorts restricts generalisability, as haematologic parameters vary significantly across global populations. The lack of detailed comparative demographic data to formally assess the representativeness of our sample against national surveys may further limit the broader generalisability of our findings(Reference McLean, Cogswell and Egli24). Therefore, external validation in other populations, particularly from regions with a high burden of both Fe deficiency and infectious diseases such as Sub-Saharan Africa, South Asia and Latin America, is an essential prerequisite before any consideration of deployment in those areas. Additionally, the absence of sequential CBC data limits assessment of longitudinal changes, as highlighted in developmental studies(Reference Walker, Wachs and Gardner37). Third, our reliance on serum ferritin as the reference standard has several important limitations. Although we excluded children with elevated CRP, ferritin is an acute-phase reactant, and residual subclinical inflammation may still have inflated its values, potentially underestimating the true prevalence of ID. We used a single ferritin cut-off across a wide age range, whereas age-specific thresholds are recommended, particularly a lower cutoff of < 12 ng/ml for younger children. To address this, we performed a sensitivity analysis using this stricter cut-off for children under five and found it did not meaningfully increase case identification, suggesting our model is robust to this threshold variation. Ferritin primarily reflects storage Fe and may not capture functional Fe deficiency affecting erythropoiesis, for which markers like transferrin saturation or soluble transferrin receptor could be more informative. Finally, our model was developed using a stepwise regression approach. While useful for creating a practical and parsimonious screening tool, stepwise selection has inherent statistical limitations, most notably a potential risk of overfitting to the derivation dataset. Future studies employing advanced penalised regression techniques (such as LASSO or Ridge regression) may further refine and validate the variable selection process.
Despite these limitations, the study has notable strengths. Unlike previous studies that have focused primarily on adults or on diagnosing established Fe deficiency anaemia, this study specifically evaluates the predictive value of CBC parameters for non-anaemic Fe deficiency in young children. By examining a large paediatric Chinese cohort and externally validating the model, our work provides population-specific evidence that has been largely absent from the existing literature. Its large sample size, focusing on an ethnically specific pediatric population, robust validation across datasets and development of a nomogram, makes it an important contribution to ID research. Future work should include prospective validation using peripheral blood to improve accessibility, extension to multi-ethnic cohorts to enhance generalisability and application of advanced computational methods to improve predictive accuracy(Reference Radakovich, Nagy and Nazha30). Policy integration and economic evaluation could further support translation into practice, while incorporation of additional CBC markers may broaden diagnostic capacity. By demonstrating the value of routine CBC parameters as early predictors of ID, this study provides a foundation for their integration into paediatric screening and for improving early detection and outcomes.
Conclusions
This study, using data from Chinese and US pediatric cohorts, demonstrates that MCH and RDW can be used to develop an effective case-finding tool for NAID. The predictive model (AUC 0·77–0·87) and nomogram are designed to enhance risk stratification during routine paediatric assessments in settings with access to automated haematology analysers. This approach offers a feasible method for identifying children at higher risk, particularly where advanced Fe studies are limited, but complete blood counts are readily available. Prospective validation in diverse clinical practices is needed to confirm its utility. If validated, this tool could be integrated into routine paediatric care to aid in the early and targeted management of ID.
Acknowledgements
The authors acknowledge the colleagues in the laboratory department for their valuable technical support and professional guidance.
This work was sponsored by the Joint Funds for the innovation of science and Technology, Fujian province (Grant No.: 2024Y9552), Fujian provincial health technology project (Grant No.: 2019-2-13) and Special Research Fund of Fujian Maternity and Child Health Hospital (Grant Nos.: YCXQ18-44, YCXM 20-54).
C. G. and F. Z. conceptualised the study. C. G., F. Z., M. M. and J. Q. collected the data. C. G. and Z. Q. analysed the data and drafted the manuscript. P. G. and J. G. critically reviewed the manuscript and contributed important intellectual content. P. G. and J. G. supervised the project.
The authors of this manuscript have no conflicts of interest to disclose. No financial or non-financial benefits have been received or will be received from any party related directly or indirectly to the subject of this article.