Specific language impairment (SLI) is characterized by persistent low performance on language measures in comparison to the performance of typical development (TD) peers, in the absence of intellectual disorders, severe hearing loss, sensory deficits, frank neurological disorders, or other developmental problems (Leonard, Reference Leonard1998; Rice, Warren, & Betz, Reference Rice, Warren and Betz2005). SLI has been understood to be a disorder that predominantly affects morphosyntax and/or lexical semantics (Kail, Reference Kail1994; Leonard & Deevy, Reference Leonard, Deevy, Traxler and Gernsbacher2006; Miller, Kail, Leonard, & Toblin, Reference Miller, Kail, Leonard and Tomblin2001) and has been related to mild impairments in the computational syntactic system itself (Gopnik & Crago, Reference Gopnik and Crago1991; van der Lely, Reference van der Lely1994, Reference van der Lely1998, Reference van der Lely2002). However, research showing executive function deficits in SLI (e.g., in working memory) suggests a more domain-general account of SLI (Ellis Weismer, Evans, & Hesketh, Reference Ellis Weismer, Evans and Hesketh1999; Kail, Reference Kail1994; Miller et al., Reference Miller, Kail, Leonard and Tomblin2001; Peristeri & Tsimpli, Reference Peristeri and Tsimpli2013).
In addition to these competing views, our understanding of SLI is made more complex by the increasing numbers of children with atypical language development growing up in simultaneous or sequential bilingual contexts. Studies of TD bilinguals suggest that bilingual competence enhances the domain-general executive control system to deal with language conflict (Bialystok, Reference Bialystok2009; Bialystok & Viswanathan, Reference Bialystok and Viswanathan2009; Carlson & Meltzoff, Reference Carlson and Meltzoff2008), while in studies of SLI, a double delay has been hypothesized (Orgassa & Weerman, Reference Orgassa and Weerman2008; Steenge, Reference Steenge2006). This hypothesis posits that setting the value of core syntactic parameters may be constrained in bilinguals with SLI because the language input in each language is not sufficient to allow successful encoding of linguistic patterns, as well as because dual language input requires verbal control skills that are limited by the language impairment.
Paradis and colleagues (Paradis, Crago, & Genesee, Reference Paradis, Crago and Genesee2005/2006; Paradis, Crago, Genessee, & Rice, Reference Paradis, Crago, Genesee and Rice2003; see also Paradis, Reference Paradis2010, for a general overview), however, have refuted the double-delay hypothesis by demonstrating that French–English bilingual children with SLI exhibited accuracy levels similar to monolingual peers with SLI on object clitic production tasks. A small number of subsequent studies also showed that bilingual and monolingual children with SLI did not differ on a range of morphosyntactic markers. Furthermore, Armon-Lotem (Reference Armon-Lotem2012) found no significant differences between bilingual English–Hebrew and Hebrew-speaking monolingual children with SLI on inflectional morphology and prepositions.
Studies that have attempted to disentangle genuine language impairment from the effects of bilingualism have mostly focused on morphosyntactic production, rather than on more global features of language performance instantiated in connected speech and/or narrative comprehension and production. In the current study, we tested the hypothesis that SLI and bilingualism effects would map onto distinct levels of narrative production, with language impairment affecting microstructural features of the stories, and bilingualism affecting properties of macrostructure in narrative production, such as use of internal state terms and story grammar.
NARRATIVE DEVELOPMENT IN TD CHILDREN
The ability to tell stories requires an understanding of linguistic, cognitive, and social domains (Tager-Flusberg & Sullivan, Reference Tager-Flusberg and Sullivan1994). An effective narrator not only has to structure the story's events in an intelligible and unambiguous way, taking into consideration the listener's needs for understanding the setting, characters, and outcomes of the story (Rumpf, Kamp-Becker, Becker, & Kauschke, Reference Rumpf, Kamp-Becker, Becker and Kauschke2012), but is also required to consider the perspectives of the story characters in order to explain their motivations and reactions (Stein & Glenn, Reference Stein, Glenn and Freedle1979).
Children's narratives thus reflect a combination of linguistic and conceptual knowledge. Their stories have been evaluated accordingly through analyses of microstructure and macrostructure (Liles, Duffy, Merritt, & Purcell, Reference Liles, Duffy, Merritt and Purcell1995). The microstructure can be defined as the syntactic and lexical levels of the narrative (i.e., linguistic form and content) and has been described in terms of both productivity and complexity (Hughes, McGillvray, & Schmidek, Reference Hughes, McGillvray and Schmidek1997). For example, linguistic form has been assessed using mean length of utterance in words (e.g., Miller, Reference Miller1981), number of C-units (i.e., one main clause with all dependent clauses; Hunt, Reference Hunt1965), and various measures of sentence complexity including grammatical forms (e.g., verbal tense/aspect/voice inflectional morphology), lexical forms (e.g., lexical aspect and manner of motion/cause verbs), and lexicogrammatical features (e.g., locative particles, prepositional phrases, and connectives; Nippold, Hesketh, Duthie, & Mansfield, Reference Nippold, Hesketh, Duthie and Mansfield2005; Schuele & Tolbert, Reference Schuele and Tolbert2001; Scott & Stokes, Reference Scott and Stokes1995). In contrast, measures of linguistic content typically calculate children's lexical diversity using type–token ratios (Templin, Reference Templin1957), or number of different content and function words (Miller & Klee, Reference Miller, Klee, Fletcher and MacWhinney1995).
The development of the microstructure of TD children's narratives is relatively protracted and is not complete even by age 10 (e.g., Blankenstijn & Scheper, Reference Blankenstijn and Scheper2003). More specifically, previous studies have shown that the narratives of young TD children show reduced length and variation in content words in comparison to older children (Botting, Reference Botting2002; Justice, Skibbe, & Ezell, Reference Justice, Skibbe, Ezell and Ukrainetz2006). Around the age of 4, children begin to increase their lexical diversity (Elbers & van Loon-Vervoorn, Reference Elbers, van Loon-Vervoorn, Gillis and Schaerlaekens2000) and complex propositions (Berman & Slobin, Reference Berman and Slobin1994; Justice et al., Reference Justice, Skibbe, Ezell and Ukrainetz2006; Kaderavek & Sulzby, Reference Kaderavek and Sulzby2000; Reilly, Losh, Bellugi, & Wulfeck, Reference Reilly, Losh, Bellugi and Wulfeck2004). The development of character reference tracking is also gradual and protracted (Karmiloff-Smith, Reference Karmiloff-Smith1985; Wigglesworth, Reference Wigglesworth1997).
In contrast with microstructure, the macrostructure of a narrative refers to its global hierarchical organization and coherence that transcends the level of the individual utterance. Macrostructure is characterized by the scaffolding of episodes in the story plot, event sequencing, and the internal states of protagonists motivating or reacting to the events in the story (e.g., Liles et al., Reference Liles, Duffy, Merritt and Purcell1995; McCabe & Peterson, Reference McCabe and Peterson1984; McCabe & Rollins, Reference McCabe and Rollins1994). The majority of macrostructure measures of children's narratives share the underlying principles of the story grammar/episodic structure model (Fiestas & Peña, Reference Fiestas and Peña2004; Price, Roberts, & Jackson, Reference Price, Roberts and Jackson2006; Schneider, Hayward, & Dubé, Reference Schneider, Hayward and Dubé2006; Soodla & Kikas, Reference Soodla and Kikas2010). The story grammar model proposes that all stories have a setting and episode system; the setting provides background information and introductory statements about the characters and the providing context, while the episode system includes (a) an initiating event (i.e., an external event that motivates main characters to act); (b) internal plans (i.e., intended actions to achieve a goal and solve the problem); and (c) outcomes (i.e., success or failure in achieving a goal). A complete episode must include all three of these key components (McCabe & Peterson, Reference McCabe and Peterson1984). Studies have found a developmental increase in the number of important story components included in oral narratives, with the ability to express a character's reactions or internal responses being fully acquired around the age of 10 (Bishop & Donlan, Reference Bishop and Donlan2005; van den Broek, Reference van den Broek, van den Broek, Bauer and Bourg1997).
Theory of mind (ToM) abilities have also been argued to underlie efficient production of characters’ reactions (Lorusso et al., Reference Lorusso, Galli, Libera, Gagliardi, Borgatti and Hollebrandse2007; Tomasello, Reference Tomasello2003). Children may express their understanding of characters’ thoughts and feelings through the use of internal state terms (ISTs), which can be divided into two general categories: emotional terms (happy, sad, and feel) and cognitive ones (think, remember, realize, wonder, and know; Westby, Reference Westby, Catts and Kamhi2005). So far, there is evidence showing a strong relationship between children's mastery of the syntax of sentential complementation and their understanding of the mind of others (de Villiers, Reference de Villiers, Astington and Baird2005, Reference de Villiers2007). Knowledge of how to use morphosyntactic structures and adapt them to the communicative context, including other individuals’ perspectives, continues to develop into adolescence (Reilly et al., Reference Reilly, Losh, Bellugi and Wulfeck2004). Research further suggests acquisition of ISTs depends on the terms in question; Baldimtsi, Peristeri, and Tsimpli (Reference Baldimtsi, Peristeri and Tsimpli2014) found that volitional and emotional terms in narrative contexts preceded cognitive ones in 7- to 12-year-old TD children.
Compared to monolingual peers, TD bilingual children have been shown to perform similarly in their second language (L2) across a number of narrative skills, including story structure, affective information about characters, metacognitive statements, and temporal links, providing support for cross-language transfer of higher order narrative skills, while other data have suggested little transfer of lower order categories, such as vocabulary and morphosyntax (Pearson, Reference Pearson, Oller and Eilers2002; Uccelli & Paz, Reference Uccelli and Paez2007). TD bilinguals have even been found to outperform monolingual children on some narrative measures; Chen and Yan (Reference Chen and Yan2011) found that bilingual children in their study integrated perspective taking and meta-awareness of the protagonists’ intentions and emotions to their L2 narratives more fully than their monolingual peers. The group difference was evident in the bilingual children's higher use of evaluative expressions referring to the feeling states of the story characters and the events of the stories, in comparison to their monolingual peers, even though the bilingual group had less exposure to English/L2 than the monolingual children.
Narrative comprehension in bilingual children with TD might also be expected to surpass that of monolingual children, given that bilinguals are shown to be more highly skilled than monolinguals at recruiting top-down mechanisms to efficiently integrate information pieces during comprehension (Ambrose & Molina, Reference Ambrose and Molina2014). Moreover, bilingual children's domain-specific experience with cross-linguistic competition has been shown to transcend to domain-general executive functions, suggesting that bilingual children may be particularly adept at inhibiting irrelevant information (Carlson & Meltzoff, Reference Carlson and Meltzoff2008; Soveri, Laine, Hamalainen, & Hugdahl, Reference Soveri, Laine, Hamalainen and Hugdahl2011) and at selectively focusing attention (e.g., Bruck & Genesee, Reference Bruck and Genesse1995; Chen et al., Reference Chen, Anderson, Li, Hao, Wu and Shu2004). These skills could have benefits for attending to an oral narrative, and then engaging in a story retell, as bilingual (and monolingual) children were asked to do in this study.
NARRATIVES IN CHILDREN WITH SLI
Over the past two decades, a considerable volume of experimental work has accumulated on the topic of narrative production in monolingual children with SLI, and their control over micro- and macrostructure properties in particular. Difficulties have been identified at both levels. Specifically, monolingual children with SLI have been found to differ from their TD peers in using fewer morphosyntactically complex sentences, connectives, and pronominal referential expressions; making more grammatical errors; and exhibiting reduced lexical diversity during narrations (Fey, Catts, Proctor-Williams, Tomblin, & Zhang, Reference Fey, Catts, Proctor-Williams, Tomblin and Zhang2004; Gillam & Johnston, Reference Gillam and Johnston1992; MacLachlan & Chapman, Reference MacLachlan and Chapman1988; Miranda, McCabe, & Bliss, Reference Miranda, McCabe and Bliss1998; Norbury & Bishop, Reference Norbury and Bishop2003). Some studies have also reported differences from age-matched TD children in narrative length, more specifically, in number of utterances or words (Botting, Reference Botting2002; Fey et al., Reference Fey, Catts, Proctor-Williams, Tomblin and Zhang2004; Newman & McGregor, Reference Newman and McGregor2006).
Research has led to rather contradictory conclusions regarding the macrostructure in the oral narratives of monolingual children with SLI. Some studies have shown that children with SLI produce fewer story grammar components and fewer complete episodes relative to age-matched TD peers (Reilly et al., Reference Reilly, Losh, Bellugi and Wulfeck2004; Roth & Spekman, Reference Roth and Spekman1986). Global aspects of storytelling, including quantity and quality of goal-directed events, ISTs, and inferencing strategies, have also been found to be fragile in children with SLI (Bishop & Donlan, Reference Bishop and Donlan2005; Manhardt & Rescorla, Reference Manhardt and Rescorla2002; Reilly et al., Reference Reilly, Losh, Bellugi and Wulfeck2004; Soodla & Kikas, Reference Soodla and Kikas2010). Other studies have provided conflicting evidence. Merritt and Liles (Reference Merritt and Liles1987) did not find significant differences between children with SLI and age-matched controls at the macrostructure level. Similarly, Norbury and Bishop (Reference Norbury and Bishop2003) did not find between-group differences in realizing the story grammar components of initiation, attempt, and resolution. There are even studies showing that monolingual children with SLI performed at comparable levels with their TD peers (Dodwell & Bavin, Reference Dodwell and Bavin2008; Olley, Reference Olley1989; Ukrainetz & Gillam, Reference Ukrainetz and Gillam2009). Clear evidence of benefits stemming from bilingualism in SLI children's use of reference has been provided by Jaber's study (as cited in Armon-Lotem, Reference Armon-Lotem2010) with English–Hebrew bilingual children with SLI and monolingual Hebrew-speaking children with SLI. The bilingual group exhibited more pragmatically appropriate patterns of referential forms in their narratives compared to the monolingual group, a finding that Jaber (as cited in Armon-Lotem, Reference Armon-Lotem2010) has attributed to the bilingual group's positive between-language transfer of referential strategies.
THE PRESENT STUDY
There is general consensus that children with SLI produce significantly impoverished narratives when compared to TD children on microstructure, that is, on isolated grammatical or/and lexical skills. The first objective of the present study was to identify aspects of microstructure in narratives that are most affected in both monolingual and bilingual children with SLI relative to TD groups. According to well-documented patterns of language deficits in populations with SLI, we expected children with SLI to produce fewer subordinate clauses and to exhibit lower lexical diversity than would TD controls.
The study's second objective was to investigate whether bilingualism would confer an advantage in the performance of bilingual groups with and without SLI on narrative macrostructure. Notwithstanding the cognitive effort of having to monitor language processing and production in a competing context of two activated languages, bilingualism appears to bestow a general cognitive benefit in TD children relative to monolingual peers (Greenberg, Bellana, & Bialystok, Reference Greenberg, Bellana and Bialystok2013; Morales, Calvo, & Bialystok, Reference Morales, Calvo and Bialystok2013). Though there are still critical gaps in our knowledge regarding the specific nature of the cognitive control benefits in TD bilingual children (and more so in bilingual children with SLI), a number of studies have provided evidence in favor of enhanced inhibition and cognitive flexibility (Bialystok, Reference Bialystok2011; Foy & Mann, Reference Foy and Mann2013), as well as in ToM and pragmatic abilities among bilinguals (Bialystok, Reference Bialystok2009; Goetz, Reference Goetz2003).
Our expectation was that the narrative performance of bilingual children would be better than monolinguals at the level of IST attribution and story structure, that is, the ability to establish deep-level links between propositions, such as cause and consequence. These predictions were based on the aforementioned studies showing that macrostructure is relatively preserved in SLI and that bilingualism confers cognitive benefits that could enhance children's ability to take a global perspective on the story and derive the story's core aspects. This selective benefit, though, was expected to be relatively modest for bilingual children with SLI as compared to TD bilinguals, given their weaker control over microstructure.
In addition to examining group effects, the present study explored predictors of narrative performance. Predictors included working memory and language ability (estimated using scores of expressive vocabulary and sentence repetition, which were measured outside the narrative context), as well as the key variables of language impairment and bilingualism.
METHOD
Participants
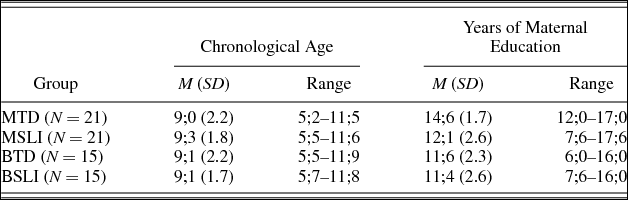
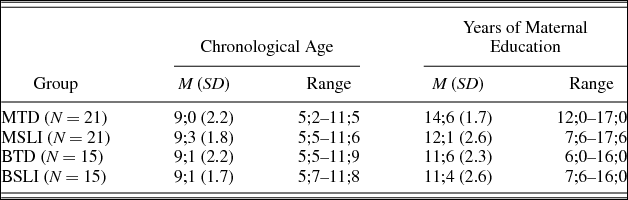
Our participants were four groups of children: 21 monolingual Greek-speaking children with SLI (7 boys, mean age = 9 years, 3 months [9;3]), 15 bilingual children with SLI (8 boys, mean age = 9;1), 21 age-matched TD monolingual (14 boys, mean age = 9;0), and 15 age-matched bilingual children (14 boys, mean age = 9;1). There was no significant difference in chronological age among the groups (p = .982). The TD children were recruited from a mainstream school in Thessaloniki, Northern Greece. Selection criteria specified that they had normal hearing and no speech, emotional, or behavior problems, or observed neurological or severe articulation/phonological deficits as reported by children's teachers and parents. Formal written consent was obtained from the children's parents prior to participation in the study.
Children with SLI were recruited from a diagnostic center in central Greece. They had a speech and language therapist's/clinician's diagnosis of receptive or/and expressive SLI in the absence of any hearing losses, obvious neurological dysfunctions, or motor deficits. Prior to data collection, both monolingual and bilingual children with SLI were administered the Greek version of the Weschler Intelligence Scale for Children—Third edition (Wechsler, Reference Wechsler1992; adapted in Greek by Georgas et al., Reference Georgas, Paraskevopoulos, Besevegis, Giannitsas, Mylonas, Georgas, Weiss, van and Saklofske2003). Only children whose verbal abilities were at least 2 SD below the expected normative mean of chronologically age-matched peers and with nonverbal scores within the normal limits for their chronological age (Bloom & Lahey, Reference Bloom and Lahey1978) were recruited for the study. Moreover, parental questionnaires and language unit class teachers’ reports were used to confirm delays in early language milestones and expressive difficulties in both oral and written modalities (Leonard, Reference Leonard1998). Most (n = 11) of the bilingual children with SLI were Albanian–Greek, but 1 Bulgarian–Greek, 1 English–Greek, 1 Romanian–Greek, and 1 Ukranian–Greek participant were also included. The majority of age-matched TD bilingual children (n = 13) were also Albanian–Greek, except for 1 German–Greek boy and 1 Bulgarian–Greek girl.
Children's socioeconomic status was measured by maternal education (Blair et al., Reference Blair, Granger, Willoughby, Mills-Koonce, Cox and Greenberg2011; Psaki et al., Reference Psaki, Seidman, Miller, Gottlieb, Bhutta and Ahmed2014; Rhoades, Greenberg, Lanza, & Blair, Reference Rhoades, Greenberg, Lanza and Blair2011). There was a significant group effect, F (3, 71) = 7.474, p < .001; the mothers of TD monolingual children had significantly more years of education than the mothers of monolingual children with SLI (p = .008), TD bilingual children (p = .001), and bilingual children with SLI (p = .002). There were no significant differences observed among monolingual children with SLI, TD bilingual children, and bilingual children with SLI (p > .748; see Table 1 for more details on the groups’ ages and maternal education).
Number of children, mean (standard deviation) chronological age, and maternal education by group
Note: MTD, Monolingual typically developing children; MSLI, monolingual children with specific language impairment; BTD, bilingual TD children; BSLI, bilingual children with SLI.
Measures
Language and working memory (WM) measures
An assessment battery was administered to measure children's vocabulary knowledge, morphosyntactic abilities, and WM in Greek, as possible predictors of their narrative performance at the micro- and macrostructural levels.
Word Finding Vocabulary Test
This test (Vogindroukas, protopapas, & Sideridis, Reference Vogindroukas, Protopapas and Sideridis2009; adaptation from Renfrew, Reference Renfrew1997) assesses children's expressive vocabulary. It consists of 50 black-and-white pictures depicting commonplace objects that each child was required to name. Testing stopped when the child either finished all trials or failed to respond correctly in five consecutive trials. Each correct naming was given 1 point, with a maximum score of 50.
Sentence repetition
This subtest of the Diagnostic Verbal Intelligence Quotient (Stavrakaki & Tsimpli, Reference Stavrakaki, Tsimpli, Glykas and Kalomiris2000) was developed to assess language development in 6- to 9-year-old Greek-speaking children. Sentence repetition tasks are widely accepted as measures of children's morphosyntactic knowledge and have been used with TD children, as well as children with abnormal language development, including SLI (Archibald & Joanisse, Reference Archibald and Joanisse2009; Seeff-Gabriel, Chiat, & Dodd, Reference Seeff-Gabriel, Chiat and Dodd2010; Thordardottir & Brandeker, Reference Thordardottir and Brandeker2012). This sentence repetition test consisted of 10 sentences of increasing syntactic difficulty, namely, active transitive, passive, conditionals, subject and object relative, subjunctive, and interrogative clauses. Each child was required to repeat each sentence verbatim after the examiner's presentation. Mistakes in the repeated word, omitted words, and wrong words were all counted as errors. The participant scored 3 points for each sentence repeated correctly; 2 points, 1 point, and 0 points were awarded in cases of one, two, or more than two errors, respectively. The highest possible score was 30.
Backward digit recall
WM was assessed with a backward digit recall task (Alloway, Reference Alloway2007). This is a span task in which the number of items to be remembered increases progressively over successive blocks containing six trials each. The criterion for moving on to the next block was correct recall of four out of the six trials. Test administration stopped if the child failed three trials in one block. The task consisted of six blocks, starting with two digits in the first block and increasing to sequences of seven digits in the last block. The highest possible score was 36 (6 blocks × 6 trials of 1 point each). Although a digit task, verbal memory is implicated because children had to verbally recode the numbers they heard from the examiner (Alloway & Alloway, Reference Alloway and Alloway2010).
Narrative measures
Children's narratives were assessed with the Multilingual Assessment Instrument for Narratives (MAIN) tool (Gagarina et al., Reference Gagarina, Klop, Kunnari, Tantele, Välimaa and Balčiūnienė2012), adapted into Greek and piloted in Greek-speaking monolingual and bilingual children populations (e.g., Peristeri et al., in Gagarina et al., Reference Gagarina, Klop, Kunnari, Tantele, Välimaa and Balčiūnienė2012). The tool comprises four parallel stories, each with a carefully designed six-picture sequence controlled for cognitive and linguistic complexity, parallelism in macro- and microstructure, as well as cultural appropriateness. The MAIN provides examiners with a choice of elicitation procedures, namely, telling (story generation) or retelling. The present study reports on children's retells in Greek, using the standard MAIN materials (see Introduction; Gagarina et al., Reference Gagarina, Klop, Kunnari, Tantele, Välimaa and Balčiūnienė2012). The two stories used for retelling were the Dog and Cat stories, each having four main characters (MCs). The scoring of the retells is described in the Transcription and Scoring section.
Procedures
Data collection took place over a period of 1 month. Each child with SLI was seen individually at a location most convenient for the child's parents (i.e., the diagnostic center or child's home), but all TD children were tested in school. All experimental sessions were recorded using a digital voice recorder. During these sessions, the examiner provided motivators (verbal reinforcement and a snack at end of session) as needed, but refrained from making any corrections. Each child was exposed individually to the same test protocols and procedures to ensure the reliability of the assessments. Language assessments were delivered first.
For the story retelling task, the child was shown three colored envelopes on a computer screen containing the MAIN stories and was asked to open one of them. The story that the child listened to was the same regardless of the envelope that he or she would pick, but the selection procedure was used so that the child would assume that the story he or she chose and would retell later was not known by the listener. Then the child heard a recorded version of the selected story with headphones to promote high-quality audio sound, while being shown two pictures at a time. While the child listened to the stories, a teacher unfamiliar with the purposes of the study was present in the room. After listening to the whole story, the child was asked to retell the story to an examiner who entered the testing room only after the child listened to the story. The examiner reminded the child that she did not know the story and could not see the pictures.
Transcription and scoring of narrative samples
Two of the authors transcribed the children's narrative samples using MAIN conventions (Gagarina et al., Reference Gagarina, Klop, Kunnari, Tantele, Välimaa and Balčiūnienė2012), then randomly selected 25% of the total number of samples (i.e., 18 retelling productions per picture story) of both SLI and TD children to transcribe for reliability purposes. The author who conducted the experimental session originally transcribed the narrative samples, and a second transcriber independently retranscribed the same sample approximately 1 month later. Transcripts were compared on a word-by-word basis, and agreement was calculated by dividing the total number of words in agreement by the total number of words included in the original transcriptions. The percentage agreement mean (and range) for the narrative samples was 97.2% (91.0%–99.7%).
With respect to microstructure, two scores were calculated: number of different words (i.e., lexical diversity) and ratio of subordinate clauses to total number of C-units (as noted in the literature review, a C-unit is defined as one main clause with all dependent clauses; Hunt, Reference Hunt1965). Macrostructure measures included the evaluation of structural complexity expressed through ISTs and story structure composites. To calculate ISTs, we considered two overarching categories determined by their relation to ToM states. Specifically, perceptual (such as see and hear), physiological (such as thirsty and hungry), and linguistic (such as shout and say) terms were grouped together under −ToM-related ISTs, while lexical items expressing emotion (e.g., sad and angry) and mental verbs (such as think and wonder) were grouped under the +ToM-related ISTs category.
Story structure was measured by calculating the number and structure of episodes per story. Each story was divided into three episodes with each one of them consisting of (a) a goal for the MC (i.e., main character, as previously defined); (b) an attempt by the MC to reach the goal; and (c) an outcome of the MC's attempt to reach the goal. The child was awarded 3 points for the correct identification and expression of goal, attempt, and outcome; 2 points for expressing either the goal and the outcome or the attempt and the outcome; 1 point for expressing both goal and attempt; and zero points for expressing only one element, that is, the goal, the attempt, or the outcome. A total story structure complexity score for each child was calculated by adding the scores from the two stories, leading to a maximum score of 18.
Twenty-five percent of the transcribed narrative samples were randomly selected and independently scored by two of the authors. The output was checked to identify instances of omissions or double coding. Collapsing across the IST and story structure scoring, the percentage agreement mean (and range) for the scoring of the narrative samples was 98.4% (95.9%–100.0%). Differences between ratings were discussed, changes were made where necessary, and adjusted ratings were used for the statistical analyses.
RESULTS
Statistical analyses were conducted to test for group differences in expressive vocabulary, sentence repetition, and verbal WM. Separate statistical analyses were then conducted on group performance in microstructure (i.e., lexical diversity and subordination) and macrostructure (i.e., story structure complexity +ToM-relate ISTs, and −ToM-related ISTs) in order to examine whether there were SLI and bilingualism effects specific to the two levels of narrative analysis (i.e., micro- and macrostructure). Finally, scores on both microstructure and macrostructure variables were included in stepwise backward elimination regression models with language impairment, bilingualism, language ability (average score on the expressive vocabulary and sentence repetition tests), and WM as the independent variables, in order to single out the factor(s) that best predicted retelling performance along the micro- and macrostructure parameters.
Language and WM measures
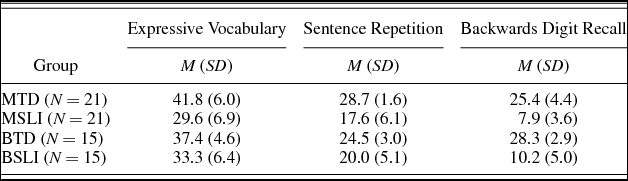
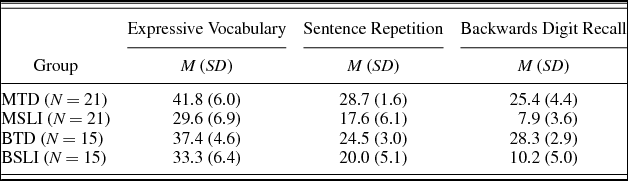
Table 2 provides descriptive statistics of the children in each group with regard to expressive vocabulary, sentence repetition, and backward digit recall scores. The composite language ability of each group was estimated using the scores of expressive vocabulary and sentence repetition.
Groups’ mean (standard deviation) raw scores on expressive vocabulary, sentence repetition, and backward digit recall test
Note: MTD, Monolingual typically developing children; MSLI, monolingual children with specific language impairment; BTD, bilingual TD children; BSLI, bilingual children with SLI.
One-way analyses of variance (ANOVAs) showed significant group effects for all three measures: F (3, 71) = 14.887, p < .001 for expressive vocabulary; F (3, 71) = 25.749, p < .001 for sentence repetition; and F (3, 71) = 117.070, p < .001 for backward digit recall. Subsequent post hoc Tukey tests on expressive vocabulary revealed that monolingual children with SLI scored significantly lower than TD monolingual children (p < .001), while TD bilingual children's scores did not differ significantly from bilingual children with SLI (p = .267). In addition, there was no significant difference between the two SLI groups (p = .292) or between the two TD groups (p = .162).
With respect to the sentence repetition task, post hoc tests revealed that both monolingual and bilingual children with SLI scored significantly lower than both TD groups (p < .001 for the difference between monolingual SLI and TD monolingual children, and p = .029 for the difference between bilingual SLI and TD bilingual children), while TD bilingual children scored significantly lower than TD monolingual children (p = .028). There was no significant difference between monolingual and bilingual children with SLI (p = .378). Finally, both TD groups were found to score significantly higher than both groups with SLI in the backward digit recall test (p < .001 for all differences), while there was no significant difference found either between TD monolingual and TD bilingual children (p = .159) or between the two SLI groups (p = .348).
Narrative measures
Narrative microstructure
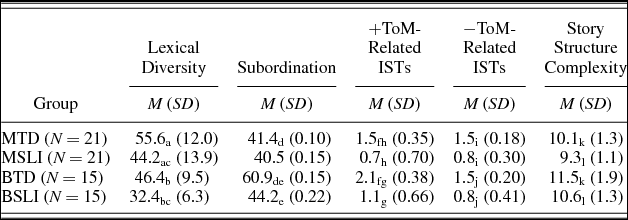
Table 3 provides descriptive statistics for the micro-structure measures of lexical diversity and subordination, (i.e., subordinate clauses/number of C-units) and macrostructure measures of +ToM-related ISTs, −ToM-related ISTs, and story structure complexity. For every dependent variable, we have only made group comparisons that would be most informative about the effects of language impairment and bilingualism on children's narrative performance. Therefore, only results of the comparisons between TD monolingual and monolingual children with SLI, TD bilingual and bilingual children with SLI, TD monolingual and bilingual children, and monolingual and bilingual children with SLI are reported. Superscripts next to each group's mean values in Table 3 were used to indicate significant between-group differences for each microstructure variable.
Groups’ mean (standard deviations) scores on microstructure and macrostructure variables

Note: Mean values that share a subscript are significantly different from one another at p ≤ .05. The direction of the difference is apparent from the mean values. Exact p values and a summary of group differences are provided in the text. ToM, Theory of mind; ISTs, internal state terms; MTD, monolingual typically developing children; MSLI, monolingual children with specific language impairment; BTD, bilingual TD children; BSLI, bilingual children with SLI.
Preliminary analyses revealed significant bivariate correlations between children's chronological age and socioeconomic status, and their scores in lexical diversity: r (72) = .374, p = .001, and r (72) = .314, p = .007, respectively. In addition, children's use of −ToM-related ISTs was found to be significantly correlated with age: r (72) = .604, p < .001. However, given that the assumption of homogeneity of regression slopes for analyses of covariance was only satisfied for lexical diversity, analysis of covariance was reserved for that variable only, while one-way ANOVAs were performed for the rest of the dependent variables. An α level of 0.05 was used in all analyses.
Results of analyses of microstructure revealed significant group differences for the lexical diversity measure: F (3, 71) = 8.992, p < .001, η2 = 0.287. When compared to TD bilingual children and monolingual children with SLI, bilingual children with SLI had significantly lower lexical diversity scores (p = .030 for the difference with TD bilinguals, and p = .05 for the difference with monolingual children with SLI). Monolingual children with SLI also exhibited significantly lower lexical diversity scores than did TD monolingual children (p = .049). In contrast, there was no significant difference between TD monolingual and TD bilingual children (p = .485). Age, the covariate, was found to be significant: F (1, 71) = 17.302, p < .001, η2 = 0.205. There was a trend that showed that lexical diversity scores across groups tended to increase with age.
With regard to children's use of subordination, the ANOVA analysis revealed a significant group effect, F (3, 71) = 6.113, p = .001, η2 = 0.212. Post hoc tests showed that the group effect could be attributed to the TD bilingual children outperforming both TD monolingual children (p = .003) and bilingual children with SLI (p = .028). There was no significant difference either between monolingual children with and without SLI (p = .998) or between monolingual and bilingual children with SLI (p = .894) in subordination.
Narrative macrostructure
Results on macrostructure revealed a significant group effect for the −ToM-related ISTs: F (3, 71) = 40.627, p < .001, η2 = 0.641. The group effect stemmed from both TD groups’ significantly higher rates of ISTs relative to both groups of children with SLI (p < .001 for all comparisons). There was no significant difference either between TD monolingual and bilingual children (p = .939) or between monolingual and bilingual children with SLI (p = .881) in −ToM-related ISTs. Further one-way ANOVA revealed a significant group effect for the use of +ToM-related ISTs, F (3, 71) = 17.818 p < .001, η2 = 0.440, stemming from TD bilingual children's significantly higher scores relative to TD monolingual children (p = .038) and bilingual children with SLI (p < .001); in addition, monolingual children with SLI were found to use significantly fewer words to describe the characters’ ToM states than did TD monolingual children (p < .001). There was no significant difference between monolingual and bilingual children with SLI (p = .212). There was also a significant effect for story structure: F (3, 71) = 7.035, p < .001, η2 = 0.236. Post hoc tests showed that monolingual children with SLI scored significantly lower than bilingual children with SLI (p = .049), while TD bilingual children were also found to score significantly higher than their TD monolingual peers (p = .033). There was no significant difference either between TD monolingual children and monolingual children with SLI (p = .323) or between TD bilingual and bilingual children with SLI (p = .393).
Narrative, language ability, and WM measures
Preliminary analyses revealed significant bivariate correlations between children's composite scores on measures of language ability, including expressive vocabulary and sentence repetition, and their performance on narrative micro- and macrostructure. More specifically, composite language ability correlated significantly with lexical diversity, r (72) = .501, p < .001; subordination, r (72) = .299, p = .011; +ToM-related ISTs, r (72) = .635, p < .001; −ToM-related ISTs, r (72) = .711, p < .001; and story structure, r (72) = .249, p = .035. Scores in WM were also found to correlate significantly with performance in lexical diversity, r (72) = .444, p < .001; subordination, r (72) = .392, p = .001; +ToM-related ISTs, r (72) = .674, p < .001; −ToM-related ISTs, r (72) = .778, p < .001; and story structure, r (72) = .332, p = .004. Finally, children's performance on specific measures of micro- and macrostructure was significantly correlated with diagnostic group indices; language impairment correlated significantly with lexical diversity, r (72) = −.366, p = .002; +ToM-related ISTs, r (72) = −.586, p < .001; −ToM-related ISTs, r (72) = −.798, p < .001; and story structure, r (72) = −.247, p = .036. By contrast, bilingualism was found to correlate significantly with lexical diversity, r (72) = .305, p = .009; subordination, r (72) = .335, p = .004; +ToM-related ISTs, r (72) = .307, p = .009; and story structure complexity, r (72) = .419, p < .001.
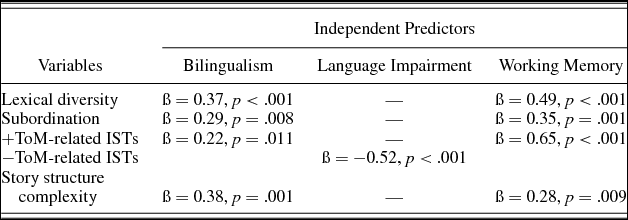
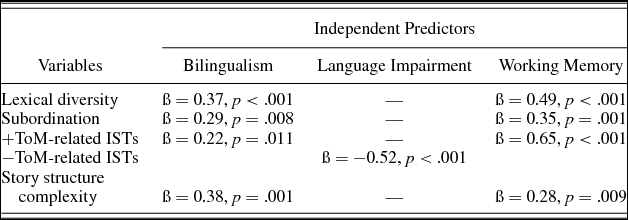
To explore which variables were independent predictors of children's performance in micro- and macrostructure, regression models with stepwise backward elimination were constructed. Predictors for each dependent measure were entered according to the significance of the correlational analyses (see Table 4). The results show that WM and bilingualism were the only significant predictor variables for lexical diversity, adjusted R 2 = .312, F (2, 69) = 17.087, p < .001, subordination, adjusted R 2 = .214, F (2, 69) = 10.637, p < .001, +ToM-related ISTs, adjusted R 2 = .489, F (2, 69) = 34.976, p < .001, and story structure, adjusted R 2 = .232, F (2, 69) = 11.741, p < .001. Finally, for −ToM-related ISTs, language impairment was the only significant predictor variable, adjusted R 2 = .644, F (1, 70) = 65.252, p < .001. For both microstructure variables (i.e., lexical diversity and subordination) and for +ToM-related ISTs, WM had a larger beta coefficient, indicating that its effect on the specific narrative measures was greater than bilingualism. In contrast, story structure complexity and the use of −ToM-related terms appeared to be affected mainly by bilingualism and language impairment, respectively.
Output of regression models (beta coefficients) on groups’ performance in microstructure and macrostructure variables
Note: ToM, Theory of mind; ISTs, internal state terms.
DISCUSSION
In this study, we set out to investigate the narrative performance of monolingual and bilingual children with a diagnosis of SLI along with the performance of age-matched TD monolingual and bilingual children. Previous work (e.g., Béfi-Lopes, Bento, & Perissinoto, Reference Béfi-Lopes, Bento and Perissinoto2008; Berman & Nir-Sagiv, Reference Berman and Nir-Sagiv2004; Pearce, James, & McCormack, Reference Pearce, James and McCormack2010) has shown that deficits in narrative microstructure are a robust indicator of SLI in children and associated with the emergence of language dysfunction markers related to SLI symptoms. However, the generalizability of the behavioral profile of monolingual children with SLI to bilingual children with SLI is underexplored. In the present study, we drew on the micro- and macrostructural properties of both monolingual and bilingual SLI children's narratives to test two predictions: (a) that low-level language deficits would affect the microstructural level of narratives in bilingual children with SLI and (b) that higher level macrostructural properties, including narrative organization and complexity, would be largely preserved because of domain-general cognitive mechanisms enhanced by bilingualism. Specifically, we predicted that the encoding of story structure in bilingual children with SLI would be relatively resistant to language impairment, when compared to monolingual children with SLI.
In line with our predictions, both SLI groups obtained lower scores than TD groups on lexical diversity. Of interest, the difference between SLI and language-unimpaired children in lexical diversity persisted even when controlling for chronological age, which implies that, though lexical diversity in children with SLI may be developing, the intrusion of language impairment effects influenced lexical diversity in monolingual and bilingual children's narrative production. The groups’ performance in subordination demonstrated different effects than lexical diversity, with monolingual children with SLI producing ratios of subordinate clauses similar to TD monolingual children. This suggests that the cognitive load impinged by the formation of discourse structure while renarrating a story was not high enough to affect the monolingual SLI group's performance. The finding that TD bilingual children tended to outperform TD monolingual children and bilingual children with SLI in the ratio of subordinate clauses further implies that the choice of the verbs produced by the TD bilingual group may have been boosted by syntactic priming effects created by cross-language interactions. That is, we suggest that TD children's first language might have boosted the production of subordinate clauses in their L2/Greek.
Comparisons between the groups’ ability to communicate both −ToM-related ISTs (i.e., linguistic and perceptual and physical terms) and +ToM-related ISTs (i.e., emotion and mental terms), in contrast, revealed significant differences between children with and without SLI. Both categories proved to be vulnerable for monolingual and bilingual children with SLI in comparison to TD groups. Our prediction that bilingualism would compensate for SLI-related declines in the use of ISTs was not borne out by the data. Underproduction of linguistic verbs in both SLI groups could be attributed to effects of language impairment; because linguistic verbs select complement clauses, they could be more affected in SLI groups’ narratives than other verbs (de Villiers, Reference de Villiers, Astington and Baird2005, Reference de Villiers2007; Owen & Leonard, Reference Owen and Leonard2006). Physiological and perceptual terms also appeared to be less accessible to children with SLI. The sensitivity of −ToM-related ISTs to the language impairment factor, as shown by the regression analyses, is compatible with our hypothesis of a deficit in SLI specific to microstructure; −ToM-related ISTs are susceptible to language impairment, as a consequence of being largely drawn from language itself. However, our findings show that WM was the strongest predictor of children's use of +ToM-related ISTs. This finding provides indirect support for the idea that tracking the affective and mental states of the characters while renarrating the event structure of the stories carries a WM load, and could put children with relatively poor WM at a disadvantage. Previous studies have shown that children with WM deficits had more difficulties in the acquisition and use of mental verbs than children with no WM limitations (Johnston, Miller, Curtiss, & Tallal, Reference Johnston, Miller, Curtiss and Tallal2001; Spanoudis & Natsopoulos, Reference Spanoudis and Natsopoulos2011).
In contrast, bilingualism in TD children seemed to confer an advantage in the significantly higher use of +ToM-related language, that is, emotion and mental state terms, compared to TD monolingual children and bilingual children with SLI. The particular finding suggests distinct patterns of +ToM-mediated language for TD bilingual and monolingual children that may relate to the cognitive consequences of being bilingual. It seems that affective and mental ISTs were, in general, more salient in the story presentation for the TD bilingual group. Emotion terms are a distinct category of words that is rather dissociable from the world of beliefs, in the sense that affective terms have been shown to follow a distinct developmental trajectory in language acquisition by emerging before cognitive terms (Baldimtsi et al., Reference Baldimtsi, Peristeri and Tsimpli2014). We hypothesize that TD bilingual children's sensitivity to cross-linguistic differences in the expression of emotion was more enhanced compared to other types of mental state terms (Chen & Yan, Reference Chen and Yan2011; Pavlenko, Reference Pavlenko2008). No such sensitivity was evident for −ToM-related lexical terms, implying that the bilingualism effect did not extend to −ToM-related language that consisted of perceptual, physiological, and linguistic verbs. Mentalizing abilities have been investigated, although not fully described in bilingual children (Farhadian, Abdullah, Mansor, Redzuan, & Kumar, Reference Farhadian, Abdullah, Mansor, Redzuan and Kumar2010; Goetz, Reference Goetz2003; Kovács, Reference Kovács2009). However, the perception and attribution of affect remains underexplored in bilingual populations with and without SLI and is a very interesting avenue for future investigation.
While the use of −ToM-related and +ToM-related ISTs, as well as lexical diversity, proved to be marked areas of difficulty for both monolingual and bilingual children with SLI, bilingualism appeared to compensate for SLI children's weaknesses at the macrostructural level. Both SLI and TD bilingual children's performance in story structure revealed a bilingualism effect, suggesting an advantage for bilingual children in developing and understanding the global coherence of the stories relative to monolingual children with and without SLI. Specifically, measures of story structure complexity differentiated TD bilingual children from their TD monolingual peers, while bilingual children with SLI were found to outperform monolingual children with SLI in story structure composite scores. We suggest that the bilingual advantage evident in the higher performance of bilingual children with SLI in story structure complexity is due to the abstractness of story macrostructure that is more tightly linked to discourse representation rather than to narrow linguistic features of the context. It is possible that bilingualism boosted the children's ability to abstract language-independent narrative properties, thus making narrative structure and coherence more accessible for bilingual children with SLI relative to their monolingual SLI peers.
To date, very few studies have investigated bilingual SLI children's narrative abilities. Iluz-Cohen and Walters (Reference Iluz-Cohen and Walters2012) have investigated TD and language-impaired bilingual preschool children's narrative production on a range of language measures. The specific study reports that bilingual children with and without language impairment were strikingly similar in terms of narrative macrostructure, but differed significantly in terms of their performance on a range of microstructure variables, including lexical and morphosyntactic measures. In a recent longitudinal study, Squires et al. (Reference Squires, Lugo-Neris, Peña, Bedore, Bohman and Gillam2014) have tested kindergarten- to first-grade TD and language-impaired bilingual children on retelling wordless picture books in both their languages. Typically developing children were found to outperform language-impaired children on both macro- and microstructure measures at both points in time (i.e., kindergarten and first grade). We claim that the bilingualism effects on SLI children's performance might have been stronger in the present study due to the age of the participants; at age 9, most bilingual children with SLI had the chance to gain sufficient exposure to both their L1 and their L2, which potentially permitted the establishment of stronger interlanguage connections. By consequence, they showed greater ease to abstract shared properties of narrative macrostructure across their languages. A crucial point is that our findings that the advantages conferred by bilingualism were mostly relevant to the groups’ performance at the story structure level are further supported by the regression analyses. While WM appeared to be the strongest predictor of children's performance in microstructure, bilingualism was found to have the most significant contributions to story structure complexity that stands for abstract, higher order aspects of narration.
Conclusions
Studies on the narrative development of monolingual children with SLI have largely contributed to better understanding how language impairment affects language processes along specific properties of narrative discourse. In particular, their narrative output has been described as being little informative and poorly organized. A new challenge has arisen regarding the use of narrative tools in language assessment and diagnosis of deficits; when children are bilingual, the effects of bilingualism and language impairment must be differentiated.
In the present study, we aimed at identifying clinical markers of language impairment in the narrative performance of a group of 5- to 11-year-old bilingual children with SLI that were age-matched with three groups of monolingual children with SLI, TD monolingual, and bilingual children. The measurements were able to highlight significant SLI effects on microstructure, such as lexical diversity, as well as on the frequency of use of ISTs used to integrate and communicate the MCs’ beliefs, needs, and mental and affective states. Bilingualism effects, in contrast, were revealed in the groups’ performance on macrostructure, with bilingual children with SLI scoring at equal levels, and even outperforming, monolingual children with SLI in story structure complexity.
The overall results show that SLI effects were more pronounced in microstructure presumably due to their language-specific nature. In contrast, the study has provided evidence of a positive impact of bilingualism on the production of narratives on macrostructure, possibly reflecting abstract structures shared between the two languages. Further investigations of bilingual SLI children's functions of executive abilities, and interactions of executive functions and linguistic abilities on the text level, may shed more light on the nature of the distinct compensatory mechanisms allowing for the preservation of narrative abilities at the macrostructure level in bilingual children with SLI.