1. Introduction
Evaporating sessile droplets are ubiquitous in natural and technological processes, including inkjet printing and biological systems, among others, and play a crucial role in a wide range of interfacial phenomena (Deegan et al. Reference Deegan, Bakajin, Dupont, Huber, Nagel and Witten1997; Lohse & Zhang Reference Lohse and Zhang2020; Masoud et al. Reference Masoud, Howell and Stone2021; Wilson & D’Ambrosio Reference Wilson and D’Ambrosio2023). When multiple droplets evaporate in proximity, the vapour fields overlap, leading to spatially heterogeneous vapour concentration distributions around neighbouring droplets, which generate local surface tension gradients. Such gradients can induce droplet motion and collective dynamics, yet a quantitative description linking experimentally observed trajectories to the underlying driving mechanisms remains an open challenge.
A central mechanism underlying vapour-mediated droplet motion is the emergence of surface tension gradients along the droplet interface. In binary or miscible droplets, local variations in vapour concentration modify the interfacial composition distribution through vapour–liquid equilibrium, generating Marangoni stresses that propel the droplet (Cira et al. Reference Cira, Benusiglio and Prakash2015; Malinowski et al. Reference Malinowski, Parkin and Volpe2020). Conversely, for two adjacent droplets of different pure liquids, directional motion can arise from vapour adsorption onto a thin precursor film or the liquid–vapour interface of bulk liquid, inducing local surface tension variations (Bangham & Saweris Reference Bangham and Saweris1938; Man & Doi Reference Man and Doi2017). In both cases, the net driving force can be effectively described by the spatial gradient of a scalar field – vapour concentration or temperature – coupled to surface stress along the interface.
Bangham & Saweris (Reference Bangham and Saweris1938) first observed that vapour-mediated interactions can be either attractive or repulsive. A droplet with lower surface tension is drawn towards the vapour of a higher-surface-tension droplet, while a droplet with higher surface tension is repelled. These interactions depend on relative composition or local humidity gradients. Subsequent studies extended these ideas to droplets on substrates or in capillary channels, considering both pure liquids and binary mixtures (Cira et al. Reference Cira, Benusiglio and Prakash2015; Sadafi et al. Reference Sadafi, Dehaeck, blacknikov and Colinet2019). Building on this foundation, Zhao et al. (Reference Zhao, Orejon, Sefiane and Shanahan2025) proposed a theoretical model combining vapour adsorption and evaporation effects, successfully predicting conditions for motion reversal in binary droplets and providing a unified description of pure and binary systems. While previous models capture the general effects of vapour gradients on droplet motion, they rarely establish a direct, experimentally accessible connection between theory and observed droplet trajectories, motivating the present study.
In addition to vapour-mediated surface tension gradients driving droplet motion, the apparent contact angle is also sensitive to local humidity. In multicomponent evaporating droplets, preferential evaporation near the contact line generates surface tension gradients, inducing inward Marangoni flows and promoting droplet contraction. This effect has been analysed using lubrication theory and numerical simulations, revealing power-law dependencies of the apparent contact angle on relative humidity (Diddens Reference Diddens2017; Diddens et al. Reference Diddens, Kuerten, Van der Geld and Wijshoff2017a
,
Reference Diddens, Tan, Lv, Versluis, Kuerten, Zhang and Lohseb
; Karpitschka et al. Reference Karpitschka, Liebig and Riegler2017; Williams et al. Reference Williams, Karapetsas, Mamalis, Sefiane, Matar and Valluri2021; Wu et al. Reference Wu, Doi and Man2021; Gelderblom et al. Reference Gelderblom, Diddens and Marin2022), which provide a quantitative link between microscopic dynamics and measurable droplet shapes. For instance, Cira et al. (Reference Cira, Benusiglio and Prakash2015) heuristically reported a linear dependence of
 $\cos \theta$
on
 $\phi$
, whereas Karpitschka et al. (Reference Karpitschka, Liebig and Riegler2017) derived
 $\theta \sim (\phi _{\textit{eq}}-\phi )^{1/3}$
using a lubrication-theory approach. The more recent model (Wu et al. Reference Wu, Doi and Man2021) incorporating Marangoni contraction predicts
 $\theta \sim (\phi _{\textit{eq}}-\phi )^{1/2}$
, in qualitative agreement with experimental results from Cira et al. (Reference Cira, Benusiglio and Prakash2015). Furthermore, vapour-driven solutal Marangoni flows have been shown to undergo directional transitions when the local vapour concentration crosses the vapour–liquid equilibrium associated with droplet composition, emphasizing the role of local thermodynamic imbalances at the contact line (Ryu et al. Reference Ryu, Diddens, Lohse and Kim2025).
These studies highlight the intricate coupling between evaporation, composition, surface tension and hydrodynamic flow near the contact line, showing that droplet motion is influenced by both quasistatic thermodynamic effects and dynamically sustained Marangoni stresses at the microscopic scale. Consequently, observed dependencies of the apparent contact angle on humidity can often be interpreted consistently from either a quasiequilibrium perspective or a dynamical Marangoni-flow framework. This intrinsic coupling motivates the use of effective or calibrated relations between vapour conditions and interfacial stresses, allowing a practical modelling framework without specifying the dominant microscopic mechanism.
In the present study, we investigate pairs of propylene glycol (PG)–water sessile droplets, i.e. droplets resting on solid substrates, in which solutal Marangoni stresses dominate under ambient conditions. Under quasistatic dynamics, the relative motion of droplet pairs can be represented by a simple cubic relation between the distance and time,
 $d^3 - (R_1+R_2)^3 \propto t$
, where
 $d=L+R_1+R_2$
is the centre-to-centre distance,
 $L$
the edge-to-edge separation,
 $R_1$
and
 $R_2$
the mean spreading radii of a pair. Compared with previous work, the present study extends the understanding of vapour-mediated droplet interactions in several distinct aspects. First, by establishing an effective calibration between local vapour conditions and contact-line response, we provide an experimentally accessible link between humidity gradients and the inverse-square force that governs droplet motion. Then, we examine the robustness of the inverse-square law between droplets of identical or unequal size and composition by showing that the corresponding cubic kinematic relation consistently captures the relative motion across all cases. Finally, we compare our results with published data for single-component droplets and floating droplets driven by thermocapillary effects, indicating that the inverse-square force scaling may represent a general feature of droplet interactions mediated by scalar-field gradients. These findings provide a practical and experimentally accessible framework for analysing evaporating droplet interactions at the level of droplet pairs, and establish a quantitative basis for linking droplet kinematics to the underlying physical mechanisms.
2. Experimental methodology
The PG (
 ${\geqslant}99.5\,\%$
) was obtained from Sigma–Aldrich. Deionized water (resistivity
 ${\gt } 18.2$
M
 $\Omega$
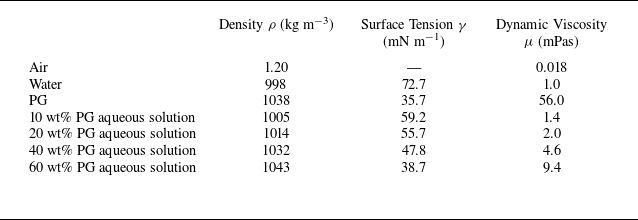
cm) was produced from a Milli-Q purification system. Single-side-polished, p-type silicon wafers with a thickness of 1 mm were purchased from UniversityWafer, Inc. Aqueous PG solutions were prepared to give the desired mass fractions, and the relevant physical properties of the liquids used in the experiments are summarized in table 1.
Properties of the liquids used in the experiments. All values were measured at 20
 $^{\circ }$
C.

Table 1. Long description
A table comparing properties of different liquids used in experiments. The table has six rows and three columns. The column headers are Density (kg/m^3), Surface Tension (mN/m), and Dynamic Viscosity (mPas). The row labels are Air, Water, PG, 10 wt% PG aqueous solution, 20 wt% PG aqueous solution, 40 wt% PG aqueous solution, and 60 wt% PG aqueous solution. Row 1: Air, Density 1.20, Surface Tension not applicable, Dynamic Viscosity 0.018. Row 2: Water, Density 998, Surface Tension 72.7, Dynamic Viscosity 1.0. Row 3: PG, Density 1038, Surface Tension 35.7, Dynamic Viscosity 56.0. Row 4: 10 wt% PG aqueous solution, Density 1005, Surface Tension 59.2, Dynamic Viscosity 1.4. Row 5: 20 wt% PG aqueous solution, Density 1014, Surface Tension 55.7, Dynamic Viscosity 2.0. Row 6: 40 wt% PG aqueous solution, Density 1032, Surface Tension 47.8, Dynamic Viscosity 4.6. Row 7: 60 wt% PG aqueous solution, Density 1043, Surface Tension 38.7, Dynamic Viscosity 9.4.
In the experiments, two droplets made of the same PG aqueous solution were gently deposited onto a pristine, oxygen-plasma-cleaned silicon wafer. All droplets were freshly prepared immediately before deposition to ensure uniform composition, and were deposited before any noticeable evaporation occurred. Their interactions were recorded with a high-resolution digital camera (8K RED DSMC2, RED Digital Cinema, LLC.). To control the ambient humidity and temperature, experiments were carried out in an environmental chamber (5503-1-11-100-1741, Electro-Tech Systems, Inc.). The droplet configuration is shown in figure 1, and a sketch of the experimental set-up is shown in figure 2(b). The tested parameters include droplet volumes
 $ \Omega$
ranging from 0.07 to 0.80 μL and ambient relative humidity
 $\phi _\infty$
ranging from 19.9 % to 81.1 %.
3. Results and discussion
3.1. Droplet movement
When a droplet consisting of miscible liquids is located on a superhydrophilic substrate, it has been shown that the interplay among Marangoni flow, capillary flow, diffusive transport and evaporation will lead to a droplet profile with an apparent non-zero contact angle, even though each of the liquid components fully wets the substrate (Cira et al. Reference Cira, Benusiglio and Prakash2015; Karpitschka et al. Reference Karpitschka, Liebig and Riegler2017; Lohse & Zhang Reference Lohse and Zhang2020; Hack et al. Reference Hack, Kwiecinski, Ramírez-Soto, Segers, Karpitschka, Kooij and Snoeijer2021). This phenomenon is also observed in our experiments for 10 wt % PG droplets.
Attraction between two binary droplets. (a) Schematic illustration introducing the ‘source’ and ‘target’ droplets used for analysis. The target droplet is exposed to a non-uniform vapour concentration field generated by a neighbouring ‘source’ droplet. For clarity, only the vapour field produced by the ‘source’ droplet is shown. The source-facing side of the target droplet is subject to a higher local vapour concentration than the opposite side, providing the physical basis for the vapour-mediated interaction. (b) Schematic showing the change in surface tension
 $\gamma$
along the periphery of the ’target’ drop, arising from local vapour–liquid equilibrium within the precursor film. The inset:
 $\gamma _d$
the surface tension of the bulk droplet liquid;
 $\gamma$
the surface tension in the precursor liquid film;
 $\theta$
the contact angle.

Figure 1. Long description
A diagram of the attraction between two binary droplets. Panel A: A schematic illustration introducing the source and target droplets used for analysis. The target droplet is exposed to a non-uniform vapour concentration field generated by a neighbouring source droplet. For clarity, only the vapour field produced by the source droplet is shown. The source-facing side of the target droplet is subject to a higher local vapour concentration than the opposite side, providing the physical basis for the vapour-mediated interaction. Panel B: A schematic showing the change in surface tension along the periphery of the target drop, arising from local vapour-liquid equilibrium within the precursor film. The inset shows the surface tension of the bulk droplet liquid, the surface tension in the precursor liquid film, and the contact angle.
Attraction between two binary droplets. (a) Top view (Supplementary movie 1) showing attraction of two 10 wt % PG sessile droplets of the same size on a hydrophilic silicon substrate, for
 $R = 1.55$
mm,
 $\phi _\infty =$
56.9 % and room temperature of 20
 $^{\circ }$
C. Sequence of images spaced by 1.67 s. Scale bar is 2 mm. (b) Sketch of the experimental configuration, showing the capillary microtube used to pinch off the droplet. (c) Mean distance between droplets as a function of time before contact for two moving 10 wt % PG droplets. Here
 $R$
=
 $1.37 \pm 0.02$
mm and
 $\phi _\infty$
=
 $51.3\,\% \pm 2.0$
%. The error bars represent the standard deviation of 10 experiments.

Figure 2. Long description
The image contains three elements: one photo, one diagram, and one graph. The purpose of combining these images is to illustrate the attraction between two binary droplets through experimental observation and data analysis. The primary focus is on the experimental setup and the resulting data from the study. The photo and diagram are side-by-side, while the graph is separate. Panel A: The photo shows a sequence of images depicting the attraction of two droplets on a hydrophilic silicon substrate. The images are spaced by 1.67 seconds. The droplets are labeled with R and L, indicating their positions. Panel B: The diagram illustrates the experimental configuration, including a light source, diffuser, half mirror, capillary tube, droplet, silicon wafer, and environmental chamber. The light source illuminates the droplets, and the camera captures the images. Panel C: The graph is a scatter plot showing the mean distance between droplets as a function of time before contact. The x-axis is labeled with tau - t (s), and the y-axis is labeled with L (mm). The data points represent the mean distance, and the error bars indicate the standard deviation of 10 experiments.
A representative experiment is illustrated in figure 2(a) (corresponding to Supplementary movie 1), where two identical 10 wt % PG droplets, initially separated by an edge-to-edge distance
 $L$
, gradually migrate towards each other and eventually coalesce. The radius is
 $R = 1.55 \, \mathrm{mm}$
and the ambient relative humidity
 $\phi _\infty$
is 56.9 %. Figure 2(c) shows the repeatability of the experiment. During the experiments, the droplets have a mean spreading radius
 $R$
= 1.37 mm, and the surrounding relative humidity is
 $\phi _\infty$
= 51.3 %. This case was repeated at least 10 times, and error bars represent standard deviations across repetitions.
3.2. Droplet pair interaction
To rationalize the experimentally observed dynamics, we revisit the fundamental governing equations and boundary conditions governing the coupled vapour–liquid system. Our objective is to derive a quantitative description of the droplet evolution directly from the governing equations of continuum hydrodynamics. To render the problem analytically tractable while retaining the essential physics, we adopt the following assumptions. (i) The source droplet is treated as an isolated evaporating droplet, and the influence of the target droplet on the evaporation of the source droplet is neglected. The vapour concentration field in the surrounding gas phase is quasisteady and diffusion-dominated, and therefore satisfies Laplace’s equation. (ii) Vapour-induced variations in surface tension are localized near the contact line, where a nanometric precursor film exists. These variations give rise to an effective driving force acting at the contact line, while the surface tension of the droplet bulk remains uniform. (iii) The flow inside each droplet is quasistatic and inertia-free, and is governed by the Stokes equations. This modelling framework follows that introduced by Cira et al. (Reference Cira, Benusiglio and Prakash2015). The schematic illustration is shown in figure 1.
Then, we estimate the relevant dimensionless numbers characterizing the droplet dynamics. Unless otherwise specified, the characteristic droplet radius is taken as
 $R = 1$
mm, consistent with the experimental range
 $R \in [0.8,1.8]$
mm. The characteristic migration velocity is estimated from the measured trajectories as
 $U \sim 10^{-4}\, \mathrm{m \,s^{-1}}$
. All material properties are taken from table 1 and correspond to
 $T=293$
K and
 $p=1$
atm. The Reynolds number,
 $Re = \rho U R/{\mu }$
is estimated to be
 $Re \sim O( 10^{-2}) \ll 1$
for all PG aqueous solutions considered. This indicates that inertial effects are negligible, and the internal flow within the droplets can be well described by the Stokes equations. The capillary number,
 $Ca = {\mu U}/{\gamma }$
is found to be
 $O(10^{-6})$
across the experimental parameter space. This indicates that viscous stresses are far too weak to induce appreciable deformation of the liquid–air interface. Accordingly, the droplet shape may be regarded as quasistatic and governed by instantaneous capillary equilibrium. The relative importance of gravity is quantified by the Bond number
 $Bo = {\rho g R^2}/{\gamma }$
, which remains
 $Bo \sim 0.1$
for the droplets studied here. This implies that gravitational effects are secondary compared with surface tension at the droplet scale considered.
Taken together, these estimates delineate a consistent asymptotic regime in which interfacial dynamics are governed by capillarity, while inertial effects are negligible compared with viscous dissipation. This provides the basis for the droplet dynamics model developed below.
3.2.1. Governing equations and force–velocity relation
We develop a theoretical framework to relate the translational motion of an evaporating sessile droplet to the balance of capillary force arising under vapour-mediated interactions and viscous drag force. The analysis is restricted to the quasistatic regime relevant to the present experiments, in which inertial effects are negligible and the droplet shape adjusts rapidly compared with the time scale of translation. Under these conditions, the flow inside the droplet is governed by incompressible Stokes equations. The velocity field
 $\boldsymbol{u}(\boldsymbol{x})$
and pressure
 $p(\boldsymbol{x})$
satisfy
 $\boldsymbol{\nabla }\boldsymbol{\cdot }\boldsymbol{\sigma } = \boldsymbol{0}$
and
 $\boldsymbol{\nabla }\boldsymbol{\cdot }\boldsymbol{u} = 0$
, where the Newtonian stress tensor is given by
 $\boldsymbol{\sigma } = -p \boldsymbol{I} + \mu [ \boldsymbol{\nabla }\boldsymbol{u} + (\boldsymbol{\nabla }\boldsymbol{u})^{T} ]$
.
The liquid–solid interface is modelled using a Navier-slip boundary condition,
 $\boldsymbol{u}_s = l_s {\boldsymbol{\tau }_s}/{\mu }$
where
 $l_s$
is the slip length and
 $\boldsymbol{\tau }_s$
is the tangential stress at the liquid–solid interface
 $S_{ls}$
. On the liquid–air interface
 $S_{lg}$
, the normal stress is balanced by capillarity
 $\boldsymbol{\sigma } \boldsymbol{\cdot }\boldsymbol{n} = \gamma _d \kappa \boldsymbol{n}$
, where
 $\boldsymbol{n}$
is the outward unit normal,
 $\gamma _d$
is the surface tension of the bulk droplet and
 $\kappa$
is the mean curvature. Numerical simulations of evaporating binary droplets show that surface tension gradients are strongly localized within a narrow region near the contact line (Karpitschka et al. Reference Karpitschka, Liebig and Riegler2017; Diddens et al. Reference Diddens, Kuerten, Van der Geld and Wijshoff2017a
; Dekker et al. Reference Dekker, Rocha, Lohse and Diddens2026). In this region, the surface tension gradient follows a power law dependence on the distance
 $s$
to the contact line, scaling as
 $\sim s^{-3/2}$
(Ramírez-Soto & Karpitschka Reference Ramírez-Soto and Karpitschka2022). Following previous analyses of vapour-mediated droplet interactions, the system is described using a simplified picture of a droplet consisting of a bulk phase with a single, spatially uniform composition, surrounded by a nanometric precursor film whose composition may vary along the substrate. Within the precursor film, local phase equilibrium at the liquid–air interface constrains the liquid composition to adjust to the vapour partial pressure above the surface. Spatial variations in vapour concentration therefore alter the local vapour partial pressure, which shifts the equilibrium liquid composition and hence the surface tension within the film (Wang et al. Reference Wang, Karapetsas, Valluri, Sefiane, Williams and Takata2021; Chao et al. Reference Chao, Ramírez-Soto, Bahr and Karpitschka2022; Zhao et al. Reference Zhao, Orejon, Sefiane and Shanahan2025). Because the surface stresses are confined to a region small compared with the droplet size, their integrated effect at macroscopic scales can be effectively represented by a line force acting at the apparent contact line, consistent with Cira et al. (Reference Cira, Benusiglio and Prakash2015) and Zhao et al. (Reference Zhao, Orejon, Sefiane and Shanahan2025). When this effective line force becomes azimuthally unbalanced, a net driving force arises and the droplet undergoes motion.
To relate the translational velocity of the droplet to this net force, we employ the Lorentz reciprocal theorem for incompressible Stokes flows (Happel & Brenner Reference Happel and Brenner2012; Masoud & Stone Reference Masoud and Stone2014, Reference Masoud and Stone2019). We define an auxiliary flow
 $(\hat {\boldsymbol{u}},\hat {\boldsymbol{\sigma }})$
in the same instantaneous droplet geometry, corresponding to the rigid-body translation of the droplet with prescribed velocity
 $\hat {\boldsymbol{U}}$
along the substrate, sharing the same direction with the actual droplet motion. The boundary conditions are chosen to satisfy the following principles: on the liquid–solid interface
 $S_{ls}$
, the auxiliary flow obeys the same Navier-slip condition as the actual flow, namely
 $\hat {\boldsymbol{u}}_s = l_s {\hat {\boldsymbol{\tau }}_s}/{\mu }$
, to ensure that stress integrals at the contact line converge; on the liquid–air interface
 $S_{lg}$
, the auxiliary velocity is prescribed as a rigid-body translation,
 $\hat {\boldsymbol{u}} = \hat {\boldsymbol{U}}$
, thereby isolating the translational degree of freedom in the Lorentz reciprocal theorem analysis; finally, the auxiliary flow vanishes in the far field,
 $\hat {\boldsymbol{u}} \to 0$
as
 $ r \to \infty$
, so that the surface integrals form a closed system.
In the auxiliary problem, the surface tension is uniform and the interface shape is held fixed. This choice is justified by the quasistatic nature of the dynamics, for which shape relaxation occurs on time scales much shorter than translational motion. The auxiliary problem therefore isolates the translational degree of freedom while preserving the hydrodynamic boundary conditions.
The Lorentz reciprocal theorem states that
 \begin{align} \int _S \hat {\boldsymbol{u}} \boldsymbol{\cdot }\left ( \boldsymbol{\sigma } \boldsymbol{\cdot }\boldsymbol{n} \right ) \, \mathrm{d}S = \int _S \boldsymbol{u} \boldsymbol{\cdot }\left ( \hat {\boldsymbol{\sigma }} \boldsymbol{\cdot }\boldsymbol{n} \right ) \, \mathrm{d}S, \end{align}
where
 $S=S_{lg}\cup S_{ls}$
is a closed surface enclosing the fluid domain. On the liquid–air interface
 $S_{lg}$
,
 $\int _{S_{lg}} \boldsymbol{u} \boldsymbol{\cdot }( \hat {\boldsymbol{\sigma }} \boldsymbol{\cdot }\boldsymbol{n} ) \, \mathrm{d}S=\boldsymbol{U}\boldsymbol{\cdot }\int _{S_{lg}} ( \hat {\boldsymbol{\sigma }} \boldsymbol{\cdot }\boldsymbol{n} ) \, \mathrm{d}S$
, where
 $\boldsymbol{U}$
represents the translational velocity of the droplet’s centre of mass. On the liquid–solid interface
 $S_{ls}$
, both
 $\boldsymbol{u}$
and
 $\hat {\boldsymbol{u}}$
satisfy the same Navier-slip condition, so contributions to the surface integrals are balanced,
 $\int _{S_{ls}} \boldsymbol{u} \boldsymbol{\cdot }\hat {\tau }_s \text{d}S = \int _{S_{ls}} \boldsymbol{u} \boldsymbol{\cdot }({\mu } \hat {\boldsymbol{u}}/{l_s} ) \text{d}S=\int _{S_{ls}} \hat {\boldsymbol{u}} \boldsymbol{\cdot }\tau _s \text{d}S$
.
The integral reduces to
 \begin{align} \hat {\boldsymbol{U}} \boldsymbol{\cdot }\boldsymbol{F} = \boldsymbol{U} \boldsymbol{\cdot }\hat {\boldsymbol{F}}_d, \end{align}
where
 $\boldsymbol{F} = \int _{S_{lg}} (\boldsymbol{\sigma } \boldsymbol{\cdot }\boldsymbol{n}) \text{d}S=\int _C \gamma \boldsymbol{t} \, \text{d}l$
is the net capillary driving force concentrated along the contact line,
 $\boldsymbol{t}$
being the unit vector tangent to the substrate.
Under the small contact angle condition, the velocity of the auxiliary flow can be described by lubrication function (Snoeijer & Andreotti Reference Snoeijer and Andreotti2013),
 \begin{align} \boldsymbol{\nabla }\boldsymbol{\cdot }\big ( h^{3}\boldsymbol{\nabla }\hat {p} \big ) = 6\mu \boldsymbol{\hat {U}} \boldsymbol{\cdot }\boldsymbol{\nabla }h. \end{align}
The total hydrodynamic resistance
 $\hat {\boldsymbol{F}}_d$
in the auxiliary field is dominated by logarithmic singularity of the wetting perimeter. This yields the characteristic scaling,
 $\hat {{F}}_d = \xi \mu R \hat {U}l_n/\theta$
. Equation (3.2) provides a rigorous connection between droplet velocity and capillary forcing, independent of the detailed internal flow structure, yields
 \begin{align} \frac {\xi R \mu l_n}{\theta }\boldsymbol{U}= \int _C \gamma \boldsymbol{t} \, \text{d}l, \end{align}
where
 $l_n$
denotes the logarithmic cutoff factor arising from the viscous stress singularity near the contact line, and
 $\xi$
is a dimensionless coefficient of order unity reflecting details of the microscopic flow structure. Equation (3.4) can be rewritten as
 $F_d=F$
, where the functional form of drag force reads
 $F_d = \xi \mu R Ul_n/\theta$
. The droplet velocity is determined once the effective surface tension in the contact-line region is related to the ambient vapour distribution, which is addressed in the following sections.
3.2.2. Humidity distribution around sessile droplets
When analysing the motion of a target droplet, we take the vapour concentration field imposed by a neighbouring ‘source’ droplet as the relevant driving field. Evaporation of a sessile droplet under ambient conditions is governed by diffusion in the surrounding gas phase (Picknett & Bexon Reference Picknett and Bexon1977; Deegan et al. Reference Deegan, Bakajin, Dupont, Huber, Nagel and Witten1997, Reference Deegan, Bakajin, Dupont, Huber, Nagel and Witten2000; Hu & Larson Reference Hu and Larson2002), so the local vapour concentration
 $\phi$
satisfies
 \begin{align} \frac {\partial \phi }{\partial t}=D_v {\nabla} ^2\phi , \end{align}
where
 $D_v$
is the diffusion coefficient of water vapour in air. In the present water–PG system, evaporation is dominated by water because the saturation vapour pressure of water (
 $p_{\textit{sat}}^{\mathit{H_2O}}\approx 2.3\,\mathrm{kPa}$
) is orders of magnitude larger than that of PG (
 $p_{\textit{sat}}^{\textit{PG}}\approx 10\,\mathrm{Pa}$
) under ambient conditions (Stull Reference Stull2002; Wagner & Pruß Reference Wagner and Pruß2002). Although vapour-phase PG adsorption can affect droplet motion in sufficiently dilute PG solutions (Zhao et al. Reference Zhao, Orejon, Sefiane and Shanahan2025), the concentrations considered here lie outside that regime (figure S6 in the Supplementary material). We therefore neglect PG vapour adsorption and treat the vapour phase as a water–air mixture, with PG taken as effectively non-volatile. For simplicity, we express the vapour field in terms of the relative humidity
 $\phi (r)$
, where
 $r$
is the distance from the centre of the ‘source’ droplet. The relevant vapour Péclet number is
 $ \textit{Pe}_v= \textit{UR}/D_v$
. Using
 $D_v=2.6\times 10^{-5}\,\mathrm{m^2\,s^{-1}}$
at
 $T=293\,\mathrm{K}$
and
 $p=1\,\mathrm{atm}$
(Hu & Larson Reference Hu and Larson2002), we obtain
 $ \textit{Pe}_v\sim O(10^{-3})$
, indicating diffusion-dominated and quasisteady transport. The humidity field therefore satisfies
 \begin{align} \boldsymbol{\nabla} ^2\phi =0, \end{align}
which forms the basis of the vapour-field analysis in this study.
The droplets in the experiments are sessile spherical caps of contact angle
 $\theta$
on a solid substrate. Since the vapour field around an evaporating sessile droplet depends on geometric confinement (Benusiglio et al. Reference Benusiglio, Cira, Lai and Prakash2017), the chamber dimensions are chosen to be at least two orders of magnitude larger than the droplet size, and the droplets are placed sufficiently far from the walls so that confinement effects are negligible. Following the treatment by Cira et al., the droplets considered here are predominantly composed of water (10 wt % PG by volume, corresponding to 2.6 % PG in mole fraction), and the water vapour at the liquid–air interface is therefore assumed to be locally saturated (Raoult Reference Raoult1887; Saxena & Hildemann Reference Saxena and Hildemann1997; Cira et al. Reference Cira, Benusiglio and Prakash2015; Zhao et al. Reference Zhao, Orejon, Sefiane and Shanahan2025). A no-flux condition is imposed on the dry substrate outside the droplet footprint, and the ambient humidity
 $\phi _\infty$
is recovered in the far field. Under these boundary conditions, Laplace’s equation admits an analytical solution, derived in toroidal coordinates (Picknett & Bexon Reference Picknett and Bexon1977; Hu & Larson Reference Hu and Larson2002),
 \begin{align} &\frac {\phi -\phi _\infty }{1-\phi _\infty }=\sqrt {2\cosh \alpha -2\cos \beta }\notag \\[5pt]& \qquad \times \int _0^\infty \frac {\cosh {(\theta \omega )}}{\cosh {(\pi \omega )}} \frac {\cosh {[(2\pi -\beta )\omega ]}}{\cosh {[(\pi -\theta )\omega ]}}P_{-1/2+i\pi }(\cosh \alpha )\text{d}\omega , \end{align}
where
 $\alpha$
and
 $\beta$
are toroidal coordinates related to the cylindrical coordinates
 $(r,z)$
, and
 $P_{-1/2+i\pi }(\cosh \alpha )$
denotes the Legendre function of the first kind.
Of particular relevance for droplet–droplet interactions is the vapour concentration distribution along the substrate outside the droplet footprint. Since the vapour concentration converges within the small experimental contact angles ranging
 $ 5^\circ \leqslant \theta \leqslant 15^\circ$
, the analytical solution can be reasonably simplified and reduced to the classical problem of diffusion from a circular disk into a half-space. Along the substrate (
 $z = 0$
), the vapour concentration exhibits an inverse-distance dependence on the horizontal distance
 $r$
,
 \begin{align} \frac {\phi - \phi _\infty }{1 - \phi _\infty } = \frac {1}{2} - \frac {1}{\pi } \arctan {\left [ \frac {r^2 - 2R^2}{2R\sqrt {r^2-R^2}} \right ]},\, r \gt R , \\[-28pt] \nonumber \end{align}
 \begin{align} \frac {\partial \phi }{\partial r}\bigg |_{d} = - (1-\phi _\infty ) \,\frac {2}{\pi d}\, \frac {R}{\sqrt {d^2-R^2}} = -(1-\phi _\infty ) \,\frac {\lambda (d)R}{d^2}, \\[0pt] \nonumber \end{align}
where
 $d=L+2R \in [2R,+\infty )$
is the centre-to-centre distance of two droplets, and
 $\lambda (d) = 2/( \pi \sqrt {1-R^2/d^2})$
. Notably,
 $\lambda (d)$
is a slowly varying, order-unity function of the separation, bounded between its near-field and far-field limits,
 $\lambda (2R) = {4}/{(\sqrt {3}\pi )}, \lambda (\infty ) = {2}/{\pi }$
. In the following analysis, we take
 $\lambda =\lambda (2R) \simeq 0.735$
, and the humidity distribution can be expressed as
 \begin{align} \phi (r) = \phi _\infty + \lambda (1-\phi _\infty )\frac {R}{r}. \end{align}
In this representation, geometric effects are fully absorbed into
 $\lambda$
, while the humidity field retains a universal functional form (figure 3
a).
To assess the validity of this asymptotic representation, we performed finite-element simulations of Laplace’s equation. The numerical results confirm that, for
 $\theta \lesssim 30^\circ$
, the vapour concentration profiles along the substrate collapse onto a nearly universal curve that is weakly dependent on the contact angle (figure S1 in the Supplementary material), thereby supporting the validity of (3.10) over the experimentally relevant range.
3.2.3. Dependence of contact angle on humidity
To quantify the effect of ambient humidity on the effective surface tension at the contact line, we consider a sessile droplet in a spatially uniform environment with prescribed relative humidity
 $\phi$
. In this setting, the droplet remains stationary and the humidity field is homogeneous, the variations in the surface tension are reflected in changes in the apparent contact angle
 $\theta$
, as given by the horizontal force balance at the intersection of the thin film and the bulk droplet,
 $\gamma = \gamma _d \cos \theta$
. The distribution of
 $\phi$
produces a gradient in
 $\gamma$
, the surface tension of the precursor liquid, and subsequently the driving force for droplet motion (Cira et al. Reference Cira, Benusiglio and Prakash2015). Here,
 $\theta$
should be the static apparent contact angle measured under spatially uniform humidity conditions, rather than the dynamic angle during droplet motion.
(a) The local relative humidity
 $\phi$
along the substrate. Blue curve, theoretical results (3.8), for a thin film with
 $\theta$
= 0; dots, numerically solved results of
 $\phi$
, for the ambient humidity in the far field
 $\phi _{\infty } = 30.0\,\%$
and
 $\theta = 10^{\circ }$
; red curve,
 $\phi (r)=\lambda (1-\phi _\infty )R/r+\phi _\infty$
, an asymptotic solution of (3.8) with
 $\lambda$
= 0.735; black curve, centrosymmetric solution of
 $\phi (r)$
for the evaporation from a drop floating freely in the air (Cira et al. Reference Cira, Benusiglio and Prakash2015). (b) Apparent contact angle
 $\theta$
as a function of ambient relative humidity
 $\phi$
for a 10 wt % PG droplet on a hydrophilic silicon substrate. The fitting coefficients are
 $m_l=0.036$
and
 $b_l=0.96$
,
 $m_t=0.28$
and
 $\phi _{\textit{eq}}=0.95$
, for two models, respectively.

Several empirical and theoretical relationships have been proposed to characterize the dependence of the apparent contact angle on the ambient humidity. Reported scalings range from
 $\theta \sim (\phi _{\textit{eq}}-\phi )^{1/3}$
to
 $\theta \sim (\phi _{\textit{eq}}-\phi )^{1/2}$
, depending on whether evaporation-induced Marangoni flows are treated explicitly within a lubrication-theory framework (Karpitschka et al. Reference Karpitschka, Liebig and Riegler2017; Wu et al. Reference Wu, Doi and Man2021) or incorporated implicitly through effective interfacial relations (Cira et al. Reference Cira, Benusiglio and Prakash2015). Careful experimental measurements typically yield effective exponents lying between these limiting values, reflecting the combined influence of thermodynamic and hydrodynamic effects near the contact line. Figure 3(b) shows our experimental data together with both scalings discussed. They capture the observed trends over the accessible humidity range, with minor quantitative differences that do not affect the droplet dynamics analysis.
Overall, these
 $\theta -\phi$
relationships supply surface tension variation combining evaporation, interfacial transport, compositional rearrangements and possible Marangoni-induced flows within the contact-line region, without the need to resolve the exact form of surface tension. They provide a basis for modelling the droplet dynamics addressed in this work.
3.2.4. Inverse-square force and cubic kinematics
Building on the humidity analysis and the experimental calibration of the humidity-dependent contact angle established above, we now quantify how the resulting surface tension heterogeneity generates a net driving force on a sessile droplet and governs its subsequent motion. As shown in (3.4), the capillary driving force acting on the sessile droplets originates from the circumferential variation of
 $\gamma$
along the contact line. Projected onto the direction of motion, the force reads
 $F =\boldsymbol{F} \boldsymbol{\cdot }\boldsymbol{e_x}=\int _{0}^{2 \pi } \gamma \cos \varphi R \text{d} \varphi$
, where
 $\varphi$
is the azimuthal angle,
 $\boldsymbol{e_x}$
is the unit vector in the x-direction, as illustrated schematically in figure 1(b). Under the quasistatic assumption, the humidity and the associated surface tension of the precursor film
 $\gamma$
are assumed to remain slaved to the instantaneous droplet configuration. Accordingly,
 $\gamma$
adjusts instantaneously to its local equilibrium value set by the humidity with
 $\gamma (\phi )=\gamma _d\cos \theta (\phi )$
. Here
 $\theta$
parametrizes the macroscopic response of the contact line to humidity, rather than representing a dynamic contact angle during droplet motion. As mentioned above, contact angle is a function of humidity
 $\cos {\theta }=f(\phi )$
. To simplify the analysis,
 $\cos {\theta }$
is expanded linearly,
 \begin{align} f(\phi ) \equiv \cos \theta = f^{\prime }\left (\phi _{\infty }\right )\left (\phi -\phi _{\infty }\right )+f\left (\phi _{\infty }\right )=m \phi +b, \end{align}
with
 $m=f^{\prime }(\phi _{\infty })$
and
 $b=-f^{\prime }(\phi _{\infty })\phi _{\infty }+f(\phi _{\infty })$
. Here
 \begin{align} F=\int _{0}^{2 \pi } \gamma _{d} \cos \theta \cos \varphi R \mathrm{d} \varphi = \gamma _d f'(\phi _\infty ) \int _0^{2\pi } \phi R \cos \varphi \, \text{d}\varphi . \end{align}
Performing a local Taylor expansion of
 $\phi$
about the ‘target’ droplet centre gives
 \begin{align} \int _0^{2\pi }\phi R \cos \varphi \, \text{d}\varphi =\pi R^2 \frac {\partial \phi }{\partial d}, \end{align}
where the zeroth-order contribution vanishes by angular symmetry. This expression shows that the driving force may be interpreted as the product of the wet area of the droplet and the vapour-induced surface-tension gradient evaluated along the direction of motion, with the latter given, to leading order in the humidity perturbation, by the directional derivative of the humidity field at the droplet centre. Therefore, the distribution of the humidity field contributes significantly to the functional form of the driving force. The resulting driving force reads
 \begin{align} F=-\frac {\gamma _{d} m \lambda \pi R^{3}\left (1-\phi _{\infty }\right )}{d^{2}}. \end{align}
The higher-order terms contributing a relative correction can be neglected, which is discussed in the Supplementary material (§ II).
Inclined-plane sliding experiments used to assess the value of
 $l_n$
by a moving droplet. (a) Schematic of a droplet on an inclined silicon wafer (15
 $^{\circ }$
). (b) Generation of a 10 wt % PG aqueous droplet of known volume
 $\varOmega$
from a conical capillary tube (scale bar is 1 mm), ensuring reproducible gravitational force along the incline. (c) Droplet sliding on the inclined wafer at its terminal velocity (scale bar is 2 mm). (d) Comparison of the measured force–velocity relation with the linear scaling and the Cox–Voinov asymptotic form. The drag is evaluated against the component of gravity acting parallel to the substrate.

To close the dynamical problem, it is necessary to determine the coefficient appearing in (3.4). According to lubrication theory for droplets with small contact angles and low capillary number (
 $Ca \ll 1$
), viscous dissipation is dominated by flow near the moving contact line, yielding a linear force–velocity relation
 $F_d = \xi \, \mu R U l_n/{\theta }$
, where the dimensionless prefactor
 $\xi = 3\pi$
arises from the radial and circumferential integration of shear dissipation in the wedge-shaped lubrication flow (de Gennes Reference de Gennes1985). Dedicated sliding experiments were then performed to quantify the logarithmic cutoff factor
 $l_n$
associated with the motion of the same binary droplet, thereby closing the model. For comparison, we consider the Cox–Voinov asymptotic scaling (Voinov Reference Voinov1976; Cox Reference Cox1986; de Gennes et al. Reference de Gennes, Brochard-Wyart and Quéré2003; Reyssat Reference Reyssat2014), which predicts
 $F_d \sim \gamma R \, Ca^{2/3}$
, reflecting the contribution of dynamic contact-angle effects to the viscous resistance (see the Supplementary material § IV).
(a) Temporal evolution of the separation distance
 $L$
as a function of
 $\tau -t$
for different droplet radii
 $R$
and ambient relative humidities
 $\phi _\infty$
. (b) The same data plotted in the rescaled representation collapse onto straight lines. The experiments span droplet radii in the range 0.8–1.8 mm and relative humidities from 19.9 % to 81.1 %. (c) Comparison between the prefactors
 $k_t$
calculated theoretically from (3.15), and
 $k_e$
measured experimentally from (b). Data are selected for
 $\phi _{\infty } \sim$
60 %. (d) The ratio of
 $k_e/k_t$
versus environment humidity
 $\phi _{\infty }$
. Fitting coefficients are
 $m_l = 0.036$
and
 $b_l = 0.96$
,
 $m_t = 0.28$
and
 $\phi _{\textit{eq}} = 0.95$
.

Figure 5. Long description
Panel A: A line graph shows the temporal evolution of the separation distance as a function of time for different droplet radii and ambient relative humidities. The x-axis represents time in seconds, and the y-axis represents the separation distance in millimeters. Different colors and symbols represent various droplet radii and relative humidities. Panel B: The same data is plotted in a rescaled representation, collapsing onto straight lines. The x-axis represents the rescaled time, and the y-axis represents the rescaled separation distance. Panel C: A scatter plot compares the prefactors calculated theoretically from a specific equation and measured experimentally. The x-axis represents the theoretical prefactor, and the y-axis represents the experimental prefactor. Data points are selected for a specific relative humidity. Panel D: A scatter plot shows the ratio of coefficients versus environment humidity. The x-axis represents the environment humidity, and the y-axis represents the ratio of coefficients. Fitting coefficients are provided in the caption.
As shown in figure 4(d), the measured force–velocity relation follows a linear scaling, with no distinct
 $Ca^{2/3}$
trend observed over the explored range. It may be attributed to Marangoni-induced contraction in binary droplets, as previously discussed in similar systems in Karpitschka et al. (Reference Karpitschka, Liebig and Riegler2017) and Shiri et al. (Reference Shiri, Sinha, Baumgartner and Cira2021).
Combining the driving force (3.14) with the measured drag
 $F_d$
into (3.4) yields the droplet velocity
 \begin{align} U = - k/(6d^2)= - k/[6(L+2R)^2], \end{align}
where
 $ k = 2 \gamma _d m \lambda R^2 \theta (1 - \phi _\infty ) / \mu l_n$
. Integrating
 $2U = \text{d}L/\text{d}t$
yields a cubic kinematic scaling for the centre-to-centre distance
 $d=L+2R$
,
 \begin{align} d^3 - (2R)^3 = k (\tau - t), \end{align}
where
 $\tau$
denotes the time of contact.
Applying this transformation to the experimental data reveals a striking linear relation (figures 5
a and 5
b) that all curves collapse onto lines passing through the origin. This confirms that the observed droplet dynamics are consistent with the inverse-square force scaling of (3.14). These experiments covered droplet radii ranging from 0.8 to 1.8 mm and
 $\phi$
from 19.9 % to 81.1 %. Then, we compare the theoretical prefactor
 $k_t$
computed from (3.15) with the experimentally extracted value
 $k_e$
, as shown in figures 5(c) and 5(d). Good agreement is observed for
 $\phi _\infty \sim 60\,\%$
across both calibrations of
 $f(\phi )$
. For more extreme experimental conditions with
 $\phi _\infty \lt$
25 % or
 $\gt$
75 %,
 $k_e / k_t$
calculated from both models deviates from 1, but still spreads mainly between 0.5 and 1.5. The deviation possibly originates from the use of
 $\theta = f(\phi _\infty )$
to predict the influence of local relative humidity on
 $\theta$
(figure 3
b). A more precise model of
 $f(\phi )$
may be worth pursuing, nevertheless, it is shown from figure 5(b) that (3.16) holds for all tested experimental conditions with
 $\phi _\infty \in [19.1\,\%, 81.1\,\%]$
, indicating the inverse-square nature of
 $F$
is beyond reasonable doubt.
Comparison of the droplet kinematics under different experimental conditions. Here (a) 10 wt % PG droplet pairs with different initial radii. (b) Droplet pairs with identical PG concentration in each experiment, where the concentration is varied across different values. (c) Comparison between the theoretical prediction and experimental data reported by Cira et al. (Reference Cira, Benusiglio and Prakash2015), where the theoretical curves are evaluated using the parameters extracted from their measurements. The slope of the experimental fit,
 $k_e = 15.89$
, is consistent with the theoretical value
 $k_t = 16.22$
.

Figure 6. Long description
Panel A: A line graph shows the relationship between the cube of the difference in radii and time for droplet pairs with different initial radii. The x-axis represents time in seconds, and the y-axis represents the cube of the difference in radii in cubic millimeters. Three datasets are plotted: red circles for a radius ratio of 1.21 and a rate constant ratio of 1.13, black squares for a radius ratio of 2.02 and a rate constant ratio of 1.06, and blue diamonds for a radius ratio of 4.27 and a rate constant ratio of 1.70. The lines indicate theoretical predictions, with the red line showing a steeper slope than the black and blue lines. Panel B: Another line graph depicts the relationship between the cube of twice the radius and time for droplet pairs with identical concentrations but varying radii. The x-axis represents time in seconds, and the y-axis represents the cube of twice the radius in cubic millimeters. Three datasets are shown: red circles for 20 weight percent propylene glycol with a radius of 1.04 millimeters, black squares for 40 weight percent with a radius of 1.23 millimeters, and blue diamonds for 60 weight percent with a radius of 1.54 millimeters. The lines represent theoretical predictions, with the red line having the steepest slope, followed by the black and blue lines. Panel C: A line graph compares theoretical predictions with experimental data from Cira et al. The x-axis represents time in seconds, and the y-axis represents the cube of twice the radius in cubic millimeters. Red circles represent experimental data, the dashed line shows a linear fit to the experimental data, and the solid blue line represents the theoretical prediction. The experimental data and the theoretical prediction show a similar trend, with the linear fit closely matching the theoretical prediction.
The effect of transient droplet deformation near the final stage of approach (
 $\tau -t\sim 0$
) is shown to be negligible within the present parameter range (see the Supplementary material § V for details). Accordingly, the droplets may be treated as maintaining a fixed shape in the dynamical analysis. In addition, the maximum surface temperature difference induced by evaporative cooling is of order
 $10^{-3}\,\mathrm{K}$
(Hu & Larson Reference Hu and Larson2002). The associated thermally induced Marangoni force (
 $\sim 10^{-9}\,\mathrm{N}$
) is at least two orders of magnitude smaller than the force arising from concentration-induced surface-tension gradients (
 $\sim 10^{-7}\,\mathrm{N}$
). Evaporative thermal effects can therefore be safely neglected in the present dynamical analysis.
3.3. Robustness of the inverse-square force
We next examine the robustness of the driving force
 $F$
within our PG-water droplet system, considering droplets of different sizes and concentrations. The first test is for two droplets of unequal size. Experimental results (figure 6
a, also see Supplementary material (§ III and Supplementary movie 2)) show that
 \begin{align} d^3 - (R_1 + R_2)^3 = k' (\tau - t), \end{align}
where
 $R_1$
,
 $R_2$
denote the spreading radii of the two droplets, respectively. The driving force of the ‘target’ droplet yields
 $F_{12} = - \lambda m \gamma _d \pi R_1 R_2^{2} (1 - \phi _\infty ) / d^2$
, while the force acting on the ‘source’ droplet reads
 $F_{21} = - \lambda m \gamma _d \pi R_2 R_1^{2} (1 - \phi _\infty ) / d^2$
. Here, the centre-to-centre distance is
 $d =L + R_1 + R_2$
. It is evident that
 $F_{12} \not = F_{21}$
when
 $R_{1} \not = R_{2}$
, indicating they are not action and reaction forces. A complete derivation and accuracy analysis are provided in the Supplementary material (§ III). For moderate size ratios, the ratio
 $k_e/k_t$
remains close to unity, while it increases to approximately 1.7 for large
 $R_1/R_2$
. Nevertheless, the inverse-square dependence of the driving force persists, indicating that the scaling is more robust than the detailed prefactor.
The same inverse-square interaction is observed when the droplet concentration is varied (figure 6 b). Here, the concentration of two droplets is simultaneously selected as 20 wt %, 40 wt % and 60 wt %.
We further test the consistency of the theoretical model against experimental data reported by Cira et al. (Reference Cira, Benusiglio and Prakash2015). Using the parameters extracted from their measurements, the theoretical curve reproduces the observed behaviour. As shown in figure 6(c), the slope of the experimental fit,
 $k_e = 15.89$
, is close to the theoretical value,
 $k_t = 16.22$
, indicating that the inverse-square force scaling predicted by our theory is robust.
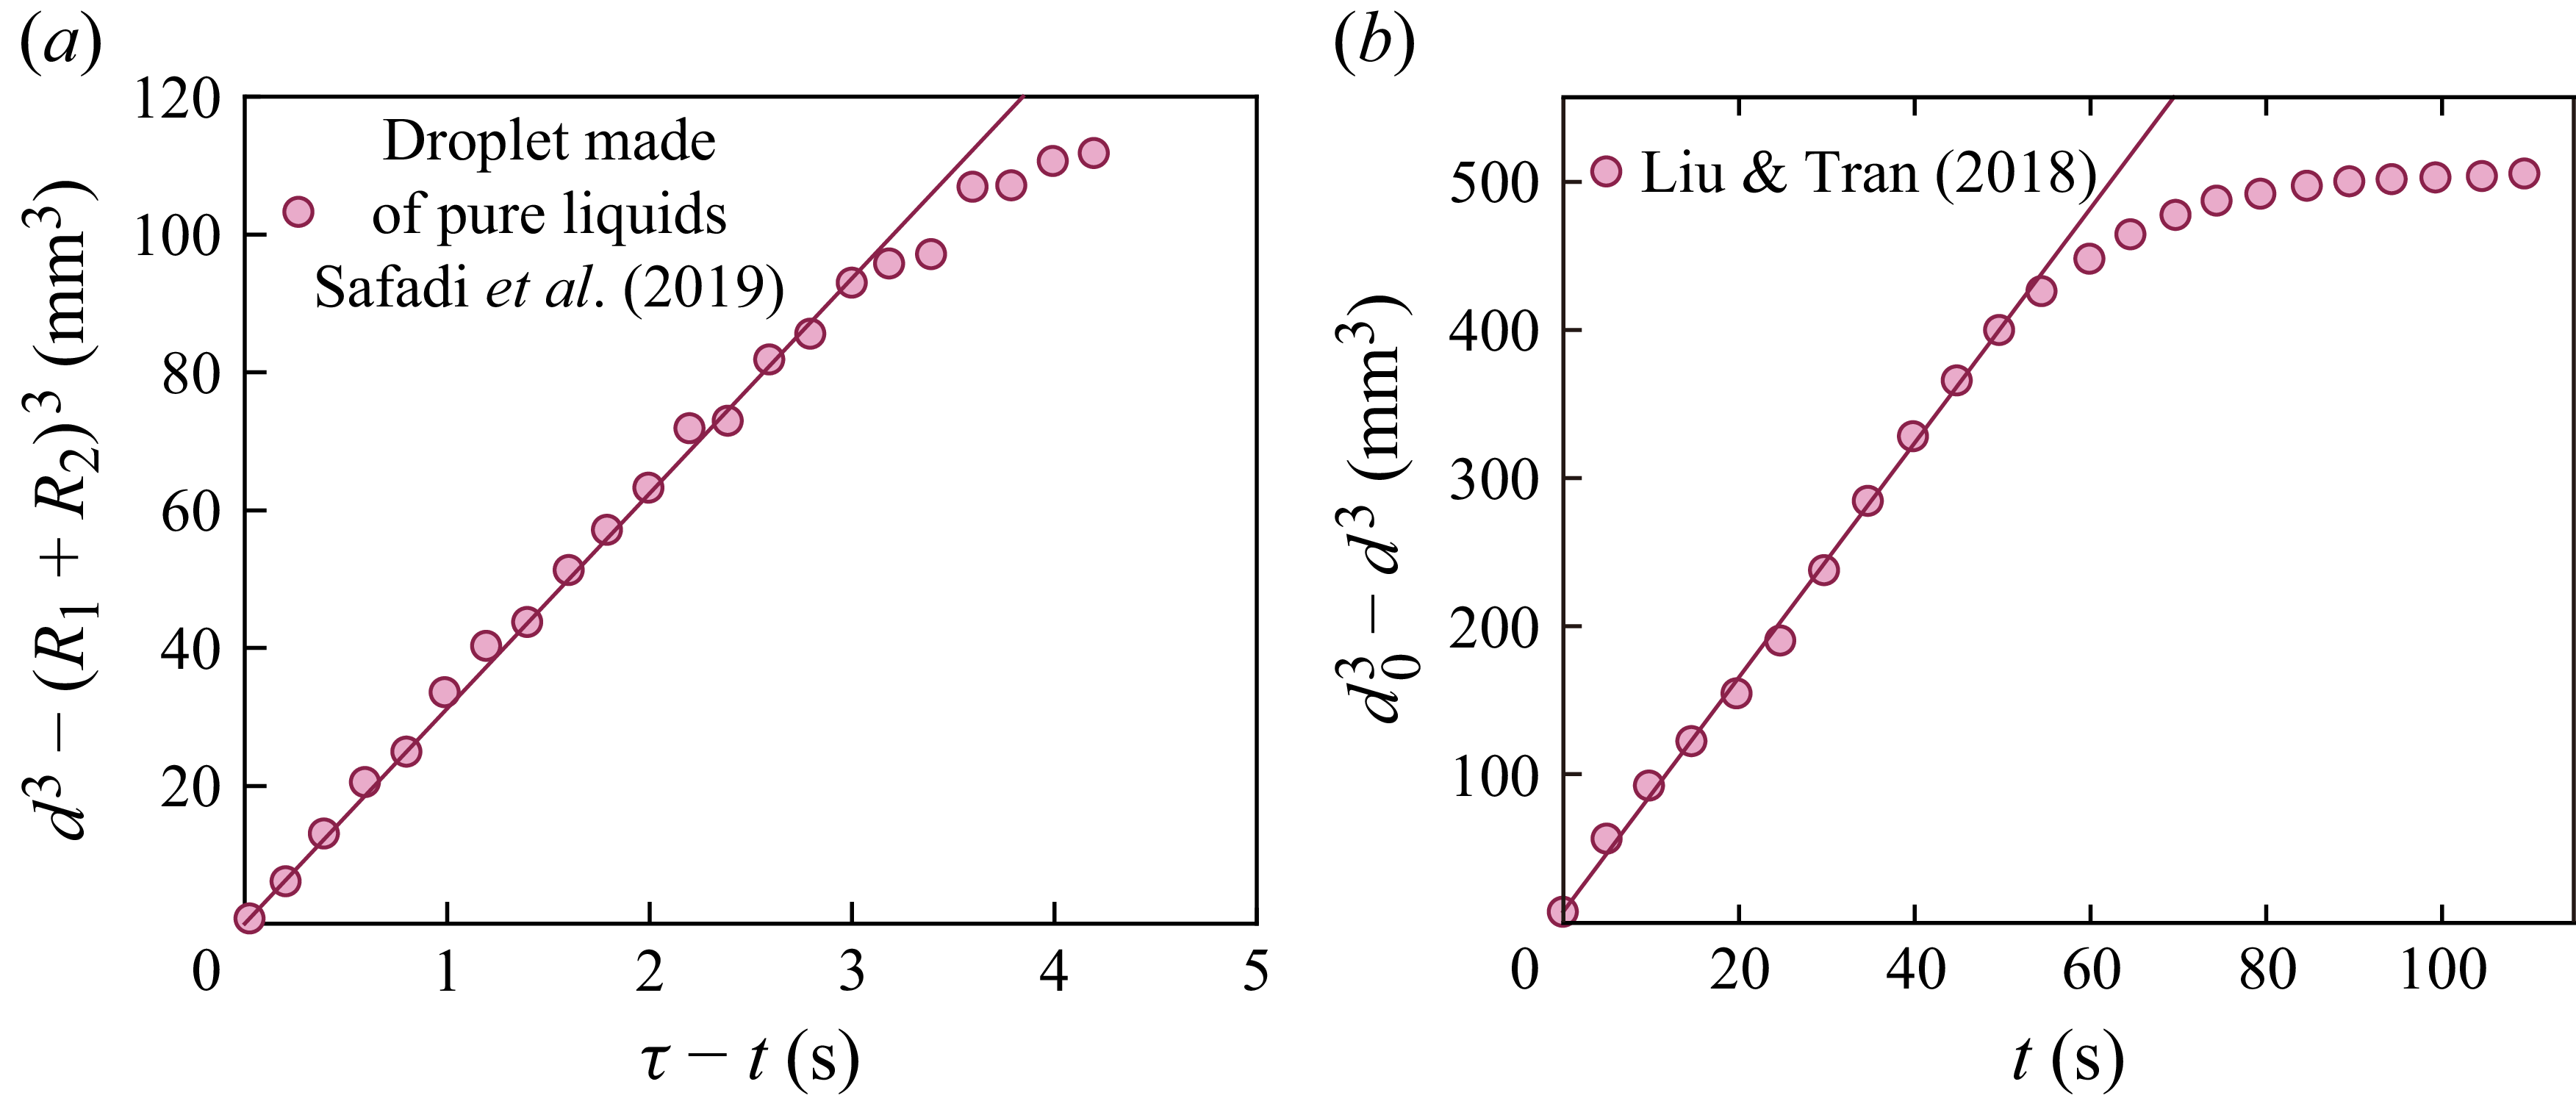
We extend the dynamical analysis to previously studied droplet systems, namely two pure n-Hexane droplets on a solid substrate (Sadafi et al. Reference Sadafi, Dehaeck, blacknikov and Colinet2019) and floating binary droplets on a liquid free surface (Liu & Tran Reference Liu and Tran2018). In both systems, interactions are mediated by undisturbed three-dimensional vapour or temperature fields. For the pure sessile droplets, motion is driven by evaporation-induced variations of the apparent contact angle and by thermal Marangoni stresses arising from substrate temperature gradients. For floating binary droplets, motion is driven by thermocapillary stresses induced by a temperature gradient across the droplet cap (Liu & Tran Reference Liu and Tran2018). Both systems yield the same inverse-square interaction law, and in both cases the drag force scales linearly with droplet velocity. Accordingly, the droplet dynamics predict the same cubic scaling of distance with time,
 $d^3 \sim t$
, as in our experiments (as derived from the droplet dynamics analyses in these studies; detailed derivations are provided in §§ VII and VIII of the Supplementary material). This prediction is confirmed by the kinematic data extracted from the previous studies, as shown in figure 7. To obtain a straight line through the origin, time
 $ t$
rather than
 $\tau - t$
in figure 7(b) is used to present the kinematic relationship. The reason is that the thermally affected zones of two droplets will overlap as distance
 $d$
keeps decreasing, which in turn interferes with droplet motion, evidenced by data deviation from prediction for
 $t \gt$
50 s.
Kinematics of droplet motion driven by evaporative thermocapillary effects. Data fall into straight lines, consistent with theoretical predictions, demonstrating an inverse-square force between (a) droplets made of pure liquid (experimental data extracted from Sadafi et al. (Reference Sadafi, Dehaeck, blacknikov and Colinet2019)), and (b) two 80 wt % isopropyl alcohol aqueous droplets floating on a silicone oil pool (experimental data extracted from Liu & Tran (Reference Liu and Tran2018)). For (b), deviation occurs when thermally affected zones of two droplets overlap, which introduces additional hydrodynamic interactions and interferes with droplet motion.

4. Conclusion
Droplets are ubiquitous in natural phenomena and industrial applications, and precise control over their transport is a fundamental requirement for many physical and chemical processes. In this work, we have discovered an inverse-square force law between evaporating sessile droplets. When a target droplet is exposed to the spatially non-uniform vapour field generated by a neighbouring source droplet, the resulting asymmetric interfacial response near the contact line produces a non-zero net force. The inverse-distance decay of the vapour concentration around the source droplet is a key ingredient leading to the inverse-square dependence of this force on the centre-to-centre distance. The force law is supported by the cubic kinematic relation observed over ranges of droplet size, composition and ambient humidity.
The theory developed here combines continuum hydrodynamics with an effective capillary line-force representation of the localized interfacial stresses near the contact line. This representation distils the integrated effect of the strongly localized interfacial-stress variations and quantitatively captures the measured droplet dynamics, without requiring full resolution of the microscopic Marangoni flow, compositional transport and contact-line motion. The conditions under which this simplified capillary treatment becomes quantitatively equivalent to a full hydrodynamic treatment remain to be fully established. Such equivalence is expected to depend primarily on the localization of the interfacial stresses, the vapour-induced contact-line response and the dominant hydrodynamic dissipation mechanism.
The present results suggest that an inverse-square force can arise when a diffusion-controlled scalar field couples to a localized asymmetric interfacial-stress response and the resulting droplet motion remains quasistatic. Its broader applicability is further supported by our analysis of previously published kinematic data for pure-liquid sessile droplets and thermocapillary floating droplets. The cubic kinematic relation also provides a practical diagnostic for identifying an inverse-square driving force from droplet trajectories. This diagnostic is experimentally accessible and does not require full resolution of the microscopic flow field. In multidroplet systems, however, the vapour field is not necessarily a simple linear superposition, especially when neighbouring fields overlap and the local relative humidity approaches saturation. Confined geometries may further modify the scalar-field decay and hence the force. These effects define natural directions for future work.
Supplementary materials and movies
Supplementary materials and movies are available at https://doi.org/10.1017/jfm.2026.11903.
Funding
This study was supported by the National Natural Science Foundation of China (12388101, 11972339, 11932019).
Declaration of interests
The authors report no conflict of interest.
 ∘

 γ
 γd
 γ
 θ

 R=1.55
 ϕ∞=
 ∘
 R
 1.37±0.02
 ϕ∞
 51.3%±2.0

 ϕ
 θ
 ϕ
 ϕ∞=30.0%
 θ=10∘
 ϕ(r)=λ(1−ϕ∞)R/r+ϕ∞
 λ
 ϕ(r)
 θ
 ϕ
 ml=0.036
 bl=0.96
 mt=0.28
 ϕeq=0.95

 ln
 ∘
 Ω

 L
 τ−t
 R
 ϕ∞
 kt
 ke
 ϕ∞∼
 ke/kt
 ϕ∞
 ml=0.036
 bl=0.96
 mt=0.28
 ϕeq=0.95

 ke=15.89
 kt=16.22